INSTITUTE OF PHYSICS PUBLISHING
JOURNAL OF MICROMECHANICS AND MICROENGINEERING
J. Micromech. Microeng. 15 (2005) 221–230
doi:10.1088/0960-1317/15/1/031
Cost-effective thermal isolation techniques for use on microfabricated DNA amplification and analysis devices Ming Yang1,2, Rohit Pal1,2 and Mark A Burns1,3 1 Department of Chemical Engineering, The University of Michigan, Ann Arbor, MI 48109-2136, USA 2 Department of Electrical Engineering and Computer Science, The University of Michigan, Ann Arbor, MI 48109-2136, USA 3 Department of Biomedical Engineering, The University of Michigan, Ann Arbor, MI 48109-2136, USA
E-mail:
[email protected]
Received 14 June 2004, in final form 4 October 2004 Published 29 October 2004 Online at stacks.iop.org/JMM/15/221 Abstract In this paper, we describe the design, construction and operation of two low cost thermal isolation techniques on a microfabricated DNA amplification and analysis device. The thermal conduit technique is based on a selective conduction mechanism, while the silicon back dicing technique is based on a selective insulation mechanism. The performances of the two techniques are compared both numerically and experimentally to that of the widely adopted but costly silicon back etching technique. Temperature gradients as high as 108 ◦ C cm−1, 92 ◦ C cm−1 and 158 ◦ C cm−1 can be achieved with the three techniques, respectively. Geometric optimization of the two low cost techniques is carried out to further improve their thermal performances. Combining those two techniques can provide comparable thermal isolation results as the back etching technique with significant cost reduction. (Some figures in this article are in colour only in the electronic version)
1. Introduction In recent years, microfabricated devices have emerged as powerful tools for performing high throughput, low cost, and high efficiency DNA analysis. Many microfabricated integrated DNA amplification and analysis systems have been reported [1–9]. The key advantage of microfabricated devices is that they have the potential to integrate multiple functional components onto a small platform to form a highly automated analysis system. Because these microfabricated devices can be mass produced by semiconductor fabrication processes, a reduction in size leads to a reduction in cost of the individual devices, a concept that is responsible for the ever decreasing cost of computer microprocessors. For DNA amplification and analysis systems, thermal interaction or ‘crosstalk’ emerges as an important issue as the device size decreases. Most DNA assays are highly temperature sensitive and require precise temperature settings 0960-1317/05/010221+10$30.00
to function properly. For example, the routinely used polymerase chain reaction (PCR) is performed in a thermal cycling format at temperatures of 94 ◦ C, 55 ◦ C and 72 ◦ C while most restriction endonucleases in restriction digest reactions are inactivated at temperatures above 65 ◦ C. Also, polyacrylamide or agarose gels used for DNA electrophoretic separation can degrade or melt at elevated temperatures. When integrating these and other temperature-sensitive analytical components on a microfabricated device, thermal crosstalk can adversely affect device performance. The problem becomes more prominent as the device size decreases and when using high-conductivity substrates (e.g., silicon). To ensure the proper operation, individual temperature-sensitive components on a microfabricated device should be thermally isolated. Most existing thermal isolation techniques in microsystems use thin silicon or silicon derivative structures such as diaphragms, bridges or cantilever beams to insulate
© 2005 IOP Publishing Ltd Printed in the UK
221
M Yang et al
sensitive components [10–15]. These structures provide excellent thermal isolation because of their high thermal resistance. However, the low mechanical stability of such structures decreases the yield of devices and increases the device cost. Many of these structures require complicated fabrication processes, further increasing the device cost. In other applications, low thermal conductivity materials such as quartz [16] and ceramics [17] have been used to achieve thermal isolation but the use of these materials is not compatible with standard semiconductor fabrication technologies. Low thermal conductivity porous silicon has been used in several thermal isolation applications [18–20] because of its semiconductor-compatible fabrication process and better mechanical stability than thin silicon microstructures. However, its fabrication is rather complicated (including deposition of Poly-Si/SiO2 mask, electrochemical dissolution in HF–ethanol solution and post-anodization treatments). Intensive work has been done on thermal management and optimization for PCR devices [21–28]. However, most of these works focused on increasing thermocycling rate, improving temperature uniformity and reducing power consumption. Few of them addressed and investigated the thermal isolation issue. We have explored the possibility of applying low cost thermal isolation techniques on silicon-based microfabricated DNA amplification and analysis devices. We have investigated three thermal isolation techniques: thermal conduits, silicon back dicing and silicon back etching. The thermal conduit technique is based on selectively increasing the vertical heat conduction at desired low-temperature regions, while the silicon back dicing and back etching techniques are based on physically insulating the high-temperature region from the low-temperature regions. The performances of these techniques have been predicted by heat transfer simulations and verified by experimental data. The fabrication cost of these techniques has also been estimated. The techniques have been evaluated in terms of temperature distribution, power consumption and heating and cooling rates. The results show that the thermal conduit technique and the silicon back dicing technique can be inexpensive alternatives to the widely adopted but costly silicon back etching technique.
2. Materials and methods 2.1. Device fabrication and assembly 2.1.1. Silicon substrate. A 4-inch, 500 µm thick p-type silicon wafer is used as the silicon substrate. A silicon oxide/nitride/oxide dielectric film is deposited on the silicon substrate by low-pressure chemical vapor deposition ˚ 1000 A ˚ (LPCVD). The thickness of the three layers is 2000 A, ˚ respectively. After the LPCVD step, a positive and 2000 A, photoresist (Microposit SC 1827, Shipley, Marlborough, MA) is spin coated and patterned on top of the dielectric film by ˚ photolithography. A thin titanium/platinum film (300 A/ ˚ 2000 A) is then deposited on top of the patterned photoresist by electron beam evaporation. The photoresist and the overlaying metal layers are then lifted off by acetone. Next, a 5 µm Parylene layer is deposited on top of the metal layers at room temperature in a Parylene deposition system (PDS 2010 222
(a)
(b) silicon substrate
glass substrate
deposit oxide/nitride/oxide film (2000Å/1000Å/2000Å)
evaporate Cr/Au film (500Å /3000Å)
spin coat photoresist and UV expose
spin coat photoresist and UV expose
develop photoresist and evaporate Ti/Pt film (300Å/2000Å)
develop photoresist and etch Cr/Au layer
lift-off metal and coat parylene (5µm)
etch glass, form fluidic channels (50µm)
silicon back side lithography and DRIE
remove remaining photoresist and Cr/Au
bond silicon to glass substrate using UV curable optic glue
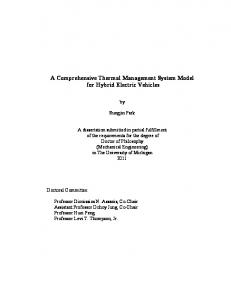
Figure 1. Microfabrication process flow. (a) Silicon side with heaters, temperature sensors, Parylene barrier layer and dielectric diaphragm structures. (b) Glass side with etched microfluidic channels.
LABCOTER 2, Specialty Coating Systems, Indianapolis, IN). A second lithography is carried out and the Parylene layer is etched by an oxygen plasma reactive ion etching (RIE) process to expose buried metal contact pads for electric connection. Next, a third lithography is carried out on the backside of the silicon substrate and the silicon oxide/nitride/oxide film on the backside of the silicon substrate is etched by a CF4/CHF3 plasma RIE process. A deep reactive ion etching (DRIE) process is then carried out to remove the silicon substrate under the heaters. The silicon side fabrication process is shown in figure 1(a). 2.1.2. Glass substrate. A 4-inch, 500 µm thick borofloat glass wafer is used as the glass substrate. The glass wafer is first annealed at 600 ◦ C for 12 h to provide a smooth ´˚ ´˚ etching profile. A chromium/gold film (500 A/3000 A) is then deposited on the glass substrate by electron beam evaporation. A positive photoresist (Microposit SC 1827, Shipley, Marlborough, MA) is spin coated on top of the metal layers and patterned by photolithography. The wafer is then dipped into a gold etchant (Gold Etchant TFA, Transene Co.) for 4 min to remove the gold layer, followed by dipping into a chromium etchant (CR-14, Cyantek Inc.) for 2.5 min to
Cost-effective thermal isolation techniques on microfabricated devices
remove the chromium layer. 50 µm deep fluidic channels are formed by dipping the wafer into a freshly prepared hydrofluoric acid solution (49% HF, CMOS grade, J T Baker) for 8 min to etch the exposed glass substrate. The remaining photoresist and metal layers are then removed. The wafer is rinsed in DI water, air dried and then oven dried at 100 ◦ C for 20 min. The glass side fabrication process is shown in figure 1(b).
the backside of the silicon substrate by a computer controlled dicing system (RFK 7150, Diamond Touch Technologies Inc.) during the wafer dicing process. A single cut by the dicing saw can create a trench about 300 µm wide. Wider trenches can be obtained by making several partially overlapped cuts. The depth of the cutting can be preset in the computer. Using the dicing system, the deepest trenches we can make are about 450 µm, which is 90% of the thickness of the silicon substrate.
2.1.3. Device assembly. The silicon wafer and the glass wafer are diced into individual devices by a computer controlled dicing system (RFK 7150, Diamond Touch Technologies Inc.). The inlet holes of the channels are drilled on the glass wafer by a homemade electrochemical discharge drilling apparatus. The glass channel is then bonded to the silicon substrate using an optical adhesive (NOA 72, Norland Products Inc.) The bond is cured under an ultraviolet light source (365 nm) for 3 h, followed by incubation in an oven at 50 ◦ C for 12 h. This die-level bonding technique is a reliable low temperature bonding process and has been proven to be compatible with our device operation. However, it is also an expensive manual process. We are currently testing low temperature wafer-level bonding techniques and intend to replace the chip bonding process in the future to reduce the device cost. The assembled device is then glued to a printed circuit board (PCB) by an epoxy adhesive. Finally, the device is wire bonded to the PCB by a gold wire ball bonder (Model 4124, Kulicke and Soffa Industries Inc.) for electrical connection with the external electrical control circuitry.
2.2. Instrumentation
2.1.4. Construction of the thermal conduit technique. The thermal conduit structure is constructed by routing out specific regions on a PCB by an 8-inch bench top drill press. After gluing the device to the PCB, high thermal conductivity materials are used to fill the routed-out regions. Two materials have been used in our tests. The first material is a silicone-based thermal grease (Product #54013, AOS Thermal Compounds). It is made from a silicone fluid thickened with metal oxide fillers and appears as a white paste-like product at room temperature. Its thermal conductivity is 0.735 W (m ◦ C)−1. Because of its fluidic nature, it can be easily applied to the routed-out region in the PCB. The second material is copper, which has very high thermal conductivity (398 W (m ◦ C)−1). A copper sheet (∼1.5 mm thick) is cut into small pieces with approximately the same size and shape as the routed-out region in the PCB and then inserted into it. A small amount of thermal grease is also applied to enhance the thermal contact between the copper insert and the silicon substrate. The construction is not a highly automated process, but it can provide a short turnaround time when only a few devices are needed. When a large number of devices are in demand, computer aided design and computer controlled mechanical machining can be used to make the thermal conduit technique a highly automated process. 2.1.5. Construction of the silicon back dicing technique. In the silicon back dicing technique, deep trenches are made on
The device is connected to an external control circuitry through the PCB for precise temperature control (±0.1 ◦ C). The circuitry consists of an amplification circuit, a data acquisition (DAQ) system, a power supply and a LabVIEW program with automatic control algorithm and graphic user interface. The measurement of the temperature sensors can be stored in the program and then exported as a Microsoft excel file. When testing the thermal isolation techniques, the assembled device is placed on a copper heat sink that sits on a probe station chuck whose temperature is controlled at 10 ◦ C by a refrigerated bath circulator (RTE-211, Thermo Neslab).
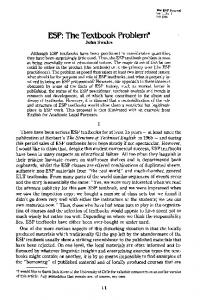
3. Results and discussion 3.1. Device design and modeling A silicon/glass biochemical reaction device was designed and fabricated for testing the proposed thermal isolation techniques. Figure 2 shows the layout and cross-sectional view of the device. The device contains three reaction chambers on the glass substrate and three heater and sensor units on the silicon substrate. Each reaction chamber is about 4 mm long and 2 mm wide. The distances between chambers 1 and 2, and chambers 1 and 3 are approximately 7 mm and 10 mm, respectively. Each heater and sensor unit below a reaction chamber can individually control the temperature of that chamber. There is also an additional temperature sensor at the center of the device. A picture of a device fabricated by the silicon back etching technique is shown in figure 2(c). The typical temperature distribution on such devices is fairly uniform when no thermal isolation techniques are applied and no heat sink is used. Figure 3 shows the experimental measurement of the temperature–time course of such a device undergoing heating in reaction chamber 1. When the temperature in reaction chamber 1 is raised to 95 ◦ C, the temperatures at other locations (sensors 2, 3 and 4) are at least 80 ◦ C. This fairly uniform temperature distribution indicates that thermal crosstalk on such devices is severe and thermal isolation is almost negligible. Steady-state heat transfer simulations have been carried out using FEA software ANSYS in order to clarify the thermal characteristics of the device under different thermal isolation conditions. The model system, shown in figure 4(a), consists of three bonded parts: a top glass substrate, a middle silicon substrate and a bottom PCB. The three parts are drawn separately in the figure for easy viewing of the inner structures. The glass substrate contains a water-filled reaction chamber under which is located a heater on the silicon substrate. The 223
M Yang et al
Table 1. Thermal conductivity of different materials.
(a)
Thermal Material Silicon Glass Water PCB grease Copper Air K (W m−1 ◦ C−1) 148 1.4 0.6 0.2 0.735 398 0.0256
heater
3 4
16 mm reaction chamber
Table 2. Comparison of the experimental and simulation results of the base case.
1
2
sensor
Experimental data Simulation data
15 mm reaction chamber
(b) barrier layer
Figure 2. Schematic of the microfabricated device. (a) Top view and (b) cross-section view. The device has three reaction chambers on the top glass substrate, three heaters and four temperature sensors on the bottom silicon substrate for temperature control. (c) Picture of a silicon substrate showing three silicon back etching regions. The regions are transparent because the silicon substrate underneath has been etched away completely leaving only a very thin (0.5 µm) dielectric diaphragm.
100 90 80 70
o
Temperature ( C)
95 95
84 88
81 86
85 89
− k · ∇T = h(T − Tambient )
(c)
60 50
1 2 3 4
40 30 20 10 0 3
4
5
Time (min)
Figure 3. Typical temperature distribution on a device without using thermal isolation techniques. Curves1–4 are from the temperature readings of the four sensors (see figure 2).
dielectric layer and the Parylene barrier layer between the silicon and glass substrates are omitted in the model because their contribution to thermal conduction is negligible. The 224
Sensor 4
heater is set to a constant temperature of 95 ◦ C, and natural convective heat transfer boundary conditions are applied to all surfaces exposed to air: PCB
2
Sensor 3
dielectric layer
glass
1
Sensor 2
heater
silicon
0
Sensor 1
where heat transfer coefficient h is 37 W (m2 ◦ C)−1 and Tambient is the room temperature (23 ◦ C). The thermal conductivities of all materials used in the model are listed in table 1 [29–31]. The simulation results confirm the experimental data. As shown in figure 4(b), the temperature across the entire device is quite uniform, and the temperatures at the four sensors are close to the experimental data (table 2). The temperature difference between the heater and the other three sensors is less than 15 ◦ C; this poor thermal isolation is mainly caused by the high thermal conductivity of the silicon substrate. Thermal energy can be easily transferred from the heater to the entire device through the silicon substrate. As a result, the temperature of the entire device is raised fairly uniformly. In table 2, the simulation results and the experimental data differ by about 5%. It is important to note that no adjustable parameters have been used in the simulations and the literature values used for the parameters could be different from the actual values. Also alternate boundary conditions could have been used. For example, in the FEA simulation, a heat flux instead of a constant temperature could also be used as the boundary condition on the heater. The heat flux input is closer to reality because the temperature of the heater area is most likely not uniform. However, we found that using such a boundary condition resulted in only a minor change (∼2 ◦ C) in the predicted solutions (figure 4(c)). Since the simulations using heat flux input require lots of trial-and-error runs, for our qualitative predictions, we chose the constant temperature boundary condition for simplicity and ease of use. Further optimization on the model boundary conditions would improve the performance of simulation results and could result in more accurate quantitative predictions. 3.2. Selective conduction versus selective insulation The thermal isolation techniques we have investigated are based on two principles: selective conduction and selective insulation. High temperature gradients across the device can be achieved by either selectively enhancing the vertical heat conduction near the desired low-temperature regions or selectively insulating the high-temperature regions from
Cost-effective thermal isolation techniques on microfabricated devices
(a)
Glass
Reaction Chamber
Silicon
Heater Etched Cavity
Thermal conduit
Trenches PCB
(b)
(c)
3
3
4
4 1 2
1 2
Figure 4. The simulation model and simulated temperature distribution on a regular device. (a) 3D schematic of the device used in the simulations including all thermal isolation structures. (b) Simulation result on a regular device with constant temperature as the boundary condition for the heater. (c) Simulation result on a regular device with heat flux as the boundary condition for the heater. The black line surrounded rectangle represents the location of the heater. 1–4 indicate the locations of the four sensors.
the rest of the device. Obviously the thermal conduit technique uses the former mechanism, while the back dicing and back etching techniques mainly use the latter one. A low temperature heat sink under the assembled device can efficiently remove excess thermal energy from the device and enhance the thermal isolation; therefore, it has been used when testing the proposed techniques. According to the simulation results shown in figure 5, increased temperature gradients across the device can be achieved using all of the proposed thermal isolation techniques. Because of the use of a heat sink under the PCB, we changed the boundary condition of the bottom surface of the PCB from natural convection to constant temperature at 10 ◦ C in these simulations. Because the locations of sensors 1, 4 and 3 are essentially on a straight line (the distance is 5 mm between each two adjacent sensors), we can use the temperature profile along this line to estimate temperature gradients (figure 6(a)). The data show that a heat sink alone can slightly increase the temperature gradient across the device. A copper thermal conduit provides much better thermal isolation capability than thermal grease because of its higher thermal conductivity. The silicon back dicing technique can provide better thermal isolation than the thermal grease but not as good as the copper. Clearly the back etching technique creates the highest temperature gradient among all the proposed techniques.
The experimental results, plotted in the same fashion as figure 6(a) and shown in figure 6(b), verify the general trend that the simulation results predicted. Although the temperature values from both plots are not identical, the patterns and the general trend on the two plots are similar. We also roughly estimated the temperature gradients between sensors 1 and 4 using the data in the plot. For instance, using the back etching technique, a temperature gradient of 79 ◦ C/0.5 cm = 158 ◦ C cm−1 can be obtained. Compared to the temperature gradient of the base case (20 ◦ C cm−1) in which no thermal isolation techniques are used, all of the proposed techniques provide at least three times higher thermal gradients. While all the techniques can provide some degree of thermal isolation, the power consumption and the heating and cooling rates for devices constructed by each technique are different. Techniques that use the selective conduction mechanism have higher power consumption, lower heating rate and faster cooling rate than the base case due to the enhanced heat conduction. In contrast, techniques that use the selective insulation mechanism have lower power consumption, higher heating rate and lower cooling rate due to the reduced heat dissipation. Table 3 summarizes the experimental data. The only result in table 3 inconsistent with the previous discussion is that the back etching technique has a high cooling 225
M Yang et al
(a)
(b)
3
3 4
4 1
1
2
2
(c)
(d)
3
3
4
4
1
1 2
2
(e)
3 4 1 2
Figure 5. Theoretical comparison of thermal isolation techniques. (a) Device with heat sink only. (b) Device with a thermal grease ‘thermal conduit.’ (c) Device with a copper ‘thermal conduit.’ (d ) Device with two back-diced trenches. (e) Device with a dielectric diaphragm. Dotted lines surrounding areas represent the locations of different structures. The locations of numbers 1–4 correspond to the locations of the four sensors on the device.
Table 3. Comparison of different thermal isolation techniques.
Technique
Temperature Power Heating Cooling gradient consumption rate rate (W) (◦ C s−1) (◦ C s−1) (◦ C cm−1)
Base case 20 Heat sink only 48 Thermal grease 60 Copper conduit 108 Back dicing 92 Back etching 158
2.5 6 7 13 4.5 0.4
25 24 20 17 27 42
0.5 3.1 4.4 10.6 4.4 15
rate. The likely explanation is that the cooling rate is not only determined by the heat dissipation rate, but also by the amount of energy to be dissipated. In the silicon back 226
etching technique, the stored thermal energy in the reaction chamber and its nearby region during the heating stage is significantly reduced because of both the silicon thermal mass removal under the reaction chamber and the highly localized temperature increase (i.e., figure 5(e) versus figure 5(a)). Thus, the more than an order of magnitude lower energy content can be more quickly dissipated even though the area for heat transfer from the device has been reduced by less than 10%. Of course, more detailed unsteady-state simulations can be used to corroborate this hypothesis and predict the optimal design for high cooling rate. Although the back etching technique has superior performance in terms of thermal gradient, power consumption, and heating and cooling rates, the complicated fabrication
Cost-effective thermal isolation techniques on microfabricated devices
(a)
100
100
90
90
1 80
80 70 o
60
Temperature ( C)
o
Temperature ( C)
2 70
3
50
4
40 30
5 6
20
40
5
30
6 10
0
0 0.0
0.1
0.2
0.3
0.4
0.5
0.6
0.7
0.8
0.9
1.0
1.1
0.0
0.1
0.2
0.3
0.4
0.5
0.6
0.7
0.8
0.9
1.0
1.1
distance from the heater (cm)
distance from the heater (cm) 100
Figure 7. Comparison of simulation results for devices with and without active cooling. Curve numbers: 1, thermal grease conduit without active cooling; 2, thermal grease conduit with active cooling; 3, silicon back dicing without cooling; 4, silicon back dicing with cooling; 5, copper conduit without cooling; 6, copper conduit with cooling.
90
1
80 70
o
Temperature ( C)
50
20
10
(b)
1 2 3 4
60
2
60
3 50
4
40
5
30 20
6
10 0 0.0
0.1
0.2
0.3
0.4
0.5
0.6
0.7
0.8
0.9
1.0
1.1
Distance from the heater (cm)
Figure 6. Temperature profile along sensors 1–4–3. (a) Simulation results. (b) Experimental results. Curve numbers: 1, base case; 2, heat sink only; 3, thermal grease conduit; 4, silicon back dicing; 5, copper conduit; 6, silicon back etching.
processes significantly increase the cost of the devices. For all the devices used in this study, the silicon side fabrication includes two lithographies, one metal E-beam evaporation and liftoff, one Parylene deposition and one plasma RIE. A back etched device requires several additional steps including one lithography, one dielectric layer LPCVD and one silicon backside DRIE. Based on our calculation, the cost of a fully assembled device without dielectric diaphragm in our fabrication facility is about $16, while that of a back etching device is $25 (∼56% increase). On the other hand, the costs of a fully assembled device with the thermal conduit and with back dicing process are about $17 and $18, respectively. Compared to the base case, the cost increases are only approximately 6% and 12% mainly because no clean room fabrication is required for either technique. In addition, the yield of the back etching process is only about 20–25%, mainly caused by the breakdown of the dielectric diaphragm. The low yield will result in a 4–5 times increase in the already high cost for the back etching technique. The DRIE process could be replaced by cheaper KOH etching to reduce the fabrication cost to some extent. However, protection of the front side of the device is necessary and may result in a more expensive or time-consuming total process. Although the cost increase is calculated based on the processing cost in our fabrication facility, it is reasonable to believe that the differential cost in
an industrial fabrication foundry would be comparable. Thus, both thermal conduit and silicon back dicing techniques are good alternative techniques for low cost applications. Note that we have used an active cooling system (a cold chuck and a heat sink) in the proposed techniques to enhance the thermal isolation effect. The simulation results shown in figure 7 indicate that the temperature on a device without active cooling would likely increase by as much as 15 ◦ C. This temperature increase may not adversely affect the device function with the current device size. However, the potential to further reduce the device size by using the proposed techniques is limited without active cooling. On the other hand, the added cost of an active cooling system can be relatively low by using inexpensive and battery-powered thermoelectric active cooling devices (Peltier devices). A commercial Peltier device of our device size costs slightly more than 10 dollars but can be used repeatedly for multiple disposable devices (i.e., part of the ‘base unit’). Therefore, inclusion of an inexpensive active cooling system would not noticeably increase the cost of the devices. 3.3. Geometric optimization Better thermal isolation can be obtained by geometric optimization of the designs we have presented so far. By optimizing the location, depth and width of the thermal isolation structures, we can regulate the amount of thermal energy being transferred across the device and consequently achieve the best result for each technique. Note that the simulation results presented in this section are obtained from simplified 2D models in order to save computing time. In all of the models, the heater is 2 mm wide and an arbitrary point B 5 mm away from the edge of the heater has been chosen as the point of interest. The goal of the optimization is to keep the temperature at point B as low as possible. The simulations revealed that the optimal locations of the thermal isolation structures are quite different for the thermal conduit technique and the back dicing technique. Figure 8 (solid line) shows the location optimization of a 3 mm wide 227
M Yang et al location of the thermal isolating structures temperature at point B ( C)
temperature at point B (oC)
depth of the back dicing
B
100
o
90 80 70 60 50 40
B
B
30 20
0
1
2
3
4
5
6
7
8
9
10
Figure 8. Temperature at point B as a function of the distance between the center of the heater and the center of the thermal isolating structures (thermal conduit and back diced trench). Point B is 6 mm away from the center of the heater. Both structures are 3 mm wide and the trench is 0.45 mm deep. The insets show changing the location of the structures (left: back-diced trench; right: thermal conduit). width of the thermal isolating structures 100 o
B
20 10 0
90 80 70 60 50 40
B
B
30 20 10 0 0
1
2
3
4
5
6
7
8
9
10
0.1
0.2 0.3 0.4 depth of the trench (mm)
0.5
0.6
11
distance between the heater and the structures (mm)
temperature at point B ( C)
70 60 50 40 30
0
10 0
11
width of the structures (mm)
Figure 9. Temperature at point B as a function of the width of the thermal isolating structures (thermal conduit and back diced trench). The insets show changing the width of the structures (left: back-diced trench; right: thermal conduit).
copper conduit. The data show that the optimal location of the thermal conduit is directly under point B. The temperature at point B is the lowest because the maximum amount of thermal energy can be removed from point B in this case. For a 3 mm wide back-diced trench, however, the data in figure 8 (dash line) clearly show that the optimal location is not directly under point B but right next to the heater. In this case, the trench impedes lateral heat transfer from the heater while the silicon substrate under point B conducts heat away. The combined effects of conduction and insulation provide the best results. In addition to the location of the structure, the width also strongly affects the thermal properties. Wider conduits (larger contact area) are able to remove more thermal energy and provide lower temperature at point B, as shown in figure 9 (solid line). Therefore, the thermal conduit should cover as much of the desired low-temperature region as possible. The conduit should not be extended under the desired hightemperature region, though, because power consumption will increase. For the back dicing technique, generally, a wider trench can impose higher thermal resistance to the lateral heat transfer and provide better isolation results. However, the simulation data in figure 9 (dash line) show that the lowest 228
100 90 80
Figure 10. Temperature at point B as a function of the trench depth. The trench is 3 mm wide and is at its optimal location, as shown in the inset.
temperature at point B is obtained when the trench width approximates the distance between the edge of the heater and point B. Increasing the width of the trench beyond this point effectively places point B on lateral conduction path and, therefore, a linear temperature gradient between the high and low temperature points. The longer the conduction path, the closer (proportionally) point B becomes to the heated region, and, thus, the higher the temperature at this point. The depth of the back-diced trench is another factor that affects the thermal properties. The deeper the trench is, the higher the thermal resistance of the top thin silicon membrane. Therefore, deeper trenches can reduce the lateral thermal conduction more and provide better isolation results. As shown in figure 10, a very low temperature at point B can be reached if the trench depth equals the depth of the silicon substrate (0.5 mm). Practically, however, we are not able to accomplish this due to the resolution constraint of the dicing system. The deepest trench we can reliably obtain is about 90% (0.45 mm) of the silicon substrate. Based on the simulation result, this geometric constraint will deteriorate the thermal isolation result quite drastically (temperature at point B increases from about 20 ◦ C to 60 ◦ C). High resolution dicing systems can obviously greatly increase the performance of this technique. Simulations revealed that combining the thermal conduit technique with the back dicing technique will provide almost as good isolation results as the back etching technique. The back-diced trench reduces the lateral thermal conduction, while the thermal conduit effectively removes the excess thermal energy from the desired low-temperature region. The combined effect will reduce the temperature at the desired low-temperature region and, therefore, provide a higher temperature gradient. Figure 11 shows the simulation results of a device with a 9 mm wide copper conduit and trenches of varying width. For comparison, the simulation result of the control case (without copper conduit) is also shown in the plot. The data show that by properly choosing the width of the trench and the thermal conduit, thermal isolation results that are comparable to that of the back etching technique can be achieved (20 ◦ C at point B for this technique, compared to 21 ◦ C for the back etching technique). Improved thermal isolation results can also be achieved by replacing a wide trench with multiple narrow trenches. In figure 12 (solid line), multiple narrow trenches (0.5 mm wide and 0.5 mm apart) are added from the left to the right, extending
Cost-effective thermal isolation techniques on microfabricated devices combination of selective conduction and insulation temperature at point B (oC)
100 90 without copper conduit
80 70 60 50
with copper conduit
40
B
30 20 10 0 0
1
2
3
4 5 6 7 8 width of the trench (mm)
9
10
11
Figure 11. Combination effects of selective conduction and insulation. The trench is 0.45 mm deep. The inset shows the combination of a thermal conduit and a back-diced trench.
temperature at point B (°C)
multiple trenches 100 90 80 70 60 50 40 30 20 10 0
B
B
certain locations to selectively remove heat from the lowtemperature desired regions on the device. The back dicing technique uses mechanically cut trenches on the backside of the silicon substrate to insulate the high-temperature regions from the low-temperature regions. The back etching technique essentially uses the same mechanism as the back dicing technique, except that it uses a dielectric diaphragm as the insulation structure. Thermal isolation to some degree is demonstrated by all proposed techniques. Both simulation and experimental results show that the silicon back etching technique can provide excellent thermal isolation on microfabricated devices. The thermal conduit and silicon back dicing techniques are shown to be inexpensive alternatives to the back etching technique, and the combination of these two techniques can provide comparative thermal isolation result as the back etching technique. The performance of these techniques can be improved by adjusting geometric parameters. These techniques, upon further optimization, can be widely applied in integrated biochemical analysis microsystems.
Acknowledgments
0
1
2
3
4
5
6
7
8
9
10
11
number of trenches
Figure 12. Temperature at point B as a function of the number of trenches. Left inset: the trenched area is confined between the heater and point B. The total width of the trenches is 4.5 mm regardless of the number of the trenches. Right inset: the trenched area is extended toward the right edge of the device. Each trench and the silicon fins in between are 0.5 mm wide.
the trenched area from the heater to the right edge of the device. We found the best thermal isolation result is achieved when the trenched area is between the heater and point B (5 trenches in our case). But even when the trenches pass beyond point B, the temperature increase at point B is much lower than the similar case of an open trench (figure 11, solid line). We also found that when the total trenched width is fixed, narrower trenches can slightly improve the results. As shown in figure 12 (dashed line), where multiple trenches are placed between the heater and point B with a fixed total width of 4.5 mm, the temperature at point B gradually decreases as the number of trenches increases (hence the width of each trench decreases). The other advantage of using multiple narrow trenches over a wide trench is that the fins between the trenches can improve the device’s mechanical strength.
4. Summary and conclusion We have investigated three thermal isolation techniques on a microfabricated device. The techniques are based on constructing different thermal isolation structures to regulate the heat transfer across the device. Two mechanisms, selective conduction and selective insulation, have been used by these techniques. The thermal conduit technique uses high thermal conductivity material to replace the PCB at
This work was supported by the National Human Genome Research Institute (Grant P01 HG01984) and the National Institute of Allergy and Infectious Diseases (Grant R01 AI49541) of the National Institutes of Health (NIH). We are grateful to Victor Ugaz, Madhavi Krishnan, Brian Johnson, Dylan Heldsinger, Onnop Srivannavit and Zhishan Hua for their help.
References [1] Burns M A et al 1998 Science 282 484 [2] Hong J W, Studer V, Hang G, Anderson W F and Quake S R 2004 Nat. Biotechnol. 22 435 [3] Liu J, Hansen C and Quake S R 2003 Anal. Chem. 75 4718 [4] Waters L C, Jacobson S C, Kroutchinina N, Khandurina J, Foote R S and Ramsey J M 1998 Anal. Chem. 70 5172 [5] Liu R H, Yang J, Lenigk R, Bonanno J and Grodzinski P 2004 Anal. Chem. 76 1824 [6] Koh C G, Tan W, Zhao M, Ricco A J and Fan Z H 2003 Anal. Chem. 75 4591 [7] Lagally E T, Emrich C A and Mathies R A 2001 Lab Chip 1 102 [8] Liu Y, Rauch C B, Stevens R L, Lenigk R, Yang J, Rhine D B and Grodzinski P 2002 Anal. Chem. 74 3063 [9] Anderson R C, Su X, Bogdan G J and Fenton J 2000 Nucleic Acids Res. 28 e60 [10] Kajiyama T, Miyahara Y, Kricka L J, Wilding P, Graves D J, Surrey S and Fortina P 2003 Genome Res. 13 467 [11] Hung S T, Wong S C and Fang W 2000 Sensors Actuators A 84 70 [12] Socher E, Bochobza-Degani O and Nemirovsky Y 2001 J. Micromech. Microeng. 11 574 [13] Ji-song H, Kadowaki T, Sato K and Shikida M 2002 Sensors Actuators A 100 114 [14] Mo Y, Okawa Y, Inoue K and Natukawa K 2002 Sensors Actuators A 100 94 [15] Lee K H, Lee H K, Byun H J, Cho I J, Bu J U and Yoon E 2001 Sensors Actuators A 89 49 [16] Xie B, Mecklenburg M, Danielsson B, Ohman O and Winquist F 1994 Anal. Chim. Acta. 299 165 [17] Chou C F, Changrani R, Roberts P, Sadler D, Burdon J, Zenhausern F, Lin S, Mulholland A, Swami N and Terbrueggen R 2002 Microelectron. Eng. 61 921
229
M Yang et al
[18] Lysenko V, Perichon S, Remaki B and Barbier D 2002 Sensors Actuators A 99 13 [19] Kaltsas G and Nassiopoulou A G 1999 Sensors Actuators A 76 133 [20] Splinter A, Sturmann J, Bartels O and Benecke W 2002 Sensors Actuators B 83 169 [21] Yoon D S, Lee Y-S, Lee Y, Cho H J, Sung S W, Oh K W, Cha J and Lim G 2002 J. Micromech. Microeng. 12 813 [22] El-Ali J, Perch-Nielsen I R, Poulsen C R, Bang D D, Telleman P and Wolff A 2004 Sensors Actuators A 110 3 [23] Bu M, Melvin T, Ensell G, Wilkinson J S and Evans A G R 2003 J. Micromech. Microeng. 13 S125 [24] Lin Y-C, Yang C-C and Huang M-Y 2000 Sensors Actuators B 71 127
230
[25] Hao Q 2004 J. Micromech. Microeng. 14 914 [26] Shin Y S, Cho K, Lim S H, Chung S, Park S-J, Chung C, Han D-C and Chang J K 2003 J. Micromech. Microeng. 13 768 [27] Zhao Z, Cui Z, Cui D and Xia S 2003 Sensors Actuators A 108 162 [28] Poser S, Schulz T, Dillner U, Baier V, Kohler J M, Schimkat D, Mayer G and Siebert A 1997 Sensors Actuators A 62 672 [29] Dean J A 1992 Lange’s Handbook of Chemistry 14th edn (New York: McGraw-Hill) [30] Perry R H, Green D W and Green D 1984 Perry’s Chemical Engineers’ Handbook 6th edn (New York: McGraw-Hill) [31] Emsley J 1989 The Elements 2nd edn (Oxford: Clarendon)