RESNA Annual Conference – June 26 – 30, 2010 – Las Vegas, Nevada
Making Assistive Technology and Rehabilitation Engineering a Sure Bet
Costs and Benefits of Workplace Accommodations: Findings from Company Case Studies Karen L. Milchus, M.S., Center for Assistive Technology and Environmental Access, Georgia Tech. Meera Adya, J.D., Ph.D. and Deepti Samant, M.S., Burton Blatt Institute, Syracuse University ABSTRACT
Six organiza,ons were surveyed as part of a na,onal study to learn how companies support employment of people with disabili,es. Employees with and without disabili,es reported on their accommoda,on requests, accommoda,ons made for people that they supervised or worked with, and the costs / benefits of these changes. The survey found that most accommoda,ons (a mix of technology and policy-‐based solu,ons) cost under $500. Respondents also reported that accommoda,on benefits, such as improving the likelihood that the employee will stay at the company, equal or outweigh accommoda,on costs.
KEYWORDS
job accommoda,on, reasonable accommoda,on, accommoda,on cost, workplace policy
BACKGROUND / RESEARCH QUESTIONS
Workplace accommoda,ons are mandated by the Americans with Disabili,es Act (ADA) as a way to provide equal opportuni,es for employees with disabili,es (1). Workplace accommoda,ons can enable individuals with disabili,es to gain employment and enable employers to retain produc,ve and qualified employees (2). A na,onal survey conducted by the Work RERC found that 75% of the respondents could not perform all of their job du,es without workplace accommoda,ons (3). Similarly, a study of Independent Living Centers in California found that almost two-‐thirds of its respondents benefited from the presence of assis,ve technology in the workplace (4). Employers, however, oWen assume that making accommoda,ons will involve costs that are burdensome for the employer (5). Some studies have tried to quan,fy these costs (6), but Schartz et. al. point out that most have only looked at direct costs associated with the capital outlay for the accommoda,ons (7). More informa,on is needed about ongoing costs, and about benefits associated with making accommoda,ons. The Department of Labor’s Office of Disability and Employment Policy recently funded a research consor,um to inves,gate these issues, and to iden,fy ways in which an organiza,on can facilitate the employment of people with disabili,es. The Burton Bla_ Ins,tute (BBI) at Copyright © 2010 RESNA 1700 N. Moore St., Suite 1540, Arlington, VA 22209-‐1903 Phone: (703) 524-‐6686 -‐ Fax: (703) 524-‐6630 1
RESNA Annual Conference – June 26 – 30, 2010 – Las Vegas, Nevada
Making Assistive Technology and Rehabilitation Engineering a Sure Bet Syracuse University led the consor,um; in collabora,on with Rutgers University’s School of Management and Labor Rela,ons and Heldrich Center for Workforce Development; Cornell University’s Employment and Disability Ins,tute; Georgia Tech’s Work RERC; West Virginia University’s Interna,onal Center for Disability Informa,on (JAN); and Humans Future, Inc. The consor,um was charged with developing and tes,ng a standard methodology for conduc,ng case study research on companies and organiza,ons. While the primary focus of the consor,um’s research was the impact of corporate culture on inclusive employment, addi,onal ques,ons were included on the provision of workplace accommoda,ons. Research ques,ons included: 1) what accommoda,ons are typically requested; 2) why are requests denied; and 3) what are the costs and benefits or accommoda,ons.
METHODOLOGY
The case study methodology that was developed included a survey of employees with and without disabili,es, individual interviews, focus groups, and review of company policies and procedures. Employees with and without disabili,es were asked about their accommoda,on requests, accommoda,ons made for people that they supervised or worked with, and the costs and benefits of these accommoda,ons. Consor,um members tested this methodology with eight companies, ranging in size from 38 to 38,000 employees, and represen,ng office, manufacturing, hospital, and service semngs. Of these, survey data was collected for six companies, and the informa,on in this paper is based on those results. Since the companies were of varying size, making aggrega,on of data difficult, many of our results looked at the median of each company’s responses.
RESULTS Accommodation Requests
Employees were asked if they had ever requested any change or accommoda,on in their job or workplace to be_er meet their personal needs. Of the employees surveyed who had a disability (per standard ques,ons from the Current Popula,on Survey (8)), only about half had made an accommoda,on request (median 44.2%; range 40.4% to 71.4%). Surprisingly, a sizable number of employees who did not indicate having a disability had requested changes in their job (median 28.2%; range 24.0% to 43.7%). On the survey, employees were presented with a list of nineteen types of accommoda,ons and were asked to indicate which ones they had requested. They were then asked if the request was for a health condi,on, disability, or other impairment. The frequency of these disability and health-‐related requests was determined for each company and was ranked. An overall average ranking was then determined. Table 1 shows the frequency of accommoda,on requests, with the accommoda,ons listed in this rank order. The most frequently requested accommoda,ons were a mix of technology-‐based (e.g., modifica,ons to worksta,on, new computer / IT) and policy-‐based (e.g., changes to work Copyright © 2010 RESNA 1700 N. Moore St., Suite 1540, Arlington, VA 22209-‐1903 Phone: (703) 524-‐6686 -‐ Fax: (703) 524-‐6630 2
RESNA Annual Conference – June 26 – 30, 2010 – Las Vegas, Nevada
Making Assistive Technology and Rehabilitation Engineering a Sure Bet schedule, work from home, restructuring job) solu,ons. The least frequent accommoda,on requests included: use of an interpreter, reader, job coach, service animal, or personal assistant (median 0.7%); modifica,on of exam/training approaches or materials (2.9%); alterna,ve formats or more ,me (3.2%); wri_en job instruc,ons (4.1%); and changes in workplace policy (4.6%). Depending on the company, 77% to 95.8% of the employees with a disability or health condi,on reported that all of their accommoda,on requests were granted. Up to an addi,onal 10% Frequency Cost of Reasons for Denial (% respondents making Accomm (median of indiv. company request) . denial %) C1 C2 C3 C4 C5 C6 (Median Too Not Org. Emp. Not
Accommodation of much necess burden burden approp Request medians) $ . Changes in schedule 57.7 44.8 50.0 40 8.8 16.4 $1-500 1.2 2.6 1.3 1.3 0.9 Mod. indiv. $101-50 workstation 37.0 44.8 41.7 39 17.6 4.1 0 1.3 3.7 1.9 3.6 1.7 $501-10 New computer / IT 34.6 31.0 33.3 21 8.8 3.9 00 1.2 1.1 0.1 0.0 0.0 Work from home 44.4 48.3 37.5 33 8.8 0.4 $1-100 1.0 4.0 1.0 2.0 1.0 Modify computer / $101-50 IT 22.2 17.2 20.8 14 2.9 2.4 0 4.2 0.0 0.1 0.0 0.0 New / different $101-50 equip. 7.4 3.4 20.8 13 14.7 4.8 0 2.4 5.1 5.2 0.1 0.0 Move location 11.1 13.8 16.7 4 2.9 6.1 $1-100 2.8 5.8 3.4 4.7 2.7 Physical changes to $101-50 site 3.7 6.9 12.5 14 11.8 4.1 0 10.0 6.6 0.2 0.1 0.0 Position reassignment 18.5 24.1 0.0 11 2.9 5.2 $0 0.0 2.8 2.8 1.7 0.0 Job restructuring 7.4 13.8 29.2 12 0 5.0 $1-100 0.2 6.7 7.4 2.4 0.2 Table 1: Top Accommodation Requests: Frequency, Cost, and Reasons for Denial reported that some, but not all of their requests were provided. Requests were denied for various reasons, but “not necessary” was common (see Table 1). Cost was cited, par,cularly in response to requests for physical changes to the worksite and for modifica,ons to computers / IT. Organiza,onal burden was cited in response to requests for job restructuring, new equipment, and moving to another loca,on. Overall, the most frequent denials were for moving to another loca,on, physical changes to the worksite, and job restructuring.
Costs / Benefits
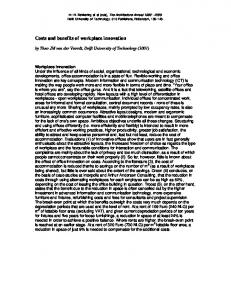
Supervisors indicated the ini,al one-‐,me cost and subsequent annual costs of the accommoda,ons from several price ranges (Table 2). The ini,al accommoda,on costs ranged from $0 to $5000, but most were under $500, suppor,ng previous findings from JAN. Less than 10% of the accommoda,ons cost over $1000. There were also on-‐going costs associated with Copyright © 2010 RESNA 1700 N. Moore St., Suite 1540, Arlington, VA 22209-‐1903 Phone: (703) 524-‐6686 -‐ Fax: (703) 524-‐6630 3
RESNA Annual Conference – June 26 – 30, 2010 – Las Vegas, Nevada
Making Assistive Technology and Rehabilitation Engineering a Sure Bet providing accommoda,ons, some,mes significant. In fact, 2.3% of the accommoda,ons had annual costs of over $5000. However, the vast majority (77.5%) of the accommoda,ons had no annual cost. The survey also inves,gated the benefits resul,ng from accommoda,ons. Employees were presented with a list of ten poten,al benefits and were asked to rate whether each was an actual benefit in their case on a scale of 1 (not at all) to 5 completely. The top benefits (averaging 4 = very much) included (highest to lowest): improved employee’s morale / job sa,sfac,on, made it possible to work here, decreased employee’s stress, made it more likely employee will stay here, and improved produc,vity. Medium benefits (averaging 3 = somewhat) included improvements to workplace safety, ability to acquire training and new skills, and a_endance or hours of work. The lowest benefits (averaging 2 = a li_le bit) were improved interac,ons with coworkers, and enabled promo,on. Respondents es,mated both the costs of accommoda,ons and the monetary value associated with benefits from the accommoda,ons. For each company, the median value for each cost category is plo_ed in Figure 1. The diagonal line indicates the point where accommoda,on costs are equal to value. The figure shows that in general, the respondents reported that accommoda,on benefits equal or outweigh cost.
1 2
Initial one-time costs (% of accommodations) $0 $1- $101- $501- $1001- Over 100 500 1000 5000 $5000 39.1 8.7 21.7 8.7 4.3 4.3 33.3 20.8 20.8 4.2 8.3 0
3
47.8 21.7 4.3
Comp.
4
41
9
18
Not $0 sure 13.0 68.2 12.5 83.3 8.7 80.0
8.7
8.7
0
10
6
2
16 0
65
Annual on-going costs (% of accommodations) $1- $101- $501- $1001- Over Not 100 500 1000 5000 $5000 sure 0 0
4.5 8.3
4.5 0
4.5 0
5
0
0
0
5
10
2
3
3
3
5
19
0
0
0
0
0
0
0
0
0
12.5
1.5
0
0
2.3
5
10.0 50.0 30.0 10.0
0
0
6
61.5 23.1
0
0
0
88.9 11.1 15.4 75.0 12.5
8.7
5.2
0
77.5 3.5
0
Median across companie 40.1 21.3 19.4 s
4.5 13.6 0 8.3
Table 2: Costs of Accommoda,ons as Reported by Employee, for Each Company
DISCUSSION
Employers are oWen hesitant about hiring people with disabili,es because of fears about what types of supports will be needed by the employees. However, only about half of the employees with disabili,es surveyed had made an accommoda,on request. For at least one company, changes already made to the facility to make it accessible may have precluded the need for Copyright © 2010 RESNA 1700 N. Moore St., Suite 1540, Arlington, VA 22209-‐1903 Phone: (703) 524-‐6686 -‐ Fax: (703) 524-‐6630 4
RESNA Annual Conference – June 26 – 30, 2010 – Las Vegas, Nevada
Making Assistive Technology and Rehabilitation Engineering a Sure Bet further accommoda,ons. The survey also showed that people without a disability or health concerns also made requests for changes in their job. These included requests for ergonomic equipment, schedule changes, and permission to telework. Thus, “accommoda,on” should not be viewed as a disability concern, but as a way to support all employees. The most frequently used accommoda,ons were a mix of technology-‐ and policy-‐based solu,ons. Costs ranged from $0 to over $5000, but most accommoda,ons cost under $500, suppor,ng previous findings from JAN (6). In spite of this, 0.9% to 8.2% (median 2.3%) of supervisors s,ll listed “cost of accommoda,ons” as a barrier to employment or advancement for people with disabili,es. Cost was cited occasionally as a reason for denying accommoda,on requests, yet the two categories where this showed up the most, physical changes to the worksite and modifica,ons to computers / IT, both had median costs of Figure 1: Cost vs. Benefits of Accommodations (medians of $500 or less. estimates within each cost range) Presumably, the denied accommoda,ons would have cost much more than was typical. Finally, most respondents reported that accommoda,on benefits outweigh or equal accommoda,on costs. Some of the financial benefits to providing accommoda,ons can be due to improved produc,vity, which was listed as a top benefit. However, the highest rated benefits were related to improved job sa,sfac,on, decreased stress, and making it more likely that the employee will stay at the company. These benefits also have monetary value when you consider that there can be significant costs associated with recrui,ng and training new staff when an employee leaves. Building on this research, the Work RERC is further inves,ga,ng how accommoda,on costs and benefits are calculated and how they change over ,me for an employee with a disability.
REFERENCES
1. Americans with Disabili,es Act, in 42 U.S.C. § 12111 (10)(A). 1999.
Copyright © 2010 RESNA 1700 N. Moore St., Suite 1540, Arlington, VA 22209-‐1903 Phone: (703) 524-‐6686 -‐ Fax: (703) 524-‐6630 5
RESNA Annual Conference – June 26 – 30, 2010 – Las Vegas, Nevada
Making Assistive Technology and Rehabilitation Engineering a Sure Bet 2. Blanck, P.D. (1994). Communica,ng the Americans with Disabili,es Act, Transcending Compliance: A Case Report on Sears, Roebuck and Co. Iowa City: Annenberg Washington Program. 3. Williams, M., Sabata, D., and Zolna, J. (2006). User Needs Evalua,on of Workplace Accommoda,ons. Work, 27(4), 355-‐362. 4. Yeager, P., Kaye, H.S., Reed, M., and Doe, T.M. (2006). Assis,ve Technology and Employment: Experiences of Californians with Disabili,es. Work, 27(4), 333-‐344. 5. Bernard, T.H. (1990). The Americans with Disabili,es Act: Nightmare for Employers and Dream for Lawyers? St. John’s Law Review, 64, 229-‐252. 6. Job Accommoda,on Network (Original 2005, Updated 2009). Workplace accommoda,ons: Low cost, high impact. Retrieved January 18, 2010 from www.jan.wvu.edu/media/ LowCostHighImpact.doc. 7. Schartz, H.A., Hendricks, D.J., and Blanck, P. (2006). Workplace Accommoda,ons: Evidence Based Outcomes. Work, 27(4), 345-‐354. 8. Labor Force Sta,s,cs from the Current Popula,on Survey. Retrieved January 18, 2010 from h_p://www.bls.gov/cps/cpsdisability_faq.htm.
ACKNOWLEDGMENTS
This study was funded under grant #E-‐9-‐4-‐6-‐0117 from the U.S. Dept. of Labor’s Office of Disability Employment Policy. It was conducted in collabora,on with the Work RERC (H133E070026), funded by the U.S. Dept. of Educa,on’s Nat. Ins,tute on Disability and Rehabilita,on Research. Opinions contained in this paper are those of the grantee and do not necessarily reflect those of the U.S. DOL or U.S. DOE.
AUTHOR CONTACT INFORMATION Karen Milchus, MS, ATP CATEA, Georgia Ins,tute of Technology 490 Tenth St. NW, Atlanta, GA 30318 Phone: 404-‐894-‐0393 Email:
[email protected]
Copyright © 2010 RESNA 1700 N. Moore St., Suite 1540, Arlington, VA 22209-‐1903 Phone: (703) 524-‐6686 -‐ Fax: (703) 524-‐6630 6