(Klemperer and others, 1986; Allmendinger and others, 1987: Hauge and ... related problems were pointed out by the original processors (Klemperer et al., ...
CRUSTAL HETEROGENEITY IN THE BASIN AND RANGE A.
LEVANDER,
S.P. LARKIN, L.M. LA FLAME, S. PULLAMMANAPALLIL RICE UNIVERSITY
J.A. GOFF UNIVERSITY OF TEXAS INSTITUTE FOR GEOPHYSICS
CONTRACT NUMBER: F49620-94-0100 SPONSORED BY AFOSR
ABSTRACT : We are investigating the fine-scale structure of the Earth's crust in order to understand its influence on high frequency (0.5-30 Hz) regional wave propagation. We have developed geologically based stochastic models of crustal heterogeneity for a number of different tectonic provinces and crustal levels. Here we have focused on examining geologic maps from extended terranes, and seismic data from the northern and southern Basin and Range. We have developed two different deterministic/stochastic velocity models which produce synthetic seismograms showing many of the reflectivity patterns and crustal events (Pg, PmP, Sg, SmS) observed in Basin and Range near-vertical and wide-angle seismic data. We also have developed several ways to measure the lateral heterogeneity scale length from unstacked seismic data, and have tested them on synthetic data with promising results. Keywords: Fine-scale seismic velocity heterogeneity, stochastic models, Basin and Range.
19960624 162
647
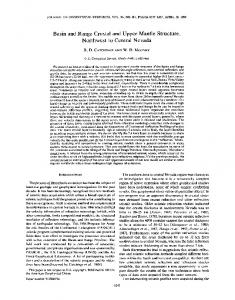
OBJECTIVE : We are investigating the fine-scale seismic velocity heterogeneity of the Earth's crust over a broad range of scales (-0.025 to -35km) in an effort to understand how wavelength scale heterogeneity affects seismic wave propagation in the the crust in the 0.5-30Hz band. We are approaching this problem in three ways. 1) Estimates of crustal velocity heterogeneity can be made from geologic maps and petrophysical data, and from seismic reflection data. Statistical analysis of geologic maps and petrophysical data, from which stochastic models for velocity heterogeneity are constructed. The stochastic models of different types of lithologies are then used to develop whole crustal models for which synthetic seismograms can be calculated. To improve the direct image of crustal velocity heterogeneity in the crustal column we are reprocessing COCORP reflection data from the Basin and Range. 2) Synthetic seismograms calculated for the stochastic models are compared to crustal reflection and refraction seismograms. 3) We are evaluating methods for estimating lateral heterogeneity scale lengths using several correlation measures on unstacked synthetic seismic data. RESEARCH ACCOMPLISHED : Reprocessing the COCORP40°N Transect - Nevada Line 2. Vertical incidence seismic data from the northern Basin and Range Province are often characterized by a transparent upper crust, a highly reflective midcrust, a slightly less reflective lower crust, and a strong reflection Moho up to a second in length. The COCORP 40ON transect - Nevada line 2 is part of a vibrator seismic survey that extends across the western Cordillera of the United States. Line 2, situated in the Basin and Range Province, has been processed and interpreted previously (Klemperer and others, 1986; Allmendinger and others, 1987: Hauge and others, 1987). A joint vertical-incidence to wide-angle reflection/refraction explosion experiment (known as the PASSCAL Basin and Range Experiment) was conducted over the same area in 1986. Interpretations of these two datasets have produced somewhat contradictory models of the crust in the Basin and Range. One COCORP CMP section is a single fold near-trace CMP section, which shows a pair of bright reflectors at the base of the crust, whereas the stacked CMP stacked section shows a broad zone of reflectors from 9.5 - 10.5 s two-way-time (TWT), as opposed to two distinct bands of reflectivity. Neither section shows bright or continuous middle crustal reflectivity across the section, whereas a limited (-20km) dataset of densely recorded near vertical incidence explosion data shows pronounced reflectivity in the middle crust (at 4-7 s twt). The disparity between the stacked and single-fold vibrator and explosion images of the middle to lower crustal reflectors may be caused by inadequate seismic processing of the COCORP data. Surface related problems were pointed out by the original processors (Klemperer et al., 1986). It is our intention to use current processing capabilities to remove the near-surface effects and produce a better stacked image. Getting reliable consistent images of the middle crust, the Moho transition zone is crucial to estimating the parameters needed for stochastic models. We will then have a reflectivity/velocity model for the crust and mantle in an extended terrane which can be used to generate synthetic seismograms. To reprocess COCORP Nevada Line 2 we followed the processing flow for Nevada line 2 outlined in Allmendinger and others, 1987, to reproduce the original COCORP image and give us a foundation on which to make improvements. Additional trace editing and careful muting removed some of the ground roll and extraneous noise later in the section. Velocity analysis was done interactively with a starting velocity model taken from the 1986 PASSCAL wide-angle survey of the same region (Holbrook, 1990). The stack produced after the velocity analysis showed incremental improvements. We further improved the section by calculating and applying refraction statics, which strip away some of the effects of the irregular topography and surface layers in the basins and ranges. The CMP stack following refraction statics and several iterations of velocity analysis show continuous Moho and middle crustal reflectors across the section. Additional processing will include residual statics and time and in depth migration. The reprocessed image (Figure 1) appears much more consistent with the patterns seen in the limited explosion data, and thus suggests that we may be able to process the entire COCORP Basin and Range dataset to estimate crustal fabric across a regional scale. 648
Construction of stochasticmodel for the northern Basin and Range. Figure 2 displays our velocity model for the northern Basin and Range. The transparent upper crust is modeled as felsic intrusions into a gneissic basement terrane. The horizontal and vertical characteristic scales for the upper crustal zone are 963 m and 817 m respectively, with a fractal dimension of 2.5, and a binary probability density function (pdf) of 67% fast (avg 6.0 krn/s) and 33% slow (avg 5.7 km/s). These statistics were obtained from outcrop maps within the Chocolate Mountains of southeastern California. (Although not within the northern Basin and Range Province, maps of this area show the effects of upper crustal Mesozoic plutonism). Seismic velocities are taken from laboratory measurements of rocks with similar compositions and are consistent with the bulk velocities determined from upper crustal refractions. High heat flow and historical volcanism throughout the Basin and Range indicate that mafic intrusions are likely to exist at several levels in the crustal column. These intrusions provide the impedance contrasts required to produce high amplitude reflections. Rheological arguments suggest that these intrusions should have different orientations depending on their depth of emplacement, with horizontal intrusions prefering weak rheological boundaries, such as at the brittle/ductile transition and at the crust/mantle boundary (Parsons et al., 1992; Holliger and Levander, 1994). For these reasons we have developed a stochastic model of velocity heterogeneity consisting of either horizontally or vertically elongated high velocity bodies within a more felsic matrix. The zones having elongated horizontal bodies within the midcrust and at the Moho produce the observed high amplitude reflectivity. The mid and lower crust consists of dikes and sills with characteristic scales of 200 m and 800 m depending on orientation, a fractal dimension of 2.7, and a binary pdf of 5% fast (avg 6.8 km/s) and 95 % slow (avg 6.5 km/s). The fractal dimension is consistent with that measured from outcrop maps of the Ivrea Zone in northern Italy, an area believed to expose extended and intruded lower crust similar to that in the Basin and Range. Though we presently have no seismic constraints on the percentage of intrusion in the pdf, we have chosen a small extreme to emphasize the importance of orientation in producing reflectivity. Average crustal velocities and gradients were obtained by averaging the velocity models shown in Figure 3. Constructionof stochastic model for the southern Basin and Range in southeastern California. In contrast to the highly reflective crust prevalent in the northern Basin and Range, southeastern California north of the Chocolate Mountains exhibits a comparatively nonreflective seismic signature. We have therefore modeled this area without mafic intrusions, and instead have used the statistics derived from maps of Mesozoic plutons intruded into Proterozoic North American crust in the Chocolate Mountains (Figure 2, upper crust) as describing the entire crustal column. Average crustal velocities and gradients were obtained from the analysis of the PACE 92 refraction profile of this same area (Parsons and McCarthy, submitted to Journal of Tectonics). Modeling PASSCAL 86 northern Basin and Range data and RISC 92 southern Basin and Range data. The two velocity models described above were used to generate 2-D visco-elastic finitedifference synthetic seismic sections. For the vertical incidence simulations, the models were 20 by 36km with 20 m grid spacing. The source pulse was a Ricker wavelet with an 18 Hz center frequency. For the wide-angle simulations, the models were 210 by 36 km with 60 m grid spacing. The source was a Ricker wavelet with a 5 Hz center frequency. The near-surface was modeled as a series of 2-D layered sedimentary basins. Average velocity within the near surface layer was 3.1 km/s with a gradient of 0.8 km/s/km and a Q of 50. Velocities were determined from travel time analysis; Q was determined from spectral ratios of the near-offset first arrival. Sedimentary layers were modeled as fractal tabular bodies with horizontal and vertical characteristic scales of 6000 m and 60 m, respectively, a fractal dimension of 2.5 (the smoothest possible binary fractal fabric), and a binary pdf of 50-50% high and low velocities with velocity contrasts of 0.4 km/s. The results from the PASSCAL 86 northern Basin and Range simulations are shown in Figure 4. Figure 4a shows a shot record (Shotpoint 4B) from the 1986 PASSCAL seismic experiment, and Figure 4b shows our vertical incidence synthetic. Both show a reflective midcrust 649
and a 1 second thick Moho. No bulk changes in velocity occur at the onset of the reflective midcrust. The results from the RISC 92 southern Basin and Range simulations are shown in Figures 5. The seismic section displayed in Figure 5a is a composite gather of a number of shots into a stationary recording spread near the Chocolate Mountains of southeastern California. The reverberatory nature of wide-angle PmP is reproduced remarkably well in the synthetics (Figure 5b) by a combination of crustal scattering and basin reverberation. Coda amplitude analysis has shown that the initial coda is dominated by near surface reverberation, but the later coda is due to body wave scattering and phase conversions. Crustal heterogeneity is also necessary to produce the strong SmS arrival observed in the data. Statisticalmeasures of crustal heterogeneity : The Basin and Range data show that describing highly reflective zones within the crust as stochastic media can produce synthetic seismograms having many of the features seen in seismic reflection and refraction data. These crustal models are now based on the statistics derived from digitized maps of middle and lower crustal exposures. Synthetic seismograms generated through these models show that their fine-scaled features affect the propagation of seismic signals at and above 0.5 Hz frequency (Holliger and Levander, 1992; Holliger et al., 1993; Levander et al., 1993). Our objective is to relate the statistics of the scattered wavefield, observed in the synthetic seismograms, to the statistics of the underlying medium. In the process, we explore the parameter space that determines the statistics of the medium. This includes modality, fractal dimension, velocity fluctuation, fabric anisotropy, and structure of the velocity pdf. The current work focuses on relating the statistics of the wavefield to the anisotropy of the stochastic medium, i.e. the ratio of the horizontal to vertical characteristic scale, ax/az. The stochastic models we use differ in their horizontal characteristic scales, and as a reference, the measurements are also done on a layered deterministic medium. The measurements are performed in the time-domain and take into account time-shifts in the traces caused by the small scale velocity fluctuations. Under the single scattering assumption, the lateral correlation function of the wavefield depends only on the corresponding lateral correlation function of the scattering medium. The stochastic model through which we generate the synthetic seismograms for our study is shown in Figure 6a. It is 40 km long and 10 km deep, with a grid spacing of 20 in. The scatterers are located in a 5 km thick "target" zone, extending from a depth of 5 km to 10 km. The characteristic scale ratio (ax/az, with ax horizontal and az vertical characteristic scale) of the scatterers within the target zone is varied by changing ax to observe the effect of heterogeneity anisotropy on the lateral coherence measure. A visco-elastic finite difference scheme was employed to generate synthetic seismograms. Our results show that changes in the correlation of the wavefield does correspond to changes in the lateral characteristics of the media, though the differences are not linear (Figure 6b). When the ax/az ratio of the velocity models change from 10 to 5 (a factor of 2), the correlation lag, corresponding to a correlation coefficient of 0.5, changes by a factor of 1.70. When the ratio (ax/ay) changes from 5 to 1, the correlation lag drops by a factor of approximately 2.20. This statistical measure was computed both in the shot-gather and common-offset domain and over time windows of 500, 1000, and 1500 milliseconds. The advantage of the latter domain are that normal-moveout (NMO) stretch can be avoided. Both analysis modes yield similar results over the different time windows, indicating the robustness of the measure. Another measure we perform to discern the horizontal characteristic scale of the medium involved a wavenumber-time analysis. If the wavefield is influenced by the lateral characteristics of the medium, then a lateral wavenumber spectra should exhibit its effect. Comparison of the power spectra of the wavefield, after NMO correction, for our test models show that the corner wavenumber does vary in proportion to the horizontal characteristic scale of the medium (Figure 6c). The spectra of the traces from the media with ax/ay ratio of 10 has a comer wavenumber of 0.224 (1/kin), while it is 0.430 for the ax/ay=5 model and 1.510 for the ax/az=l model. 650
Ultimately we will apply these measures to the reprocessed COCORP and the PASSCAL datasets for the Basin and Range to estimate the lateral characteristic scales directly from the seismic data. CONCLUSIONS AND RECOMMENDATIONS: The seismic modeling results show that a considerable fraction of the seismic wavefield observed in conventional seismic refraction profiles can be reporduced by scattering from wavelength scale seismic velocity heterogeneity. Moho reflections are modulated both by fine-scale fluctuations on the transmission path and by reverberation in the highly heterogeneous near-surface layers. The most pressing problem to address is the estimation of crustal heterogeneity from seismic data directly. We have developed two measures for estimating the lateral characteristic scale length from refraction and unstacked reflection data. Estimation of seismic velocity fabric from seismic data directly will permit utilization of the vast global seismic reflection/refraction database to quantitatively classify the Earth's crust according to heterogeneity type and fluctuation. The next issue to be resolved is the influence of complex overburden on the wave field reflected from deeper layers. Lastly we plan to model regional propagation (to -2000 km) in realistic stochastic models of the crust, using the Basin and Range models as a starting point. REFERENCES: Allmendinger, R.W.,Hauge, T.A.,Hauser, E.C.,Potter, C.J.,Klemperer, S.L.,Nelson, K.D., Knuepfer, P., and Oliver, J., Overview of the COCORP 40°N Transect, western U.S.A.: The Fabric of an Orogenic Belt. Geol. Soc. Am. Bulletin, v.98, 308-319, 1987. Hauge, T.A., Allmendinger, R.W., Caruso, C., Hauser, E.C., Klemperer, S.L., Opdyke, S., Potter, C.J., Sanford, W., Brown, L., Kaufman, S., Oliver, J., Crustal Structure of Western Nevada from COCORP Deep Seismic Reflection Data. Geol. Soc. Am. Bulletin, v.98, 320-329, 1987. Holbrook, W.S., The Crustal Structure of the Northwestern Basin and Range Province, Nevada, from Wide-Angle Seismic Data. J. Geophysical Research, v.95, 21,843 - 21,869, 1991. Holliger, K., and A. R. Levander, A stochastic view of the lower crust based on the Ivrea Zone, Geophys. Res. Lett., 19, 1153-1156, 1992. Holliger, K., A. Levander, and J. A. Goff, Stochastic modeling of the reflective lowercrust: petrophysical and geological evidence from the Ivrea Zone (northern Italy), J. Geophys. Res., 98, 11967-11980, 1993. Holliger, K., and A. Levander, Lower crustal reflectivity modeled by rheological controls on mafic intrusions, Geology, 22, 367-370, 1994. Klemperer, S.L., Hauge, T.A., Hauser, E.C., Oliver, J.E., and Potter, C.J., The Moho in the Northern Basin and Range Province, Nevada, along the COCORP 40°N Seismic Reflection Transect. Geol. Soc. Am. Bulletin, v. 97, 603-618, 1986. Levander, A., R. W. Hobbs, S. K. Smith, R. W. England, D. B. Snyder, and K. Holliger, The crust as a heterogeneous "optical" medium, or "crocodiles in the mist",Tectonophysics, 232, 281-287, 1993. Parsons, T., Sleep, N.H., and Thompson, G.A., The role of magma overpressure in suppressing earthquakes and topography: Implications for understanding extending crust, Tectonics, 11, 1348-1356, 1992.
651
S.P. 4
CDP
4
661
761
861
461
561
0 11 lot*
.1,
-1
.
4
It -1-
.'
'
AJA
1i 4'
.
1,
4-. .0
~*I
*,
Nr 4
W
Ow4rt
10
10
KM
Figure 1 Reprocessed COCORP Nevada Line 2, showing midcmustal (4-7 s twt) and Moho reflectivity (9-10s twt). The upper two seconds of the data are muted. Compare to the explosion shot record from Shotpoint 4B (Figure 4a). Reflectivity patterns are similar.
652
10 km
PASSCAL
Basin & Range 86 Refraction Velocty
Basin 2.6-3.6 km/s0 510 E 202-
j
~-
oD 25
-____C__ressna 70
ir23s-
-
rgatch
Bez7 Holbrook 4 Zelt 4
Velocity
30 Pngs4
Northernona VeloityNevadat ode
630
Figure 2
Figure 2: Stochastic model for northern Basin and Range. There arc no step changcs in velocity within the ernst above the Moho. Figure 3: 1-1) P-wave velocity models dcrivcd from PASSCAL Basin and Range wide-aperture data by a variety of researchers,. Note that the mean crustal velocity, the crustal thickness, and the velocity gradients are similar in all models, hot the velocity steps within the crust are different. We model the erust with a Il-D deterministic velocity
653
(i/e
(a) NEVADA PASSCAL
W
-
SP4B E 6 km
8km
5s
5s i
relflectivity
Midcrustal
Reflection
Moho
Offset (kin)
6
5S
5s
Hihy rfetve
.
10
SeConld
_____________
thick
.__ -__..
zone
from
from
Nloho
5%
•%
horizontal
horizontal
intrusion
-E. ... "
IntlfUStOn-
- ....
lOs
(b) Figure 4 a) Seismic shot record 4B from the PASSCAL Basin and Range experiment, recorded at 50m spacing. Note the bright reflectivity from 4-7 s twt, and at the Moho 9-10 s twt. b) Synthetic shot record for shot 4B from the velocity model in Figure 2. Note correspondence between reflective zones in the field record. 654
(a) 10Offset
100
kin)
2~
-2
0
0
2
2~P -
--
-
-
2-
- ----
PniP
,4
6
4
s:75~ IQ)
a10
-
~
-~--10
14
--
16
--
-
-..
0
8
~
16
0
.
12
12
181
(b)
Figurie 5 a) Composite large offset shot record from southern Basin and Range RISC experiment. Note prominent crustal events. b) Synthetic shot record from a stochastic model consisting of flat sedimentary basins overlying a crust intruded by felsic rocks, similar to that at the top of the Fi(-,urc 2. A uniform vertical velocity gradient has been used in the crust below the sedi'ments. 655
0
So E
0
_
(A
0)
0
&
C-)
cc
o
o 6
1
6
-
6
6
0
-
0i6
0)
10
7-1 _C
''5
0) U
t'
(A
U
km
ax=00m ay=200
InW6
10km
t
t,
Aý (ax=20m; a=200 656)