Dimpfel et al. BMC Psychiatry 2011, 11:123 http://www.biomedcentral.com/1471-244X/11/123
RESEARCH ARTICLE
Open Access
Early effect of NEURAPAS® balance on current source density (CSD) of human EEG Wilfried Dimpfel1*, Klaus Koch2 and Gabriele Weiss3
Abstract: Psychiatric patients often suffer from stress, anxiety and depression. Various plant extracts are known to fight stress (valerian), anxiety (passion flower) or depression (St. John’s wort). NEURAPAS® balance is a mixture of these three extracts and has been designed to cover this complex of psychiatric conditions. The study was initiated to quantitatively assess the effect of this combination on brain electric activity. Method: Quantitative electroencephalogram (EEG) current source density (CSD) recording from 16 healthy male and female human volunteers (average age 49 years) was used in a randomized, placebo-controlled cross over study. Recordings were performed 0. 5, 1. 5, 3 and 4 hours after administration of the preparations under the conditions of 6 min eyes open and 5 min d2 concentration test, mathematical calculation test and memory test, respectively. All variables (electric power within 6 frequency ranges at 17 electrode positions) were fed into a linear discriminant analysis (eyes open condition). In the presence of mental load these variables were used to construct brain maps of frequency changes. Results: Under the condition of mental load, centro-parietal spectral power remained statistically significantly lower within alpha1, alpha2 and beta1 frequencies in the presence of verum in comparison to placebo. Discriminant analysis revealed a difference to placebo 3 and 4 hours after intake of 6 tablets of NEURAPAS® balance. Data location within the polydimensional space was projected into the area of the effects of sedative and antidepressive reference drugs tested earlier under identical conditions. Results appeared closer to the effects of fluoxetine than to St. John’s wort. Conclusions: Analysis of the neurophysiological changes following the intake of NEURAPAS® balance revealed a similarity of frequency changes to those of calming and anti-depressive drugs on the EEG without impairment of cognition. Trial registration: ClinicalTrials.gov: NCT01047605
Background People today face quite a number of psychic challenges. Working life produces numerous stress situations, which sometimes are difficult to cope with. Permanent pressure of this kind in many cases leads to adaptive mechanisms of the brain and successful coping. But there are also numerous cases where these protective mechanisms do not work or show exhaustion with time. Very often anxiety and depression are the result of such continuous environmental exposures. Under theses circumstances patients need help. Broad use of synthetic drugs like benzodiazepines or serotonin reuptake * Correspondence:
[email protected] 1 Justus-Liebig-University c/o NeuroCode AG, Sportparkstr. 9, 35578 Wetzlar, Germany Full list of author information is available at the end of the article
inhibitors is for example accompanied by serious side effects like cognitive impairment in the case of benzodiazepines [1] or heart and circulation problems in the case of reuptake inhibitors [2]. An alternative solution can be provided by administration of natural remedies. For centuries the calming effect of passion flower and valerian root extract have been recognized and were partially confirmed in recent clinical studies. For example preoperative oral Passiflora incarnate reduces anxiety in ambulatory surgery patients [3] and there is tentative evidence that extract of Valeriana wallichii attenuated stress and anxiety [4]. Efficacy and tolerability of Hypericum extract (St. John’s wort) for the treatment of mild to moderate depression has been documented [5]. This knowledge has resulted in numerous formulations of dietary supplements and herbal extracts for relaxation
© 2011 Dimpfel et al; licensee BioMed Central Ltd. This is an Open Access article distributed under the terms of the Creative Commons Attribution License (http://creativecommons.org/licenses/by/2.0), which permits unrestricted use, distribution, and reproduction in any medium, provided the original work is properly cited.
Dimpfel et al. BMC Psychiatry 2011, 11:123 http://www.biomedcentral.com/1471-244X/11/123
and anxiolytic action (for review s. [6]. Nearly, all clinical studies dealing with the treatment of depression by St. John’s wort have provided solid evidence for its efficacy during treatment. But with respect to anxiety there is a lack of rigorous studies in this area [7]. In order to cover a broader range of possible psychiatric distortions a film-coated tablet with a mixture of extracts of valerian root, passion flower herb and St. John’s wort herb has been developed for pharmacological treatment of these conditions under the name of NEURAPAS® balance. This combination of extracts has been characterized pharmacologically in vitro and in vivo [8]. It was shown for the first time that Passiflora significantly enhances the potency of Hypericum (St. John’s wort) in two preclinical models: serotonin reuptake and forced swimming test. With the availability of new encephalographic techniques like continuous online current source density measurements (CATEEM®) the quantitative description of brain function has entered a stage where the measurement of even very subtle changes of physiological brain activity has become feasible [9]. The aim of the present clinical study was to substantiate the effectiveness of this preparation by current source density (CSD) analysis of brain activity in the presence of various mental challenges. This technology-as a special form of quantitative pharmaco-EEG-has been used widely in the past for the characterization of drug effects.
Methods Subjects
Sixteen healthy volunteers (8 males, 48,7 ± 7 years old and 8 females, 47 ± 8 years old) were recruited by advertisement and participated in this study. They underwent a medical examination before entering the trial. Subjects reporting neurological disturbances of the central nervous system (using DSM-III criteria) were excluded from the study. Subjects with a history of drug or ethanol abuse or participation in another study within the last six months were also excluded. It was ensured that they were not on alcohol. On the day of examination no beverages containing caffeine were allowed within the last 12 hours preceding the EEG recording. The study was carried out according to the declaration of Helsinki [10] on human rights and was approved by the local ethics committee of the State Medical Association Hessen (Frankfurt, Germany) and government authorities (BfArM, Bonn, Germany). All subjects were informed about the goals of the study in detail and gave their written informed consent to participate. Each subject was randomly allocated to either the functionally active preparation or placebo within a crossover design.
Page 2 of 15
EEG Recording
Subjects sat alone in a quiet separate room in a comfortable easy chair. The light was dimmed. Baseline recording of 6 min under the condition of eyes open was followed by performance of three cognitive tests: a concentration test (d2-test) [11], a mathematical calculation test (according to [12]) and a memory test consisting in the presentation of a row of letters and numbers, which appeared for 4 s on a screen followed by 10 s black screen. After this a multiple choice of four possible answers was presented. All recordings were repeated 0. 5 h, 1. 5 h, 3 and 4 h after the administration of the tablets (overview in Figure 1). Between the measurement sessions the subjects spent their time in the facility’s break room. All experiments took place at the same time of the day (starting at 8 h a. m.). The EEG was recorded bipolarly from 17 surface electrodes according to the international 10/20 system with Cz as physical reference electrode for calculation of the common average reference (Computer aided topographical electroencephalometry: CATEEM® - from Mewicon GmbH, 4164 Schwarzenberg, Austria) using an electrocap [13]. The raw signals were amplified, digitalized (2048 Hz/12 bit) and transmitted via fiber optical devices to the computer. The automatic artefact rejection of the CATEEM®-System, which eradicates EEGalterations caused by eye blinks, swallows, respiration etc. during the recording was visually controlled and individually adjusted by the investigator. Electrocardiogram (ECG) and electrooculogram (EOG) were recorded in one channel each in order to facilitate detection of those signals superposed on to the EEG. The artefact rejection set-up was observed for about 5 minutes prior to the start of the recording to ensure, that all artefacts were correctly recognized and eliminated from further evaluation. For safety purposes the original raw data were saved on optical disk in order to allow re-evaluation of the artefact rejection mode if necessary. In these cases the experimental session was re-examined off-line
Figure 1 Time line of EEG recording. Time line of EEG recording before and after administration of the preparations.
Dimpfel et al. BMC Psychiatry 2011, 11:123 http://www.biomedcentral.com/1471-244X/11/123
with a newly adapted rejection mode. The amount of rejected data was determined automatically and given in percent of total recording time. Nevertheless the entire recording and the computer-based automatic artefact rejection were continuously supervised and adjusted by a trained technician [14]. Logarithm of CSD data was taken for discriminant analysis in order to approach normal distribution of values, which underwent frequency analysis for quantitative evaluation as proposed for the first time nearly 80 years ago [15]. In this study the EEG was computed not in the potential mode measured as voltage, but in a surface charge mode obtained by Laplacian estimates also known as current source density (CSD) analysis [16]. The charge is the 2nd derivative of the potential and gives the spatial curvature of the potential. All calculations are based on the standard set-up of the 10/20 system of recording. Under the condition of using a homogenous, steadily conducting medium the surface charge mode provides the source density of the electrical flow on the cortex surface. Whereas the EEG in the potential mode tends to produce a more extensive and diffuse picture of changes, the Laplacian estimate acts as a spatial filter emphasizing local sources over distant sources. Others [16] were able to demonstrate, that spectral parameters obtained from the CSD showed higher correlations with computer tomography measures than those calculated from the potential mode of the EEG. We therefore used this methodology in order to describe the focal changes of brain activity. Using a Lagrange interpolation, signals from 82 additional virtual electrodes were calculated to provide high-resolution topographical maps. The signals of all 99 electrode positions (17 real and 82 virtual) underwent the Fast Fourier Transformation (FFT) based on 4-second sweeps of data epochs (Hanning window). Data were analysed from 0. 86 to 35 Hz using the CATEEM® software. In this software the resulting frequency spectra are divided into six frequency bands: delta (1. 25-4. 50 Hz), theta (4. 75-6. 75 Hz), alpha1 (7. 00-9. 50 Hz), alpha2 (9. 75-12. 50 Hz), beta1 (12. 75-18. 50 Hz) and beta2 (18. 75-35. 00 Hz). This frequency analysis is based on absolute spectral power values. Colour coding of the maps is achieved by transforming the content of the power spectrum into the so-called colour vision mode pictures (i. e. frequencies are converted into spectral colours with a resolution of 0. 25 Hz, which gives 140 colours which are then mixed according to spectral content to give one map similar to the RGB mode of TV pictures). Data acquisition and analysis were carried out simultaneously and provide topographical maps displayed on-line on the computer screen. The maps show the relative, time-averaged, functional changes of electric brain activity of each specific recording condition in comparison to the reference period at
Page 3 of 15
the beginning of each recording session during the relaxed state with open eyes. Band powers are firstly compared between placebo and verum during relaxation, then the effects of different mental loads are determined in the absence of either placebo or verum, and finally the results of verum and placebo are compared under different mental loads. Statistics
EEG data from the first recording session before drug intake are given as absolute numbers (μV2). By setting the absolute electric power of this first pre-drug recording to 100%, changes produced by the preparations are given as percentage from this pre-drug condition. Except for the construction of brain maps only those particular electrode positions were used for the numeric comparison of verum to placebo during mental load, which have been found to change during the particular mental challenge. For explorative statistical evaluation the nonparametric sign test was used. For mathematical classification of drug effects the linear discriminant analysis according to Fischer was used. Results from the first three discriminant functions were projected into space (x, y and z coordinates), whereas results from the fourth to sixth discriminant functions were coded into red, green and blue, respectively, followed by an additive colour mixture (so-called RGB-mode). Reference preparations used for comparison have been tested in our lab earlier under identical conditions. These data were processed by linear discriminant analysis. Thereafter we used the same transformation by using this projection without any further discriminant analysis procedure for depiction of Neurapas® balance. Psychometric performance was evaluated by the mathematical product of “quantity × quality”, where quantity was defined as the number of correct answers and quality as the number of correct answers divided by the number of tasks tackled. Preparation
NEURAPAS® balance is a film-coated tablet containing a combination of special dried extracts: 60 mg “St John’s wort Herb” (4. 6-6. 5:1), extractant: ethanol 38% (m/m), 28 mg “Valerian root” (3. 8-5. 6:1), extractant: ethanol 40% (m/m), and 32 mg “passion flower herb” (6. 25-7. 1:1), extractant: ethanol 60% (m/m). NEURAPAS® balance is registered in different European countries for the treatment of mild depression, low mood, anxiety, and sleep disorders and marketed by Pascoe Pharmazeutische Präparate GmbH, Giessen, Germany. The verum preparation consisted of the maximum daily dosage of 6 tablets of NEURAPAS ® balance. At least one week passed between administrations within the crossover design.
Dimpfel et al. BMC Psychiatry 2011, 11:123 http://www.biomedcentral.com/1471-244X/11/123
Page 4 of 15
Results Analysis of Single Frequency Ranges during Relaxation
Source density analysis of the primary recording of the reference EEG before drug administration revealed similar absolute power values for the first day of placebo administration (Pl) in comparison to the first day of active drug administration (Neu) for all electrode positions as documented in Table 1. Following drug administration no changes were documented between placebo and verum within the first 1. 5 hours (not shown). Three hours after administration lower spectral power values were seen in general for the verum condition (please compare median values in Table 2) compared to placebo values. Only one highly statistically significant value was recognized at the electrode position P4. At four hours after administration again lower values were obtained in general but only alpha waves-particularly alpha2 frequencies at the electrode positions C3, T3, P4 and O1- showed differences to placebo values (Table 3). Analysis of Single Brain Regions Under Mental Load
Different mental tasks produce changes of electric brain activity within several anatomically defined brain regions. According to earlier experience a concentration test induces spectral frequency changes which can be differentiated from those in the presence of memory
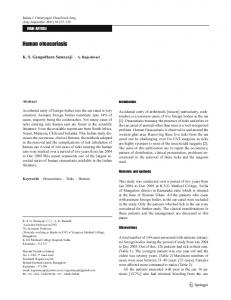
testing or performance of mathematical tasks. If one compares the spectral changes during the performance of the d2 test with the relaxed eyes open situation, brain regions react in a different reproducible manner also in this study. Fronto-temporal electrode positions show increases of theta power whereas in other regions alpha1, alpha2 and central beta1 power provide considerably lower values (Figure 2). These changes in comparison to the eyes open situation are statistically significant with p < 0. 05 for particular electrode positions (labelled by stars in the upper part of Figure 2). Documentation of these changes within a brain map containing all frequencies by additive colour mixture (for details s. methods) reveals more increases of theta power within left frontal cortex which leads to orange colour dominance on this side (middle part of Figure 2). Details of the statistical evaluation are given in the lower part of Figure 2 corresponding to the map. Highest significances for frequency changes during performance of the d2 test can be documented for increased fronto-temporal theta power and decreased alpha2 and beta1 power in other regions. Statistically significant decreases of alpha2 power were observed for the electrode positions Cz, C3, C4, Fz, P3, P4 and O2. A similar picture arises during the performance of the concentration performance test (CPT), where
Table 1 Absolute spectral power values Delta
Theta
Alpha 1
Alpha 2
Beta 1
Beta 2
Table of absolute values eyes open 0 h E
n
Pl
Neu
Pl
Neu
Pl
Neu
Pl
Neu
Pl
Neu
Pl
Neu
Cz
16
3. 35
4. 34
0. 60
0. 78
0. 55
0. 73
0. 43
0. 54
0. 67
0. 76
0. 90
1. 22
Fz
16
3. 42
2. 89
0. 68
0. 76
0. 67
0. 66
0. 66
0. 62
0. 54
0. 55
0. 82
0. 93
F3
16
2. 75
2. 45
0. 71
0. 59
0. 76
0. 76
0. 69
0. 54
1. 10
0. 65
2. 04
1. 60
C3
16
1. 67
2. 49
0. 46
0. 54
0. 67
0. 78
0. 59
0. 54
1. 17
1. 44
1. 75
2. 21
P3
16
1. 70
1. 71
0. 36
0. 40
0. 54
0. 42
0. 60
0. 47
0. 71
0. 80
0. 58
0. 67
Pz
16
1. 95
2. 92
0. 48
0. 55
0. 75
0. 76
0. 74
0. 70
0. 73
0. 84
0. 49
0. 60
P4
16
1. 63
1. 83
0. 35
0. 43
0. 61
0. 58
0. 63
0. 74
0. 63
0. 71
0. 46
0. 65
C4
16
1. 74
2. 23
0. 39
0. 49
0. 56
0. 74
0. 84
0. 73
1. 19
1. 38
1. 63
1. 52
F4
16
3. 22
2. 93
0. 64
0. 55
0. 67
0. 86
0. 61
0. 58
1. 07
0. 95
1. 75
2. 57
F7
16
10. 21
9. 86
1. 39
1. 42
1. 41
1. 52
1. 23
1. 40
2. 07
1. 67
3. 66
5. 09
T3
16
3. 22
5. 21
0. 77
0. 72
0. 83
1. 18
0. 97
1. 18
1. 56
2. 66
3. 25
5. 21
T5
16
3. 32
3. 13
0. 83
0. 83
1. 48
1. 68
1. 15
1. 27
1. 66
1. 89
1. 53
1. 66
O1
16
3. 41
4. 01
0. 60
0. 84
0. 86
1. 07
0. 81
0. 85
1. 22
1. 45
2. 18
1. 70
O2
16
3. 33
3. 87
0. 61
0. 75
0. 78
1. 21
1. 26
1. 17
1. 18
1. 85
1. 94
2. 47
T6
16
2. 38
3. 06
0. 67
0. 74
1. 44
1. 51
1. 26
1. 07
1. 24
1. 45
1. 33
1. 22
T4
16
4. 36
3. 84
0. 72
0. 70
0. 99
0. 81
1. 04
0. 76
1. 47
1. 31
4. 65
2. 61
F8
16
7. 09
10. 47
1. 30
1. 32
1. 45
1. 57
1. 27
1. 38
2. 03
2. 41
5. 27
5. 76
Me
16
3. 22
3. 06
0. 64
0. 72
0. 76
0. 81
0. 81
0. 74
1. 18
1. 38
1. 75
1. 66
Absolute spectral power values for each electrode position before administration of drug or placebo during relaxation under the recording condition of eyes open. Data are given in μV2. These data are taken as 100% reference for further evaluation. E = Electrode; Me = Median; n = number of subjects.
Dimpfel et al. BMC Psychiatry 2011, 11:123 http://www.biomedcentral.com/1471-244X/11/123
Page 5 of 15
Table 2 Relative spectral power values 3 h after intake of placebo or verum Delta
Theta
Alpha 1
Alpha 2
Beta 1
Beta 2
Relative Change of Power (Eyes open) 3 h E
n
Pl
Neu
Pl
Neu
Pl
Neu
Pl
Neu
Cz
16
Fz
16
F3
Pl
Neu
Pl
Neu
76. 26
80. 86
141. 47
101. 74
167. 62
148. 57
143. 90
129. 48
138. 02
136. 95
117. 94
112. 48
89. 24
101. 39
113. 30
124. 66
131. 00
124. 75
115. 87
97. 27
130. 94
108. 74
120. 41
118. 65
16
108. 84
95. 86
132. 14
138. 32
131. 94
135. 07
126. 42
133. 43
144. 76
157. 32
184. 04
137. 30
C3
16
142. 33
87. 68
143. 49
108. 64
169. 91
122. 99
152. 78
125. 20
147. 19
117. 70
106. 15
122. 51
P3
16
127. 85
98. 28
145. 54
126. 43
132. 27
136. 77
121. 91
127. 87
109. 91
120. 80
94. 47
103. 24
Pz
16
130. 78
78. 11
150. 01
111. 89
168. 78
164. 56
135. 02
151. 40
113. 80
116. 45
110. 13
116. 63
P4
16
164. 93
85. 49
139. 43
109. 61
138. 61
130. 38
135. 47
121. 61
120. 43
110. 64
120. 88
99. 43
C4
16
105. 90
95. 90
132. 31
106. 03
157. 52
140. 94
147. 72
132. 68
138. 18
116. 96
111. 74
103. 87
F4
16
94. 84
102. 06
127. 60
135. 14
168. 46
120. 06
153. 12
115. 03
152. 21
124. 18
151. 04
123. 12
F7
16
90. 67
130. 51
128. 58
144. 18
130. 13
135. 33
129. 85
152. 14
142. 09
129. 21
135. 91
148. 81
T3
16
138. 06
113. 38
159. 04
148. 86
194. 55
150. 60
152. 94
151. 82
124. 67
128. 47
89. 64
129. 67
T5
16
133. 63
112. 75
157. 72
123. 87
174. 70
149. 38
133. 22
118. 85
111. 39
123. 76
102. 13
100. 98
O1
16
115. 66
99. 28
131. 58
134. 39
144. 72
109. 64
132. 79
106. 45
144. 80
119. 48
128. 06
119. 81
O2
16
125. 27
87. 80
146. 25
112. 16
151. 53
104. 05
136. 12
118. 63
138. 64
112. 42
136. 18
105. 26
T6
16
147. 70
130. 73
154. 25
134. 24
156. 65
156. 08
145. 83
131. 83
119. 85
117. 06
94. 77
93. 16
T4
16
126. 46
134. 52
134. 62
136. 48
148. 01
160. 42
140. 19
133. 87
112. 93
111. 05
93. 34
109. 90
F8
16
Me
16
138. 90 126. 46
139. 66 99. 28
140. 93 140. 93
149. 02 126. 43
129. 44 151. 53
141. 96 136. 77
130. 45 135. 47
114. 66 127. 87
125. 83 130. 94
117. 55 117. 70
126. 19 117. 94
102. 40 112. 48
Relative power values (% of pre-drug) for each electrode position 3 h after administration of drug or placebo during relaxation under the recording condition of eyes open 4 h after intake of placebo or verum. Statistically significant different values in comparison to placebo (p = 0. 021) are printed fat. E = Electrode; Me = Median; n = number of subjects.
Table 3 Relative spectral power values 4 h after intake of placebo or verum Delta
Theta
Alpha 1
Alpha 2
Beta 1
Beta 2
Relative Change of Power (Eyes open) 4 h E
n
Pl
Neu
Pl
Neu
Pl
Neu
Pl
Neu
Pl
Neu
Pl
Neu
Cz
16
92. 93
85. 06
120. 76
115. 00
160. 49
134. 92
178. 70
129. 99
134. 43
136. 66
129. 63
119. 80
Fz
16
110. 12
106. 59
126. 85
126. 92
153. 09
126. 83
149. 41
108. 82
141. 30
110. 69
109. 46
114. 19
F3
16
130. 77
121. 17
131. 11
133. 99
143. 29
131. 57
146. 84
126. 35
152. 52
129. 60
139. 15
136. 29
C3
16
143. 39
103. 03
161. 99
106. 40
184. 32
125. 74
199. 06
122. 00
163. 24
119. 82
131. 87
91. 23
P3
16
125. 22
101. 65
139. 11
129. 07
127. 10
129. 55
135. 28
129. 60
112. 85
123. 79
107. 19
110. 95
Pz
16
122. 58
102. 78
118. 77
117. 04
138. 91
122. 57
140. 81
134. 61
122. 99
122. 09
116. 98
120. 23
P4
16
169. 23
90. 46
161. 94
123. 27
146. 17
126. 59
149. 79
123. 37
132. 53
112. 93
124. 39
106. 21
C4
16
108. 49
91. 85
139. 05
111. 22
154. 92
144. 81
179. 28
125. 38
132. 69
129. 46
137. 85
113. 68
F4
16
117. 70
138. 61
129. 74
130. 22
158. 47
118. 51
154. 69
109. 41
162. 97
130. 81
134. 72
114. 71
F7
16
122. 49
180. 62
154. 49
152. 29
146. 71
147. 22
131. 11
147. 22
137. 28
132. 59
141. 24
145. 14
T3
16
155. 39
151. 76
218. 06
137. 20
210. 65
141. 20
212. 31
138. 22
143. 21
127. 92
128. 86
91. 49 115. 14
T5
16
132. 15
144. 40
153. 07
134. 47
153. 93
153. 34
147. 75
136. 95
123. 87
129. 40
109. 77
O1
16
136. 22
108. 16
137. 12
124. 71
166. 38
118. 52
171. 29
115. 74
170. 13
122. 99
140. 16
95. 78
O2
16
118. 31
101. 77
154. 50
121. 48
162. 00
114. 22
152. 19
118. 28
143. 77
116. 68
131. 18
107. 77
T6
16
175. 11
147. 15
156. 15
140. 95
154. 38
145. 39
138. 18
130. 82
119. 30
116. 71
T4
16
156. 82
167. 62
155. 88
142. 24
173. 66
157. 10
142. 40
148. 35
140. 33
134. 77
F8
16
167. 63
130. 59
138. 15
144. 36
141. 56
145. 84
137. 09
115. 38
139. 92
117. 06
Me
16
130. 77
108. 16
139. 11
129. 07
154. 38
131. 57
149. 41
126. 35
139. 92
123. 79
106. 77 137. 56 132. 92 131. 18
109. 75 111. 50 117. 37 113. 68
Relative power values (% of pre-drug) for each electrode position 4 h after administration of drug or placebo during relaxation under the recording condition of eyes open 4 h after intake of placebo or verum. Statistically significant different values in comparison to placebo (p = 0. 021) are printed fat. E = Electrode; Me = Median; n = number of subjects.
Dimpfel et al. BMC Psychiatry 2011, 11:123 http://www.biomedcentral.com/1471-244X/11/123
Page 6 of 15
Figure 2 Physiological changes of spectral frequency content during d2 test. Depiction of frequency changes at all electrode positions during the performance of the d2 test in comparison to the relaxed eyes-open state at the first visit (day A). Colour vision map with interpolated data is constructed as described under methods. Statistically significant changes between these two states are marked by an asterisk and depicted with respect to position in the map. Left side of figure corresponds to frontal brain region.
mathematical calculations have to be done. Large increases of left and middle frontal theta power are accompanied by massive decreases mainly in centro-parietal alpha2 spectral power involving also some areas with decrease in beta1 power. These changes in
comparison to the relaxed eyes open status are also statistically highly significant (labelled by stars in Figure 3). Increases of left frontal theta power are also recognized in the map (middle part of Figure 3). Statistically significant decreases of alpha2 power in other regions were
Dimpfel et al. BMC Psychiatry 2011, 11:123 http://www.biomedcentral.com/1471-244X/11/123
Page 7 of 15
Figure 3 Physiological changes of spectral frequency content during CPT. Depiction of frequency changes at all electrode positions during the performance of the d2 test in comparison to the relaxed eyes-open state at the first visit (day A) before drug administration. Colour vision map with interpolated data is constructed as described under methods. Statistically significant changes between these two states are marked by an asterisk star and depicted with respect to position in the map. Left side of figure corresponds to frontal brain region.
observed for the electrode positions Cz, C3, Fz, P3, Pz, P4 and O1. During the performance of the memory test, where a row of 8 combined letters and numbers have to be memorized within 4 seconds, also left and right frontal
delta and theta power increase in a highly significant manner (labelled by stars in the upper part of Figure 4) which also leads to dominant red-yellow colour increases in the brain map (middle part of Figure 4). Details of the statistically significant differences in
Dimpfel et al. BMC Psychiatry 2011, 11:123 http://www.biomedcentral.com/1471-244X/11/123
Page 8 of 15
Figure 4 Physiological changes of spectral frequency content during memory test. Depiction of frequency changes at all electrode positions during the performance of the d2 test in comparison to the relaxed eyes-open state at the first visit (day A). Colour vision map with interpolated data is constructed as described under methods. Statistically significant changes between these two states are marked by an asterisk and depicted with respect to position in the map. Left side of figure corresponds to frontal brain region.
Dimpfel et al. BMC Psychiatry 2011, 11:123 http://www.biomedcentral.com/1471-244X/11/123
comparison to the relaxed status are documented in the lower part of Figure 4. Statistically significant decreases of alpha2 power were observed for the electrode positions Cz, Fz, P3, P4 and O1. Thus, all three mental loads lead to somewhat different changes of frequency patterns in comparison to the relaxed state but have in common a fronto-temporal increase in delta and/or theta power with significant decreases of alpha and beta1 power in other brain regions. Analysis of Drug Effects in the Presence of Various Mental Loads
No significant differences between verum and placebo were seen with regard to fronto-temporal delta/theta power increases. In order to better interpret the effects of the drug on electric spectral power, medium power of those electrode positions involved in the statistically significant (at least by p < 0. 05) decrease of alpha2 power during mental work were unified to give one parameter set. They represent a brain region heavily involved in the process of a particular mental task performance. Recording under the three different mental performance conditions succeeded in uncovering druginduced changes within the alpha and beta1 spectral frequencies during the 3rd and 4th hour after drug administration. Results for the d2 test are given in Figure 5. Under this recording condition statistically significant lower power values of alpha1, alpha2 and beta1 power were observed 3 and/or 4 hours after administration of verum in comparison to placebo. Regarding the data during performance of the CPT again statistically significantly lower values were obtained during the 4th hour after administration for theta, alpha1 and beta1 spectral power (Figure 6). During the 3rd and 4th hour performance of the memory test led to significantly diminished values of alpha1 and alpha2 spectral power in comparison to placebo, too (Figure 7). Thus, during all mental tasks alpha and beta1 power was statistically significantly lower in the presence of verum in comparison to placebo. Analysis of the psychometric results revealed either no difference (Table 4) or a trend of better performance for the CPT at 3 and 4 hours after administration (Table 5), which, however, was not statistically significant, or no difference during the memory test (Table 6).
Discussion Since it is quite difficult to evaluate the data from 17 electrode positions in the presence of 6 frequency ranges (a total of 102 parameters) the mathematical tool of discriminant analysis was used to describe the action of the active drug in comparison to placebo for the
Page 9 of 15
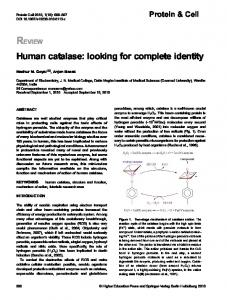
recording condition eyes open. This method allows time-dependent evaluation of all changes with respect to the pre-drug condition. As can be seen in Figure 8 all placebo values (labelled PL05 to PL4)-representing circadian rhythm dependent changes-group together with the two first recordings from active drug at 0. 5 to 1. 5 hours after administration (labelled Neu05 and Neu15). Depiction of the result of the effect of verum at 3 and 4 hours after administration in comparison to the effect of other synthetic reference drugs or plant-derived preparations tested earlier revealed clear effects for the active drug (labelled Neu3 and Neu4 in Figure 8). Closest neighbours in space (representing the result of the first to third discriminant function) but with a different colour due to the result of the fourth to sixth discriminant function are Nutrifin-relax and L-Theanine. Another neighbour not too far away with the same colour is fluoxetine. This kind of analysis of the experimental series revealed that the preparation NEURAPAS ® balance modulated electric brain activity already after a single acute administration in a statistically significant manner in comparison to placebo. Three and four hours after the administration of verum, basic activity has changed to a considerable degree in comparison to placebo according to this analysis. The pattern of changes approached that seen after reference drugs or preparations like Nutrifin-relax, a plant-derived preparation marketed to cope with stress [9]. Furthermore, fluoxetine, a chemical reference drug with clinically proven anti-depressive effects [17] is projected within the documentation of the result of discriminant analysis more close than to a preparation of St. John’s wort tested earlier under identical conditions (results not shown). Comparison with a previous study shows that the projection of Neurapas® balance is close to that of ginkgo/ ginseng. This vicinity of the projection of gingko/ginseng effects on electric activity of the brain suggests beneficial effects [18], since clinically significant improvement in memory loss, concentration, fatigue, anxiety and depressed mood associated with ginkgo/ginseng has been reported in the literature [19]. This suggests that NEURAPAS ® balance might unify antidepressive and relaxing features as claimed by the design of the combination according to known effects of single extracts from St. John’s wort, valerian, and passion flower (see reference under “background “). Spectral power of frequencies, which predominantly were attenuated during performance of mental work in more centro-parietal areas of the brain, remain low 3 and 4 hours after administration of the active preparation in comparison to placebo (which led to an increase of spectral power rather than the decrease observed in the pre-drug condition!). This suggests that mental
Dimpfel et al. BMC Psychiatry 2011, 11:123 http://www.biomedcentral.com/1471-244X/11/123
Page 10 of 15
Figure 5 Drug-induced changes of spectral frequency content during d2 test. Time dependence of spectral frequency changes during performance of the d2 test in the presence of placebo or verum. Choice of electrode positions in concordance with statistically significant changes observed during this test condition (s. Figure 3). * corresponds to p < 0. 12; ** corresponds to p < 0. 076; *** corresponds to p < 0. 02.
processing ability is relatively preserved 3-4 hours after administration of NEURAPAS® balance compared to the placebo condition, where increases of alpha and beta spectral power were observed presumably due to circadian rhythms and/or fatigue. Even if there was no difference in psychometric results, some higher values were noted with respect to the concentration performance
test (CPT), where highest performance was recorded during the 3rd and 4th hour after administration, perhaps related to the relative constancy of EEG spectra. For St. John’s wort maximum effects after single dose administration have been observed between 4 and 6 hours after administration [20]. This is in line with the current results, where no effects could be recognized
Dimpfel et al. BMC Psychiatry 2011, 11:123 http://www.biomedcentral.com/1471-244X/11/123
Page 11 of 15
Figure 6 Drug-induced changes of spectral frequency content during CPT. Time dependence of spectral frequency changes during performance of the CPT in the presence of placebo or verum. Choice of electrode positions in concordance with statistically significant changes observed during this test condition (s. Figure 4). * corresponds to p < 0. 12; ** corresponds to p < 0. 076; *** corresponds to p < 0. 02.
before the 3rd hour after administration. Better cognitive functioning in the presence of one of the ingredients (St. John’s wort) has been claimed on the basis of EEG recording by [21]. But, due to the combination of three plant-derived extracts the effects cannot be attributed to one of them. However, it is important to note, that at least no interference with cognitive performance could be seen as reported repeatedly during the use of
other synthetic preparations like benzodiazepines as anti-anxiety drugs or serotonin-reuptake inhibitors for treatment of depression [1]. With respect to the rationale of combining the three extracts a more potent neuroactivity of the triple combination compared to Hypericum alone and the additive effects of Passiflora and Valeriana suggested a synergy between constituents of these herbal extracts as derived from in vitro
Dimpfel et al. BMC Psychiatry 2011, 11:123 http://www.biomedcentral.com/1471-244X/11/123
Page 12 of 15
Figure 7 Drug-induced changes of spectral frequency content during memory test. Time dependence of spectral frequency changes during performance of the memory test in the presence of placebo or verum. Choice of electrode positions in concordance with statistically significant changes observed during this test condition (s. Figure 5). * corresponds to p < 0. 12; ** corresponds to p < 0. 076; *** corresponds to p < 0. 02.
experiments with multielectrode neurochips [22]. This study indicated that the ingredients of NEURAPAS ® balance act on GABA and serotonin receptors. Involvement of the GABAergic transmission has also been claimed for one of the constituents of the triple combination (Passiflora incarnate) by in vivo trials by [23] as well as in vitro experiments [24].
EEG frequencies reflect the activity of particular neurotransmitter activities as discovered earlier in preclinical studies using recording from depth electrodes in freely moving rats. From these earlier preclinical experiments is became clear that alpha1 waves seem to be related to serotonergic transmission [25] and that alpha2 waves seem to be related to the activity of
Dimpfel et al. BMC Psychiatry 2011, 11:123 http://www.biomedcentral.com/1471-244X/11/123
Page 13 of 15
Table 4 Result of psychometric procedures d2-test
Table 6 Result of psychometric procedures Memory
d2-test results
Memory results
0h
0,5 h
1,5 h
3h
4h
Placebo
NEURAPAS®
Mean
12,32
12,14
SD
4,02
3,06
SEM
1,07
0,80
Mean
13,67
13,09
SD
3,82
3,27
SEM
1,02
0,84
Mean SD
13,62 4,22
13,71 3,89
SEM
1,12
0,91
Mean
13,35
13,19
SD
3,95
3,27
SEM
1,05
0,84
Mean
13,59
13,53
SD
3,77
3,13
SEM
1,01
0,82
Placebo 0h
0,5 h
1,5 h
3h
4h
NEURAPAS®
Mean
10,77
11,37
SD
3,98
3,64
SEM
1,06
0,92
Mean
10,95
11,38
SD
4,10
3,60
SEM
1,10
0,96
Mean SD
10,68 4,46
11,29 3,13
SEM
1,19
0,80
Mean
11,11
12,12
SD
4,38
3,75
SEM
1,07
1,00
Mean
11,51
11,95
SD
3,74
3,65
SEM
0,99
0,92
Listing of psychometric results for three different mental tests:
Listing of psychometric results for three different mental tests:
dopamine [26]. Based on these preclinical results one might interpret the data obtained with respect to NEURAPAS® balance in a sense that ingredients contained within this extract combination activate serotonergic and dopaminergic transmission. These two transmitters are well known to be involved in depression and anxiety. Synthetic drugs acting at receptors of these two neurotransmitters are prescribed first line to treat these psychiatric conditions, especially serotonin-reuptake inhibitors for the treatment of depression. Some decreased values of alpha1 and alpha2 waves during the recording condition “eyes open” are therefore in line with the view that NEURAPAS® balance activates these
transmitter systems and initiates its action already after the first intake. Finally, the question of combining different extracts must be tackled. According to literature changes of the EEG in the presence of for example valerian roots extract could not be shown, even at dosages as high as 300 or 600 mg [27]. Also with respect to St. John’s wort dosages as high as 900 mg had to be given in order to see changes of electrical activity [20]. Positive results with an extract from passion-flower were obtained with a dose of 425 mg native extract (to be published). Thus, the relatively low amounts of the single extracts combined within
Table 5 Result of psychometric procedures CPT CPT results 0h
0,5 h
1,5 h
3h
4h
Placebo
NEURAPAS®
Mean
6,57
5,59
SD
6,17
5,95
SEM
1,61
1,59
Mean
5,32
5,91
SD SEM
4,57 1,20
4,94 1,25
Mean
6,55
5,85
SD
5,98
4,93
SEM
1,58
1,29
Mean
5,93
6,97
SD
5,33
5,83
SEM
1,41
1,52
Mean SD
6,87 7,30
7,86 5,76
SEM
1,93
1,52
Listing of psychometric results for three different mental tests:
Figure 8 Discriminant Analysis of EEG source density data. Depiction of the result of linear discriminant analysis of EEG source density data for all four recording periods after administration of verum and placebo. Result from the first three discriminant functions is displayed by means of space coordinates x, y and z. Values of the 4th to 6th linear discriminant functions respectively determine the amount of red, green, and blue in additive colour mixture analogous to the RGB mode of TV.
Dimpfel et al. BMC Psychiatry 2011, 11:123 http://www.biomedcentral.com/1471-244X/11/123
NEURAPAS® balance speak in favour of not only additive but potentiating effects of single ingredients from St. John’s wort herb, valerian root, and passion flower herb in order to produce the electric profile of effects on the human brain as described above.
Conclusions Administration of NEURAPAS ® balance resulted in a prevention of circadian EEG changes which normally consist in increases of spectral power in all six frequency ranges. Under the condition of mental work this attenuation became statistically significant for alpha and partially beta waves at 3 and 4 hours after intake. No cognitive impairment could be shown during the recording period according to analysis of psychometric testing. Linear discriminant analysis showed that the effects of NEURAPAS® balance are more comparable to the effects of Fluoxetine (a synthetic antidepressant drug) than to those in the presence of St. John’s wort extract without producing side effects. Acknowledgements Mrs. Petra Werling is gratefully acknowledged for her skills in performance of the experiments. Mrs. Leonie Schombert is acknowledged for documentation of the results und composition of figures.
Page 14 of 15
4.
5.
6.
7. 8.
9.
10.
11. 12. 13.
14.
15. Author details 1 Justus-Liebig-University c/o NeuroCode AG, Sportparkstr. 9, 35578 Wetzlar, Germany. 2NeuroCode AG, Sportparkstr. 9, 35568 Wetzlar, Germany. 3Pascoe Pharmazeutische Präparate GmbH, 35394 Giessen, Germany. Authors’ contributions WD provided the electrophysiological technology, supervised the performance of the experiments, gave interpretation of the results and wrote the manuscript. KK performed the medical examinations and evaluated unexpected events. GW initiated the study and made major contributions to the design. She also provided important information on the pharmacology of single as well as of the combined constituents of the preparation. The authors read and approved the manuscript. Competing interests The authors declare that they have no competing interests. Received: 1 November 2010 Accepted: 2 August 2011 Published: 2 August 2011 References 1. Takahshi M, Iwamoto K, Kawamura Y, Nakamura Y, Ishihara R, Uchiyama Y, Ebe K, Noda A, Noda Y, Yoshida K, Iidaka T, Ozaki N: The effects of acute treatment with tandospirone, diazepam, and placebo on driving performance and cognitive function in healthy volunteers. Hum Psychopharmacol 2010, 25:260-7. 2. Smoller JW, Allison M, Cochrane BB, Curb JD, Perlis RH, Robinson JG, Rosal MC, Wenger NK, Wassertheil-Smoller S: Antidepressant use and risk of incicent cardiovascular morbidity and mortality among postmenopausal women in the Women’s Health Initiative study. Arch Int Med 2009, 1169:2118-39. 3. Movafegh A, Alizadeh R, Hajimohamadi F, Eshehani F, Nejatfar M: Preoperative oral Passiflora incarnate reduces anxiety in ambulatory sugery patients: a double-blind, placebo-controlled study. Anesth Analg 2008, 106:1728-32.
16.
17.
18.
19. 20.
21.
22.
23.
24.
25.
Bhattacharyya D, Jana U, Debnath PK, Sur TK: Initial exploratory observational pharmacology of Valeriana wallichii on stress management: a clinical report. Nepal Med Coll J 2007, 9:36-9. Kasper S, Caraci F, Forti B, Drago F, Aguglia E: Efficacy and tolerability of Hypericum extract for treatment of mild to moderate depression. Eur Neuropsychopharmacol 2010, 20:747-65. Weeks BS: Formulations of dietary supplements and herbal extracts for relaxation and anxiolytic action: Relarian™. Med Sci Monit 2009, 15: RA256-262. Ernst E: Herbal remedies for anxiety - a systematic review of controlled clinical trials. Phytomedicine 2006, 13:205-8. Fiebich BL, Knörle R, Appel K, Kammler T, Weiss G: (Pharmacological studies in an herbal drug combination of St. John’s wort (Hypericum perforatum) and passion flower (Passiflora incarnate): in vitro and in vivo evidence of synergy between Hypericum and Passiflora in antidepressant pharmacological models. Fitoterapia 2011, 3:474-80. Dimpfel W, Pischel I, Lehnfeld R: Effects of lozenge containing lavender oil, extracts from hops, lemon palm and oat on electrical brain activity of volunteers. Eur J Med Res 2004, 9:423-431. World Medical Association Declaration of Helsinki: Ethical principles for medical research involving human subjects. 52nd WMA General assembly, Edinburgh, Scotland 2000. d2-Test: Aufmerksamkeits-Belastungs-Test, Rolf Brickenkamp (8. Auflage: 1994). Göttingen, Hogrefe Verlag. Düker H, Lienert GA: Der Konzentrations-leistungstest (KLT). Hogrefe Verlag, Göttingen; 1965. Lehmann D: Principles of spatial analysis. In Handbook of electroencephalography and Clinical Neurophysiology. Rev. Series, vol 1: Methods of Analysis of Brain and Magnetic Signals. Edited by: Gevins AS, Remond A. Amsterdam, Elsevier; 1987:309-354. Schober F, Dimpfel W: Relation between psychometric tests and quantitative topographic EEG in pharmacology. Int J Clin Pharmacol Ther Toxicol 1992, 30:428-430. Dietsch G, Berger H: Fourier Analyse von Elektroenzephalogrammen des Menschen. Pflüger’s Arch 1932, 230:106-112. Harmony T, Fernandez-Bouzas A, Marosi E, Fernandez T, Bernal J, Rodriguez M, Reyes A, Silva J, Alonso M, Casian G: Correlation between computed tomography and voltage and current source density spectral parameters in patient with brain lesions. Electroencephalogr Clin Neurophysiol 1993, 87:196-205. Benfield P, Heel RC, Lewis SP: Fluoxetine: A review of its pharmacodynamic and pharmacokinetic properties, and therapeutic efficacy in depressive illness. Drugs 1986, 32:481-508. Dimpfel W, Kler A, Kriesl E, Lehnfeld R: Neurophysiological characterization of functionally active drink containing extracts of ginkgo and ginseng by source density analysis of the human EEG. Nutritional Neuroscience 2006, 9:213-224. Beaubrun G, Gray GE: A review of herbal medicines for psychiatric disorders. Psychiatric Services 2000, 51:1130-4. Dimpfel W, Todorova A, Vonderheid-Guth B: Pharmacodynamic properties of St. John’s Wort. A single blind neurophysiological study in healthy subjects comparing two commercial preparations. Eur J Med Res 1999, 4:302-312. Johnson D, Ksciuk H, Woelk H, Sauerwein-Giese E, Frauendorf A: Effects of hypericum extract Li 160 compared with maprotiline on resting EEG and evoked potentials in 24 volunteers. J Geriatr Psychiatry Neurolog 1994, 7:44-46. Gramowski A, Jügelt K, Strüw S, Schulze R, McGregor GP, WartenbergDemand A, Loock J, Schröder O, Weiss DG: Functional screening of traditional antidepressants with primary cortical neuronal networks grown on multielectrode neurochips. Eur J Neurosci 2006, 24:455-65. Grundmann O, Wang J, McGregor GP, Butterweck V: Anxiolytic activity of a phytochemically characterized Passiflora incarnata extract is mediated via the GABAergic system. Planta Med 2008, 74:1769-73. Appel K, Rose T, Fiebich B, Kammler T, Hoffmann C, Weiss G: Modulation of the g-aminobutyric acid (GABA) system by Passiflora incarnate L. Phytother Res 2010. Dimpfel W: Characterization of atypical antipsychotic drugs by a late decrease in striatal alpha1 spectral power in the electropharmacogram of freely moving rats. Br J Pharmacol 2007, 152:538-48.
Dimpfel et al. BMC Psychiatry 2011, 11:123 http://www.biomedcentral.com/1471-244X/11/123
Page 15 of 15
26. Dimpfel W: Pharmacological modulation of dopaminergic brain activity and its reflection in spectral frequencies of the rat electropharmacogram. Neuropsychobiol 2008, 58:178-86. 27. Diaper A, Hindmarch I: A double-blind, placebo-controlled investigation of the effects of two doses of a valerian preparation on the sleep, cognitive and psychomotor function of sleep-disturbed older adults. Phytother Res 2004, 18:831-6. Pre-publication history The pre-publication history for this paper can be accessed here: http://www.biomedcentral.com/1471-244X/11/123/prepub doi:10.1186/1471-244X-11-123 Cite this article as: Dimpfel et al.: Early effect of NEURAPAS®® balance on current source density (CSD) of human EEG. BMC Psychiatry 2011 11:123.
Submit your next manuscript to BioMed Central and take full advantage of: • Convenient online submission • Thorough peer review • No space constraints or color figure charges • Immediate publication on acceptance • Inclusion in PubMed, CAS, Scopus and Google Scholar • Research which is freely available for redistribution Submit your manuscript at www.biomedcentral.com/submit