CUMULATIVE ENVIRONMENTAL IMPACTS AND SOCIAL VULNERABILITY IN THE SAN JOAQUIN VALLEY, CALIFORNIA 1
1
Ganlin Huang and 1Jonathan London
Center for Regional Change, University of California, Davis 152 Hunt Hall, One Shields Ave, Davis, CA 95616, USA Email:
[email protected] Phone: 530-752-0425/Fax: 530-752-3677
ABSTRACT Researchers in environment justice (EJ) are concerned with the differential distribution of environment hazards and benefits based on race or class. Quantifying the spatial distribution of cumulative impacts from multiple environmental hazards and social vulnerability of communities based on socioeconomic and demographic characteristics would provide valuable knowledge for EJ advocacy work, policy discussion and the academic community. In this context, our paper developed and mapped (1) a cumulative environmental hazard index (CEHI) and (2) a social vulnerability index (SVI) in the San Joaquin Valley, CA. A correlation analysis was conducted between the two indexes. Results showed that (1) CEHI and SVI are significantly correlated indicating that areas that are more socially vulnerable are impacted by more environmental hazards. (2) Areas close to the highways tend to be more socially vulnerable and impacted by more environmental hazards. Index Terms— Cumulative environmental impact, environmental justice, social vulnerability index, San Joaquin Valley 1. INTRODUCTION Environmental justice (EJ) refers to the differential distribution of environmental risks and benefits based on race, class, ethnicity, gender or age [1]. Researchers and policy-makers concerned about EJ argue that some communities, i.e. low-income communities and communities of color, face a higher frequency and magnitude of impact from environmental hazards while have less resource, i.e. time, money, education, health care, to minimize the potential health impact. Traditional EJ studies usually focus on the distribution of single pollutant based on race or class [e.g. 2-3], which does not meet the EJ advocates’ need working in the communities suffering from multiple pollution sources. At
978-1-4244-9566-5/10/$26.00 ©2010 IEEE
2788
the same time, it also raises the question of content validity in the academia world due to the lack of a full range of environmental indicators [4-6]. To address this issue, several indexes of cumulative impacts were developed and applied to various regions [6-8]. However, due to data availability and methodology challenge, the cumulative impact studies usually include one type of pollutants such as air pollutants or point source pollutants. The index of cumulative impacts is still far from describing every pollution source in the community. As the measurement of environment hazard is moving from including single pollutant source to multiple ones, the socioeconomic status of communities are mostly described by race, ethnicity, income and poverty. In many EJ studies and projects, these socioeconomic indicators were used to divide communities into categories by percentage of people of color, income or poverty rate. Then the magnitude of environmental burden on communities in each category was summarized and compared [e.g. 2-3]. These socioeconomic indicators provide a straightforward way to indentify disadvantaged communities, but as single pollutant measurement does not give the full picture of environment hazards, these socioeconomic indicators do not present the full spectrum of social stress. Recognizing the importance to measure social stress and resource in various aspects, social vulnerability index (SVI) was proposed and applied in several researches and EJ projects. Cutter [9] constructed a comprehensive SVI for the entire US using county-level socioeconomic and demographic data. Another study [10] examined the spatial pattern of social vulnerability and the risk of natural disasters associated with climate change in the southeast US. As a contribution to innovations in communityuniversity partnerships on cumulative impact research, a UC Davis team has collaborated with San Joaquin Valley Cumulative Health Impact Project, a coalition of environmental justice and environmental health organizations. This collaborative effort has developed a cumulative environmental hazard index (CEHI) and a SVI
IGARSS 2010
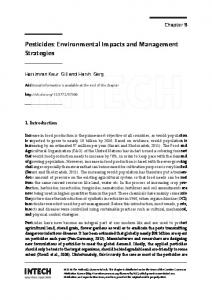
to bridge the two data gaps discussed above in the San Joaquin Valley, CA. This paper presents the methods used to develop CEHI and SVI and the spatial patterns of them. 2. METHODS The eight-county San Joaquin Valley is the southern expanse of California’s 450-mile-long Central Valley (Figure 1), which is well-known for its bountiful agricultural production with reaches to statewide, national, and global markets [11]. Besides the large magnitude of pesticides applied in the San Joaquin Valley [12-13], the valley has also been associated with some of the worst air quality in the nation [14].
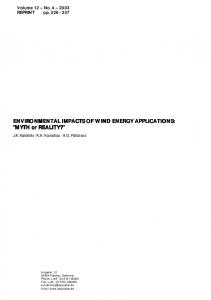
2.1. Cumulative environmental hazards index Datasets describing point source pollution include toxic release inventory sites, refineries, hazardous waste treatment, storage and disposal facilities, and chrome platters. These four datasets were merged into one file in ArbGISTM 9.3. Then a 1-mile radius buffer was drawn around the points (Figure 2). Percentage area of each block group falls within the 1-mile buffer was calculated as point source pollution index.
Figure 2 Locations of point source pollutions and its 1-mile radius buffer zone.
Figure 1 San Joaquin Valley, CA. Census block group was used as the unit of analysis in this research. Six datasets describing environmental hazards were included (Table 1). Except for the pesticide dataset which was attained from CA Department of Pesticide Regulation, all the environmental data were from US EPA. These data are based on different measuring units, including locations of point source pollution (i.e. toxic release inventory sites), amount of agriculture pesticide application by square mile, and cancer risk based census tract. Table 1 Environmental hazard datasets and indicator/index Indicator/Index Datasets Time Point source Toxic release inventory sites 2006 pollution index Refineries 2006 Hazardous waste treatment, 2006 storage and disposal facilities Chrome platters 2006 Pesticide Total amount agri. pesticide 2007 density application per 1 mile2 Total risk of National-scale air toxic 2002 cancer assessment
2789
Pesticide density, defined in this study as total amount of agricultural use pesticide application per square mile was generated based on pesticide use reporting data and the Public Land Survey System (http://www.nationalatlas.gov/articles/boundaries/a_plss.ht ml), which typically divides land into 1-square-mile sections. In this study, each 1-square-mile section was then divided into 16 units with a rough size of 100m x 100m each. Then pesticide density for each block group was calculated in ArbGISTM 9.3 as the mean value of that from the 100m x 100m units included more than 50% in a block group. National-scale Air Toxic Assessment (NATA) provides estimates of the risk of cancer and other serious health effects from inhaling air toxics. It uses census tract as estimate unit, which is one level higher than block group. In our study area, one census tract contains 5.5 block groups on average. We assign the risk estimates of a tract to all the block groups that were contained within it. Finally, we normalized pesticide density and total risk of cancer from NATA and then calculated the mean value of point source pollution index, pesticide density and NATA as CEHI. 2.2. Social vulnerability index
Social vulnerability index was calculated as mean of the four indicators derived from census 2000 [15]: percent of household below federal poverty line, percent of people older than 25 years who do not graduate from high school, percent of people of color, and percent of households that are linguistically isolated. 2.3. Correlation analysis Two analyses were done in PASW Statistics 18 to examine the relationship between cumulative environment hazard index and social vulnerability index. First, we conducted a correlation analysis between the two indexes. Then, we divided social vulnerability index into five categories by quantile and compared the distributions of cumulative environment hazard index of each category.
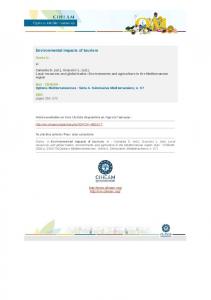
The spatial patterns of CEHI and SVI are presented in Figure 3. It shows that the areas along the highways tend to have higher values for both indexes. A boxplot was generated to present the distributions of CEHI within the five categories of SVI (Figure 4). The boxplot presents the five statistics (minimum, first quartile, median, third quartile, and maximum) within each category. Outliers were also pinpointed in the chart. There were 8 outliers within the first category and 1 outlier within the third category while each category contains about 450 cases. The result shows a clear increasing of the median and third quantile of CEHI when the SVI moves across the five categories from low to high.
3. RESULTS Our result shows that CEHI and SVI are correlated at the confidence level of 99% with a coefficient of 0.222. It indicates that the block groups having a high CEHI, which are the areas impacted by point source pollution facilities, more pesticide use or air toxic pollutants, tend to have a high SVI, which means more residents living there are people of color, in poverty, linguistically isolated, or do not graduate from high school.
Figure 4 Cumulative environmental hazard index and social vulnerability index 4. DISCUSSION AND CONCLUSIONS
Figure 3 Spatial distributions of cumulative environmental hazard index and social vulnerability index
2790
In this study, we developed an index of multiple environmental hazards including those people are most concerned with in the San Joaquin Valley: various point source pollution facilities, agricultural use pesticides application and toxics in the air. It provides an example of combining data based on various units (i.e. point, squaremile grid and census tract) together to generate one index measuring overall risk from environmental hazards. We also developed an index to measure how vulnerable people are when facing with the potential health risk and other problems brought by the environmental hazards. Our results showed significant positive correlation between the two indexes. It indicates that areas are impacted by most environmental hazards are those have the least resources to minimize the potential harm. This finding is consistent with other EJ studies. There are several limitations of this study. First, both CEHI and SVI are calculated as mean values of their subindicators. Such an additive approach does not take into
account the possible interactions between indicators. Second, limited by data availability neither CEHI nor SVI measured all relevant aspects. For example, dairy is another potential pollution source people concern about in the region but was not included in this study due to data availability. Third, to make best use of the available data, data sets used in this study are from different years as shown in Table 1. The most recent census data is 2000. The most recent NATA dataset is from 2002 and the data for point source pollution and pesticide use are from 2006 and 2007. In summary, this study measured cumulative environmental hazards and constructed an index based on point source pollutions, pesticide use and toxics in the air in the San Joaquin Valley, CA. It also examined the social vulnerability of communities in the region and built an index based on race, education, linguistically isolation and poverty. Our results showed the two indexes are significantly correlated indicating areas are impacted heavily by environmental hazards are more socially vulnerable. The spatial patterns of the two indexes were examined. Areas along the highways in the region are generally score high in both indexes, which indicating places suffering from more environmental impacts and more socially vulnerable.
[4] Babbie, E. The Practice of Social Research 9th Ed. Wadsworth, Belmont, CA, 2001. [5] Krieg, E.J. “Methodological Considerations in the Study of Toxic Waste Hazards,” The Social Science Journal, 33(2), pp.191-202, 1998. [6] Krieg, E.J. and D.R. Faber, “Not So Black and White: Environmental Justice and Cumulative Impact Assessment,” Environmental Impact Assessment Review, 24, pp. 667-694, 2004. [7] DeFur, P.L., G.W. Evans, E.A. Hubal, A.D. Kyle, R. A. Morello-Frosch, and D.A. Williams, “Vulnerability as A Function of Individual and Group Resources in Cumulative Risk Assessment,” Environmental Health Perspectives, 115, pp. 817824, 2007. [8] Su, J.G., R.A. Morello-Frosch, B.M. Jesdale, A.D. Kyle, B. Shamasunder, and M. Jerrett, “An Index for Assessing Demographic Inequalities in Cumulative Environmental Hazards with Application to Los Angeles, California,” Environmental Science and Technology, 43, pp. 7626-7634, 2007. [9] Cutter, S.L., B.J. Boruff, W.L. Shirley, “Social Vulnerability to Environmental Hazards,” Social Science Quarterly, 84(2), pp. 242-261, 2003. [10] Oxfam America, Exposed Social Vulnerability and Climate Change in the US Southeast, Oxfam America, Boston, MA, 2009.
6. ACKNOWLEDGEMENT The authors thank the San Joaquin Valley Cumulative Health Impact Project (SJV CHIP) for their partnership. The analysis presented here is of the authors, and does not necessarily reflect the opinions of the SJV CHIP. This research was supported by funding from the Ford Foundation through the UC Davis Environmental Justice Project of the John Muir Institute of the Environment.
7. REFERENCES [1] Shrader-Frechette, K.S. Environmental Justice: Creating Equality, Reclaiming Democracy. Oxford University Press, New York, USA, 2002. Sze, Julie and Jonathan K. London. “Environmental Justice at the Crossroads” Sociology Compass 2/4 (2008): 1331–1354. 2008. [2] Bullard, R.D. Dumping in Dixie: Race, Class and Environmental Quality. Westview Press, Boulder, Colorado, USA, 1990. [3] United Church of Christ, Toxic Wastes and Race in the United States: A National Report on the Racial and Socio-economic Characteristics of Communities with Hazardous Wastes Sites. Commission for Racial Justice, United Church of Christ, New York, USA, 1987.
2791
[11] Walker, R.A. The Conquest of Bread: 150 Years of Agribusiness in California, The New Press, New York, NY, 2006. [12] Harnly, M., R. McLaughlin, A. Bradman, Me. Anderson, and R. Gunier, “Correlating Agricultural Use of Organophosphates with Outdoor Air Concentrations: A Particular Concern for Children,” Environmental Health Perspectives, 113(9), pp. 11841189, 2005. [13] Californians for Pesticide Reform (CPR), Airborne Poisons: Pesticides in Our Air and in Our Bodies, San Francisco, CA, Available at (http://www.pesticidereform.org /downloads/BiodriftSummary-Eng.pdf), May 2007. [14] ALA, American Lung Association State of the Air 2007, American Lung Association, New York, NY, 2007.
[15] Geolytics, Inc. Census 2000 Long Form Dataset, Geolytics, Inc., East Brunswick, NJ, 2000.