Chapter 2: External Shocks and Reserves Adequacy . . . . . . . . . 20 ... 2.4.1 Assumptions for Valuation of Future Trade Balance Surpluses. 44. 2.4.2 Asset ..... funds channeled to capital formation, a higher return activity. ..... macroeconomic variable. ..... does not reject the null hypothesis of a unit root while the PP test does.
Current Account Deficits, Sudden Stops, and International Reserves Accumulation
by
Salem Nechi
A thesis submitted to the Department of Economics in conformity with the requirements for the degree of Doctor of Philosophy
Queen’s University Kingston, Ontario, Canada August 2009
c Salem Nechi, 2009 Copyright °
Abstract This dissertation addresses the causes of and policy responses to the 1990s current account crises. The first chapter explores the relative importance of external shocks as key determinants of the significant increase of foreign reserves accumulated in many emerging market economies, and provides a comprehensive framework to assess the adequacy of reserve holdings. Using the case of Mexico, I find that more than two thirds of the increase in international reserves can be replicated by a linear combination of external shocks, without an abrupt regime shift after the Tequila crisis. I also find that Mexico has historically adopted an appropriate reserves policy, with 1994 being an exception. However, under the current reserves policy, there is a positive probability of a current account crisis in the near future. In chapter Two, I investigate the optimal reserves policy. The analysis predicts an optimal level of reserves in Mexico that is considerably higher than the actual level. When I account for the possibility of a bailout by the outside world in case of a crisis, Mexico’s current reserves policy is in the range of my model’s predictions. The final chapter proposes a new explanation for the existence and nature of sudden stops. In my model, a sudden stop forms a necessary solution to the moral hazard problem in investment and can be rationalized as part of an optimal lending strategy in the face of asymmetric information. i
Co-Authorship Chapter 3 of this thesis is co-authored with Huw Lloyd-Ellis in the Department of Economics, Queen’s University.
ii
Dedications To my Mother, my Father, and my siblings: For your love and all support throughout my life. To my wife Houda: For your constant support, encouragement and love. To my daughters Miriam and Essma: Four your love and smiles that inspired me.
iii
Acknowledgments I am greatly indebted to Huw Lloyd-Ellis and Thorsten Koeppl for their guidance, support, insights and encouragement. I acknowledge financial assistance from Huw Lloyd-Ellis and the Department of Economics at Queen’s University. I am very grateful for my wife, daughters, and parents for their love and, most of all, their patience.
iv
Table of Contents Abstract
i
Co-Authorship
ii
Dedications
iii
Acknowledgments
iv
Table of Contents
v
List of Tables
x
List of Figures
xi
Chapter 1: General Introduction . . . . . . . . . . . . . . . . . . . . .
1
1.1
Sudden Stops and Sub-optimal Policy Responses . . . . . . . . . . . .
1
1.2
Overview of the Thesis . . . . . . . . . . . . . . . . . . . . . . . . . .
4
1.3
Contributions to the Literature . . . . . . . . . . . . . . . . . . . . .
7
1.3.1
Determinants of Foreign Reserves . . . . . . . . . . . . . . . .
8
1.3.2
Adequacy of Reserves . . . . . . . . . . . . . . . . . . . . . . .
11
1.3.3
Optimal Level of Reserves . . . . . . . . . . . . . . . . . . . .
13
1.3.4
Explaining Sudden Stops . . . . . . . . . . . . . . . . . . . . .
15
v
1.4
Mexico . . . . . . . . . . . . . . . . . . . . . . . . . . . . . . . . . . .
17
Chapter 2: External Shocks and Reserves Adequacy . . . . . . . . .
20
2.1
Introduction . . . . . . . . . . . . . . . . . . . . . . . . . . . . . . . .
20
2.2
External Shocks and Reserves Accumulation . . . . . . . . . . . . . .
22
2.2.1
Decomposition of Foreign Reserves . . . . . . . . . . . . . . .
23
2.2.2
Empirical Analysis . . . . . . . . . . . . . . . . . . . . . . . .
24
2.2.3
Contribution of Traditional Variables to the Reserves Process
26
2.2.4
Contribution of the Exogenous Shocks to the Reserves Process
28
Adequacy of Foreign Reserves . . . . . . . . . . . . . . . . . . . . . .
35
2.3.1
Sustainability and Adequacy . . . . . . . . . . . . . . . . . . .
37
2.3.2
Trade Balance . . . . . . . . . . . . . . . . . . . . . . . . . . .
39
Assessing Foreign Reserves Policy . . . . . . . . . . . . . . . . . . . .
43
2.4.1
Assumptions for Valuation of Future Trade Balance Surpluses
44
2.4.2
Asset Pricing Model . . . . . . . . . . . . . . . . . . . . . . .
46
2.4.3
Historical Assessment of Sustainability . . . . . . . . . . . . .
48
2.4.4
Reserves Policy and Crisis Prediction . . . . . . . . . . . . . .
51
2.4.5
Adequacy Rule . . . . . . . . . . . . . . . . . . . . . . . . . .
54
Conclusion . . . . . . . . . . . . . . . . . . . . . . . . . . . . . . . . .
56
Chapter 3: A Simple Model of Optimal Reserves . . . . . . . . . . .
58
2.3
2.4
2.5
3.1
Introduction . . . . . . . . . . . . . . . . . . . . . . . . . . . . . . . .
58
3.2
Reserves Process and Balance of Payments Sustainability . . . . . . .
62
3.2.1
Adequacy of Reserves Policy . . . . . . . . . . . . . . . . . . .
64
Total Cost of Holding Reserves . . . . . . . . . . . . . . . . . . . . .
65
3.3
vi
3.4
3.5
3.3.1
The Social Cost of Sudden Stop . . . . . . . . . . . . . . . . .
66
3.3.2
The Opportunity Cost of Reserve Holdings . . . . . . . . . . .
67
3.3.3
The Expected Total Cost . . . . . . . . . . . . . . . . . . . . .
68
3.3.4
Present Discounted Value of Total Costs . . . . . . . . . . . .
69
Estimation of Optimal Reserves . . . . . . . . . . . . . . . . . . . . .
71
3.4.1
Benchmark Calibration . . . . . . . . . . . . . . . . . . . . . .
71
3.4.2
Optimal Reserves . . . . . . . . . . . . . . . . . . . . . . . . .
72
3.4.2.1
No Bailout . . . . . . . . . . . . . . . . . . . . . . .
73
3.4.2.2
Bailout . . . . . . . . . . . . . . . . . . . . . . . . .
76
3.4.2.3
Sensitivity of Optimal Reserves to Changes in Parameters . . . . . . . . . . . . . . . . . . . . . . . . . . .
78
Conclusion . . . . . . . . . . . . . . . . . . . . . . . . . . . . . . . . .
80
Chapter 4: Learning, Risk Taking, and Sudden Stops
. . . . . . . .
83
4.1
Introduction . . . . . . . . . . . . . . . . . . . . . . . . . . . . . . . .
83
4.2
The Environment . . . . . . . . . . . . . . . . . . . . . . . . . . . . .
88
4.2.1
Contracting . . . . . . . . . . . . . . . . . . . . . . . . . . . .
92
4.2.2
Timing . . . . . . . . . . . . . . . . . . . . . . . . . . . . . . .
94
Bayesian Strategies and Bayesian Equilibria . . . . . . . . . . . . . .
95
4.3.1
Separating Equilibrium . . . . . . . . . . . . . . . . . . . . . .
96
4.3.2
Pooling Equilibrium . . . . . . . . . . . . . . . . . . . . . . . 100
4.3
4.4
Optimal Contract . . . . . . . . . . . . . . . . . . . . . . . . . . . . . 103 4.4.1
Equilibrium Contract . . . . . . . . . . . . . . . . . . . . . . . 103
4.4.2
Comparative Statics . . . . . . . . . . . . . . . . . . . . . . . 107 4.4.2.1
Debt Maturity . . . . . . . . . . . . . . . . . . . . . 108 vii
4.4.2.2 4.5
4.6
Foreign Bank’s Participation . . . . . . . . . . . . . 109
Sudden Stop . . . . . . . . . . . . . . . . . . . . . . . . . . . . . . . . 110 4.5.1
Sudden Stop and Debt Maturity . . . . . . . . . . . . . . . . . 111
4.5.2
What is International about All That? . . . . . . . . . . . . . 112
Conclusion . . . . . . . . . . . . . . . . . . . . . . . . . . . . . . . . . 114
Bibliography
. . . . . . . . . . . . . . . . . . . . . . . . . . . . . . . . . 116
Appendix A: Chapter 2
. . . . . . . . . . . . . . . . . . . . . . . . . . 124
A.1 Model Estimates . . . . . . . . . . . . . . . . . . . . . . . . . . . . . 124 A.1.1 Dynamic OLS Estimation . . . . . . . . . . . . . . . . . . . . 124 A.1.2 Estimated Variance-Covariance Matrix of the Shocks . . . . . 125 A.1.3 Estimated Parameters of the VAR Model . . . . . . . . . . . . 126 A.1.4 Other Estimates and calibration . . . . . . . . . . . . . . . . . 126 A.2 Data . . . . . . . . . . . . . . . . . . . . . . . . . . . . . . . . . . . . 126 A.2.1 Traditional variables . . . . . . . . . . . . . . . . . . . . . . . 126 A.2.2 Asset Returns . . . . . . . . . . . . . . . . . . . . . . . . . . . 127 A.2.3 Other variables . . . . . . . . . . . . . . . . . . . . . . . . . . 127 A.2.4 Trade Balance . . . . . . . . . . . . . . . . . . . . . . . . . . . 128 A.3 Contribution of Traditional Variables to Reserves Process . . . . . . . 128 A.4 Calibration of the Two-Factor Asset pricing Model: From Unpublished Appendix of Lloyd-Ellis and Zhu (2001)
. . . . . . . . . . . . . . . . 129
A.5 Details Related to Calculation of the Present Value . . . . . . . . . . 131 Appendix B: Chapter 4
. . . . . . . . . . . . . . . . . . . . . . . . . . 137
B.1 Lender’s maximization Problem . . . . . . . . . . . . . . . . . . . . . 137 viii
B.2 Proof of condition (4.26) . . . . . . . . . . . . . . . . . . . . . . . . . 138 B.3 Corollary 3 . . . . . . . . . . . . . . . . . . . . . . . . . . . . . . . . 139
ix
List of Tables 2.1
Contribution of Traditional Variables to Reserves Process . . . . . . .
28
2.2
Contribution of Exogenous Shocks to Reserves Process . . . . . . . .
30
2.3
Contribution of Shocks to Trade Balance Movements . . . . . . . . .
43
A.1 Decomposing Reserves Based on Cointegration Analysis . . . . . . . . 125 A.2 VAR Estimates . . . . . . . . . . . . . . . . . . . . . . . . . . . . . . 126 A.3 Other Estimates and calibration . . . . . . . . . . . . . . . . . . . . . 126
x
List of Figures 2.1
Contribution of Exogenous Shocks to Foreign Reserves . . . . . . . .
32
2.2
Constant vs. Constant and Dummy . . . . . . . . . . . . . . . . . . .
33
2.3
Contribution of Exogenous Shocks to Net Liabilities . . . . . . . . . .
42
2.4
Contribution of Exogenous Shocks to Income Transfers Process . . . .
44
2.5
Historical Assessment of Reserves Policy in Mexico. . . . . . . . . . .
49
2.6
Probability of crisis under the current reserves policy. . . . . . . . . .
52
2.7
Probability of crisis if current target of Reserves-GDP ratio is doubled. 53
2.8
Adequacy Rule. . . . . . . . . . . . . . . . . . . . . . . . . . . . . . .
55
3.1
Optimal Reserves Without Bailout. . . . . . . . . . . . . . . . . . . .
74
3.2
Optimal Reserves With Bailout . . . . . . . . . . . . . . . . . . . . .
77
3.3
Sensitivity of Optimal Reserves to Change in Social Cost. . . . . . . .
79
3.4
Sensitivity of Optimal Reserves to Change in Opportunity Cost. . . .
80
4.1
Timing. . . . . . . . . . . . . . . . . . . . . . . . . . . . . . . . . . .
95
A.1 Traditional Demand for Reserves . . . . . . . . . . . . . . . . . . . . 129
xi
Chapter 1 General Introduction 1.1
Sudden Stops and Sub-optimal Policy Responses
During the 1990s, the world financial market experienced many disruptions caused by crises in individual economies as well as contagion effects spreading from one country to another. Financial crises are events in which people suspect that some major economic agents can no longer satisfy their financial obligations, triggering panic in financial markets. For instance, creditors refuse to roll over government bonds when fiscal solvency comes into doubt. Commercial bank clients withdraw their deposits when rumors of bank troubles spread. Investors exchange domestic currency for foreign currency when the central bank’s foreign reserves are going to be depleted. In addition to these typical responses, a “sudden stop” of foreign capital flows might occur if the economy initially has access to international markets. A sudden stop refers to an event in which the domestic economy loses access to international capital markets because private foreign residents suddenly stop lending to domestic residents. Panic due to financial turmoil results in a drastic shift in the 1
CHAPTER 1. GENERAL INTRODUCTION
2
supply of foreign funds to the extent that the direction of capital flows reverses. As financial turmoil arises, people react to minimize their costs. Typically, the domestic economy borrows foreign funds in order to finance its consumption or investment (i.e. running a current account deficit). Based on the intertemporal approach to the current account, adjustments of the current account result from optimization of economic agents that attempt to smooth consumption and allocate wealth. However, the framework relies on the assumption that the country’s access to international capital markets is unrestricted. Therefore, current account adjustments that the domestic economy has to undertake in response to sudden stops are sub-optimal, thus implying welfare losses. This motivates the study of sudden stops and the underlying “sub-optimal” policy responses, which undermine national welfare. Over the past decade and a half, there have been many current account adjustments that have been viewed by policy institutions and academic circles as suboptimal responses to sudden stops. One renowned example is the accumulation of international reserves in emerging economies hit by sudden stops, where reserves to GDP ratios rose, on average, from 6 percent before the sudden stops to about 15 percent afterwards.1 The increase in international reserves deserve special attention for two reasons. On the one hand, the proponents of reserves accumulation argue that a large stock of reserves helps to provide self insurance against sudden stops, to mitigate the effects of terms of trade shocks on real exchange rate, and to smooth over time the adjustment to shocks by allowing more persistent current account patterns. On the other hand, the opponents of this strategy argue that international reserves earn a return that is lower than the market rate of interest (or the potential 1
The calculation includes 18 Sudden Stop episodes that occurred between 1994 and 2002. See Table 1 of Durdu et al. (2007) for details.
CHAPTER 1. GENERAL INTRODUCTION
3
return on real investments); thus, reserve holdings entail forgone earnings. In fact, the opportunity cost of holding reserves in safe, low-return assets is not having those funds channeled to capital formation, a higher return activity. This debate about the benefits and the costs of holding reserves has generated a literature that has three strands. The focus of the first is on the determinants of the demand for reserves. The second strand addresses the appropriate level of reserves a country should accumulate based on a set of macroeconomic variables such as the external short-term debt, imports, and money demand. The third strand emphasizes the optimal levels of reserves based on cost-benefit analysis. This dissertation adds to the literature with three interrelated contributions: (1) investigating the determinants of the increase in reserves in the aftermath of the sudden stop episodes, (2) providing a comprehensive framework to assess the efficiency of reserve holdings, and (3) examining the optimal reserves based on a dynamic costbenefit approach. The first contribution adds to the debate about the determinants of the increase in reserves accumulated by many emerging market economies by claiming that the observed increase is not necessarily the result of a policy response to the financial crisis, to insure against future crises. The second contribution argues that the assessment of reserve holdings (i.e., effectiveness in preventing stops or not) is more informative if one accounts for all aspects of an economy (i.e., balance of payments sustainability, policymakers’ preferences, etc.) rather than only the sufficiency indicators, widely adopted by policymakers. Finally, the third contribution argues that considering a dynamic cost-benefit analysis for deriving optimal reserves (by including the sustainability of the balance of payments as a constraint in the welfare optimization problem) might be more intuitive than the standard approach.
CHAPTER 1. GENERAL INTRODUCTION
4
The analysis of the efficiency and optimization outlined above takes sudden stops as exogenous events and addresses the connections between balance of payments problems, policy actions to fend them off, and the related costs. In an additional contribution, in the last chapter of this dissertation this assumption is set aside and an explanation of the existence and nature of sudden stops without the imposition of exogenous restrictions is provided.
1.2
Overview of the Thesis
The objective of this thesis is to address the following questions: First, what drives the significant increase in international reserves? Second, is the current level of reserve holdings effective in preventing a balance of payments crisis? Third, what is the optimal level of reserves a country should hold? To answer these questions I investigate the effect of external shocks on foreign reserves accumulation, conduct a quantitative assessment of current foreign reserves polices, and examine the effect of the various costs on optimal reserves determination. The analysis is applied to the Mexican case and proceeds in three stages. The first stage separates out movements in reserves process that are due to permanent shifts in reserves policy to insure against the risk of balance of payments crises, from movements that result from external shocks. The second stage builds on this framework and introduces a new measure of adequacy to evaluate reserve policies and their efficiency in insuring against crises. The third stage uses the approach of assessing the adequacy developed in stage two together with a dynamic cost-benefit analysis to investigate the optimal international reserves.
CHAPTER 1. GENERAL INTRODUCTION
5
The decomposition method developed in stage one is based on a model that assumes that the reserves-GDP ratio depends on a target value plus a stochastic component driven by external shocks. Other components of the trade balance also depend on these external shocks. I estimate the parameters of the model using Mexican time series data for the period between 1981:Q1 and 2006:Q4. The estimated model broadly replicates many of the features of the Mexican trade balance movements. I find that 70 percent of the variation in foreign reserves, 81 percent of the variation in net liability position, and 53 percent of income transfers can be replicated by a simple linear combination of exogenous shocks to the Mexican economy. Based on these findings, in conjunction with a VAR model of the shock processes and a two-factor asset pricing model, I provide a flexible and easily applied measure of adequacy of reserve holdings. Whenever the sum of current reserves and the present value of the economy’s expected future trade balance (under the current target) is greater than its net liabilities, the balance of payments is sustainable and no need to adjust the reserves. That is, the current reserves policy is adequate. According to this approach, Mexico has historically adopted an adequate reserves policy, with 1994 being an exception. Although Mexico experienced a financial crisis in 1994, it did not adjust its reserves policy. This decision of not changing the policy raises the question of whether the current policy will be effective in preventing similar crisis in the future. An assessment of the current policy predicts a positive probability of balance of payments crisis in the near future. After evaluating the effectiveness of current reserves policy in preventing a crisis, the obvious question of whether this policy is optimal arises. In fact, the adequacy of the reserves policy does not necessarily imply that it is optimal. To see why this
CHAPTER 1. GENERAL INTRODUCTION
6
is the case, note that the adequacy rule described above does not put an upper limit on current policies. If a reserves-GDP ratio is found adequate, any higher ratio will be adequate, and the policymaker would not necessarily consider adjusting it. This of course results in forgone benefits. So, our starting point in deriving the optimal reserves is the trade-off between the desire to control for the costs of balance of payment imbalances (i.e., sudden stop cost), and the opportunity costs of holding reserves. The model predicts an optimal target level of the reserves-GDP ratio for Mexico considerably higher than the estimated long-run target. This result raises the question of why Mexico has a lower reserves-GDP ratio than it should have, even though it went through a severe crisis in 1994. One possible explanation is that the international aid package Mexico received at the time of the crisis, along with its strong conviction that it will get a similar rescue package should another crisis hit, gave less incentive to Mexico to undertake costly adjustments to increase its reserves. When the model accounts for this scenario, the current reserves policy is in the range of the model’s predictions. This thesis also aims at providing a new explanation of sudden stops. To this end, I develop a simple theoretical model to investigate the trade-off between learning and risk-taking in financial contracts. To learn relevant information about the borrower, the lender stages the capital lending to the borrower. This learning process, however, comes at the risk of losing the funds provided in earlier stages. Thus, in designing the contract, the lender considers this trade-off by optimally dividing the loan between short-term and long-term loans. The model is in line with the credit rationing literature that has come to the view that the termination of financial contracts may
CHAPTER 1. GENERAL INTRODUCTION
7
actually be an equilibrium phenomenon driven by the asymmetry of information between borrowers and lenders. In the equilibrium contract derived in Chapter Four of this dissertation, the concept of sudden stop arises endogenously resulting in a partial understanding of the classic agency problem of a financial crisis. Moreover, the model generates a share of long-term loan smaller than the share of short-term loan in the overall debt. This debt maturity structure matches the documented fact that the share of short-term debt in the overall debt is higher in emerging markets.
1.3
Contributions to the Literature
This dissertation joins the ongoing research on international reserves by addressing some of the aspects not yet explored, and providing complementary or alternative answers to the questions that have not yet received satisfactory answers. In particular, the focus of this study is on the effect of external factors on the increased accumulation of foreign reserves observed in many emerging market economies over the last decade and a half; on the assessment of current reserves policy, namely its effectiveness in preventing a crisis; and on determining its optimal level. While addressing these issues, the analysis assumes that the current account crises that generated interest in this policy tool (i.e., accumulation of reserves) are exogenous. When this assumption is set aside, the causes of current account crises become an interesting question to consider as well. In what follows, I discuss these issues and my view of the way in which they should be addressed.
CHAPTER 1. GENERAL INTRODUCTION
1.3.1
8
Determinants of Foreign Reserves
The significant increases in reserves accumulated by emerging market economies in the last decade and a half are often viewed as the result of deliberate policies established by governments that wish to insure themselves against the risk of future current account crises. To a large extent, however, existing analyses of foreign reserves pay little attention to the contribution of external shocks to the observed increase in reserves buildup since the 1990s, although few empirical studies have pointed out the importance of external factors on international reserves accumulation in emerging markets. For instance, Calvo et al. (1993) show that foreign components of U.S. interest rates and other indicators (income, real estate and equity markets) are able to explain around 50 percent of the variance of the real exchange rate and foreign exchange reserves in ten Latin American economies. Levy and Sturzenegger (2000) claim that the European business cycle affected foreign exchange reserves and the real exchange rate in several Latin American economies during the early 1990s. Mollick (2002) addresses the responses of the real exchange rate and reserves in Mexico to shocks in U.S. interest rates over the years 1988-2001. He finds that shocks to U.S. interest rates explain no more than 7.4 percent of the variance of international reserves and only 5.5 percent of real exchange rate changes. The analysis in these studies, however, fails to separate out movements in foreign reserves that are due to external shocks from those resulting from permanent shifts in reserves policies . Chapter Two attempts to fill this gap by discussing the effect of external factors on international reserves. In addressing the demand for international reserves, the empirical research (Heller and Khan 1978; Edwards 1985; Lizondo and Mathieson 1987; Landell-Mills 1989; and
CHAPTER 1. GENERAL INTRODUCTION
9
Lane and Burke 2001; among others) establishes a relatively stable long-run demand for reserves based on a limited set of explanatory variables. These variables can be grouped into five categories: economic size, current account vulnerability, capital account vulnerability, exchange rate flexibility, and opportunity cost. In theory, the volume of international financial transactions, and therefore reserve holdings, should increase with economic size. In the literature, GDP and GDP per capita are used as indicators of economic size. The vulnerability of the current account can be captured by such measures as imports to GDP ratio, trade openness and export volatility. In the long run, central banks will increase their reserves in response to greater exposure of the current account to external shocks. For this reason, the average level of reserves should be positively correlated with a long-run increase in both exports and imports. Capital account vulnerability increases with financial openness and the potential for resident-based capital flight from the domestic currency. Consequently, reserves should be positively correlated with such variables as the ratio of capital flows to GDP and the ratio of broad money to GDP, which signals the potential demand for foreign assets from domestic sources. Exchange rate flexibility is usually important: it reduces the demand for reserves, since central banks no longer need a large stockpile of reserves to manage a pegged exchange rate. There is an opportunity cost of holding reserves, because the monetary authority forgoes highyield domestic assets for low-yield foreign ones. This opportunity cost corresponds to the difference between the yield on reserves and the marginal productivity of an alternative investment. This variable is, however, often found to be insignificant in the empirical literature, a fact that likely reflects measurement problems (Edwards 1985).
CHAPTER 1. GENERAL INTRODUCTION
10
Edison (2003) studies the determinants of reserve holdings using a large panel that covers 122 countries with annual data from 1980 to 1996. Real GDP per capita, the population level, the ratio of imports to GDP, and the volatility of the exchange rate are found to be statistically significant determinants of reserves, while measures of capital account vulnerability and opportunity cost are insignificant. Predicted values from Edison’s model over the 1997-2002 period reveal that international reserves in many countries have increased more than is predicted by the determinants since 2001. The study concludes that foreign reserves in these countries have reached a point where some slowdown in the rate of accumulation is needed. Recent studies claim that the accumulation of international reserves is motivated by a large precautionary demand, providing self-insurance against the adverse output effects of sudden stops and capital flight shocks. For instance, Aizenman and Marion (2003), Bird and Rajan (2003), Aizenman, Lee, and Rhee (2004), Gosselin and Parent (2005), Aizenman and Lee (2005), Jeanne (2007), and Cheung and Ito (2007) argue that developing countries opted for a new policy in the aftermath of the 1990s crises that consists of accumulating international reserves. This argument is based on econometric evaluations suggesting several structural changes in the patterns of reserves hoarded by developing countries.2 Against this background there has been, surprisingly, little work that tries to quantify the importance of external shocks to the recent increase in reserves buildup. Chapter Two explores the relative importance of external shocks as key determinants of the significant increase of foreign reserves accumulated by Mexico. My approach is 2
A notable change occurred in the 1990s, a decade when the international reserves/GDP ratios shifted upwards; a trend that intensified shortly after the Mexican crisis of 1994 and the East Asian crisis of 1997-8, but subsided by 2000. Another structural change took place in early 2000s, mostly driven by an unprecedented increase in the hoarding of international reserves in China, from close to zero during 1998-2000 to more than $300 billion in 2006.
CHAPTER 1. GENERAL INTRODUCTION
11
built around a model in which the policymaker adopts a target level of the reservesGDP ratio and the accumulated reserves evolve around that target. I use the returns on a set of international financial securities and oil variables to identify exogenous shocks to the components of Mexico’s reserves. I find that these variables, in addition to being exogenous with respect to Mexican authorities, explain a much larger portion of the variation in foreign reserves movements than the variables traditionally used in the literature discussed above.
1.3.2
Adequacy of Reserves
To evaluate whether reserve holdings are sufficient, several indicators have been used in the literature. The ratio of reserves to short-term external debt measures the capacity of a country to service its external liabilities in the forthcoming year, should external financing conditions deteriorate sharply. The idea behind this indicator is that reserves should allow a country to comfortably survive without foreign borrowing for up to one year. According to the Greenspan-Guidotti rule, a ratio above one signals that a country holds an adequate level of reserves to face the risk of a financial crisis, while a ratio below one may suggest a vulnerable capital account (Greenspan, 1999 and BIS, 2000). If reserves exceed short-term debt, then a country can be expected to meet its obligations in the coming year and thus avoid rollover problems stemming from liquidity concerns. The ratio of reserves to imports is considered as a proxy for a country’s current account vulnerability. The ratio measures the number of months a country is able to finance its current level of imports. Normally, a ratio of 3 or 4 would be considered adequate (Fisher, 2001).3 Lastly, an indicator that is commonly 3
The ratio of reserves to imports should equal 0.25 according to the three-months-of-imports rule.
CHAPTER 1. GENERAL INTRODUCTION
12
used is the ratio of reserves to broad money. A conventional range for the ratio of reserves to broad money is 5 to 20 percent. The rationale for this ratio is that broad money reflects a country’s exposure to the withdrawal of assets from domestic sources (Calvo, 1996; De Beaufort-Wijnholds and Kapteyn, 2001). These measures of reserves adequacy have been used extensively by policymakers in emerging (and developed) economies because they are easy to implement. It is important to note that each of the above indicators is related to only one macroeconomic variable. Moreover, they are introduced within static frameworks and do not suggest a specific mechanism that can be used to investigate policy responses to external shocks. In the present work, because external shocks to the economy turn out to account for so much of the variation in foreign reserves, the effectiveness of foreign reserves as buffer stock to insure against future balance of payments crises becomes a key issue. Considering reserves as a tool to cope with liquidity shortage in times of a crisis while they are driven by external factors might result in ineffective intervention. Taking into account the effects of external shocks, Chapter Two proposes a new approach to assessing the adequacy of reserves holdings. The degree to which the level of reserves is appropriate depends on an assessment of the country’s external net liabilities position, the degree of its exposure to the external shocks, and the present value of its future incomes. The latter, in turn, depends on current targets of reserves to GDP and net liabilities to GDP ratios, current forecast of economic growth and interest rates, and the correlation of the external shocks with the rate at which future cash flows are discounted. This approach is based on Melesi-Ferri and Razin’s (1996) notion of current account sustainability, but I have extended their framework to allow the reserves to influence the likelihood of balance of payments crises. I am essentially
CHAPTER 1. GENERAL INTRODUCTION
13
comparing the stock of reserves accumulated plus the present discounted value of trade balance to the net liability position of the economy. The overall analysis suggests that this method of assessing foreign reserves captures the historical developments in Mexico. Moreover, this approach both offers a comprehensive way to predict current account crises and suggests policy actions relevant to these predictions.
1.3.3
Optimal Level of Reserves
Heller (1966) was the first to derive the optimal level of reserves from a model using a cost-benefit approach. The benefit of holding reserves stems from the ability to avoid a reduction in output in the case of a deficit in the balance of payments. The opportunity cost of holding reserves is the difference between the return on capital and on reserves. Heller’s solution links the optimal level of reserves to three variables: the propensity to import, the interest rate, and the stability of international accounts as reflected in the average yearly imbalances experienced in the past. Heller’s analysis, however, only takes into account of the situations of unfavorable deficits that lead to the minimum level of international reserves; it does not consider the situations of mixed deficits and surpluses that lead to the minimum. Moreover, Heller does not explicitly consider the economic situation after the international reserves reach the minimum level. Hamada and Ueda (1977) correct Heller’s shortcomings by elaborating the random walk behavior for the exhaustion of reserves, which eventually leads to adjustment costs, and by taking into account the state of affairs after the exhaustion of reserves. Frenkel and Jovanovic (1981) and Flood and Marion (2002) replace the discrete random walk assumption of the reserve behavior with the continuous counterpart, i.e., a Wiener process, and introduce uncertainty to the cost of
CHAPTER 1. GENERAL INTRODUCTION
14
reserve holding. They derive formally an explicit solution for optimal reserve holdings as a function of the rate of interest, the variance of the stochastic process governing international payments and receipts, and the mean rate of net payments. It is worth noting that the studies discussed above assume that the economy initially holds an optimal level of reserves. Any deviation from that initial level requires costly adjustments to restore the reserves to their initial level. Moreover, any simulated time path of the international reserves starting from the initial point of the optimal level does not incorporate any deterministic behavior (e.g., policy component) into the reserve movements and is characterized by a random walk behavior with upper and lower bounds. Accordingly, any observed behavior in the actual reserves should be interpreted as an adjustment toward attaining the initial optimal level. In my framework, I relax the assumption that the initial level of reserves is optimal. Moreover, the decomposition of reserves process into a policy component (i.e. target level of the reserves-GDP ratio) and stochastic component driven by external shocks suggests that movements in reserves should be interpreted as variation around the target level of reserves-GDP ratio, and not adjustment toward the optimal level. A key ingredient of my analysis is that I model the reserves process. The issue of cost benefit analysis has also been discussed by Ben-Bassat and Gottlieb (1992). They develop a model that stresses the importance of the potential cost of default (on external debt) as a major determinant of optimal reserves. They assume that the cost of reserve depletion is the cost of default on loans by the country rather than the adjustment cost. Studying the case of Israel, their simulated results show that, in each year of the sample period, the optimal level of reserves depends on the estimates of GNP foregone in case of default, the opportunity cost of holding
CHAPTER 1. GENERAL INTRODUCTION
15
reserves, and the determinants of the default probability. It is worth noting, however, that although Ben-Bassat and Gottlieb’s (1992) model does not assume the initial level of reserves to be optimal and accounts for some structural problems in the balance of payments, it restricts the cost to a finite number of periods and ignores any dynamics in the balance of payments. In my model, I correct for these shortcomings by using an infinite time horizon in the optimization problem and allowing the dynamics of the balance of payments. In contrast to Ben-Bassat and Gottlieb’s (1992) model, in which the optimal level of reserves depends on the state of the economy which is described by the subjective probabilities associated with the reserve depletion, the optimal level of reserves in my model depends on the state of the world economy which is represented by global factors.
1.3.4
Explaining Sudden Stops
The analysis in the previous two sections assume for the sake of simplicity that sudden stops are exogenous events. This assumption is in line with an extensive literature that has investigated the economic consequences of sudden stops and the policy actions undertaken to minimize their costs. Calvo’s (1998) seminal paper presents prospects of bankruptcy resulting from changes in relative prices of tradable and non-tradable goods. Arellano and Mendoza (2002) examine the quantitative implications of a set of models that propose to explain sudden stops within frameworks of financial frictions, and integrate them with an equilibrium business cycle framework for emerging economies. A common feature of these different models is that agents factor in the risk of future sudden stops in their optimal plans. Sudden stops are a property of the unique flexible-price competitive equilibrium of these models. The results of Arellano
CHAPTER 1. GENERAL INTRODUCTION
16
and Mendoza (2002) show that these models can yield relatively infrequent sudden stops with large current account reversals and deep recessions nested within smoother business cycles. Calvo, Izquierdo and Mejia (2004) used a panel regression analysis for thirty-two countries to conclude that the degree of domestic liability dollarization; the sensitivity of the real exchange rate to capital flow reversals, which is related to the degree of trade openness; as well as deterioration in the terms of trade are important factors that induce sudden stops. All the studies discussed above have attempted to examine the causes of sudden stops. However, the approaches taken there do not rely on a demand-and-supply framework for capital flows in which private foreign residents suddenly stop providing capital to the domestic economy. In Chapter Four, I try to fill this gap in the literature by developing a simple theoretical model based on the demand and supply of capital. In a broad sense, the framework I propose is an application of contracting theory and could be interpreted in various ways. One application is in the context of international capital markets, where the termination of the contracting relationship leads to a sudden stop of capital flows. To learn relevant information about the borrower’s characteristics and the overall economic environment, the international lender lender has to provide some capital to the domestic borrower. This learning process, however, comes at the risk of losing the provided funds. In designing the contract, the lender considers this trade-off by optimally allocating the loan between short-term and longterm loans. The key contribution of my analysis is that I discuss the trade-off between learning and risk-taking in financial contracts when information frictions govern the contracting relationship.
CHAPTER 1. GENERAL INTRODUCTION
1.4
17
Mexico
To implement my new approaches to reserves decomposition; new adequacy measure; and optimal reserves determination, I take Mexico as a case study. Mexico provides a good example for my analysis for several reasons. Among them are: (i) its financial and trade integration has intensified since the mid-1980s, which makes it more vulnerable to exogenous shocks, (ii) its international reserves stock has increased in the aftermath of the Tequila crisis, and (iii) since Mexico is a small open economy, it is much easier to identify shocks that are exogenous to Mexico. In 1994, Mexico experienced a reduction in net private capital flows equivalent to almost 4 percent of its GDP followed by a further drop of more than 5 percent in 1995. Output dropped by 6 percent in the crisis year, and the economy was plunged into a systemic banking crisis until 1997. As a response to this financial distress, Mexico undertook many policy actions to cope with the crisis and prevent similar situations in the future. Many observers consider that the accumulation of international reserves was one of the key policy adjustments that Mexico adopted. In fact, reserves-to-GDP ratio increased from 4.6 percent before the crisis to 7.3 percent afterwards.4 After accumulating high levels of international reserves, the trend of such levels and its economic implications for the Mexican economy motivated analyses of the benefits and costs of continuing with this strategy. Those analyses indicated that the benefits of holding a continuously increasing amount of international reserves were not as compelling as before for two reasons. First, Mexico had been granted an investment grade status by all major credit rating agencies, and second, the external debt profile of both the public and private sectors had continuously improved during 4
See Table 1 of Durdu, Mendoza, and Terrones (2007).
CHAPTER 1. GENERAL INTRODUCTION
18
the previous years. The process of assessing the relative advantages of further accumulation of international reserves in Mexico also benefited from some technical papers (produced mainly by the Bank of Mexico) in order to estimate the adequate level of international reserves. These papers estimate the adequate level of international reserves as a function of the present value of Mexico’s external debt amortization flows. The estimated relationship implies that, as the payment profile of the country’s foreign debt improves, the need for international reserves should be reduced. The estimates were also derived from ad hoc rules and from theoretical models aimed at minimizing both the carry-on costs of international reserves and the interest rate spread on the external debt. All of these studies suggest that the level of reserves in Mexico is “more than adequate.” The argument of not pursuing a much higher level of international reserves in Mexico is further strengthened by the possibility that Mexico could be bailed out in case of financial turmoil, as was the case in the 1982 debt crisis and the Tequila crisis in 1994. In fact, as a response to the perceived threat to financial stability from Mexico, the United States in 1995 committed $20 billion in repayable support, part of a nearly $50 billion international package to stem Mexico’s difficulties. Based on this experience, and on the bailouts that many countries received in the 1990s, the need for a higher level of international reserves to fend off financial turmoil might not be justified.5 Note also that oil revenue is an important driver of the stock of international 5
In additon to Mexico, most emerging market economies who experienced financial crises in the 1990s received bailouts of unprecedented size. South Korea and Brazil received packages of aid in excess of $40 billion each. Thailand, Indonesia and Russia received packages between $10 billion and $40 billion.
CHAPTER 1. GENERAL INTRODUCTION
19
reserves in Mexico. Given that Mexico has a high level of oil reserves, the argument of slowing down foreign reserves accumulation is strengthened even more. According to the 2006 annual report of the International Energy Agency, IEA, Mexico is the sixth-largest producer of oil in the world, producing on average 3.7 million barrels per day. Moreover, the oil sector generates over 10 percent of the country’s export earnings and one-third of government revenues.6 Furthermore, according to the Oil and Gas Journal (OGJ), as of January 1, 2006, Mexico had 12.9 billion barrels of proven oil reserves, consisting mostly of heavy crude oil varieties. A number of other studies have emphasized the importance of external shocks in general, and U.S. shocks in particular, to the Mexican economy. Herrera (2004) tests and measures the existence of common cycles between the economies of Mexico and the U.S., finding that both economies share a common trend and cycle. Torres and Vela (2003) examine the relationship between business cycles in Mexico and the U.S., and find that, as the manufacturing sectors of the two economies have become more integrated through trade linkages, business cycles across the border have become more synchronized. More recently, Sosa (2008) examines the relative importance of external shocks as sources of business cycle fluctuations in Mexico. He finds that U.S. shocks explain a large share of Mexico’s macroeconomic fluctuations after NAFTA. He also finds that, during this period, Mexico’s output fluctuations have been closely synchronized with the U.S. cycle, and U.S shocks have had a large and rapid impact on Mexican growth. Swiston and Bayoumi (2008) examine the linkages across North America by estimating the size of spillovers from the major regions of the world to Canada and Mexico. Their results show that, since 1996, U.S. shocks have played an influential role in driving the Mexican business cycle. 6
Again, according to the IEA, Mexico is the tenth largest oil net exporter of oil in the world.
Chapter 2 External Shocks and the Adequacy of Foreign Reserves: The Case of Mexico 2.1
Introduction
Recent research highlights the presence of significant increases in reserves accumulated by emerging market economies since the 1990s.1 This increase is often viewed as the result of deliberate policies by governments wishing to insure themselves against the risk of balance of payments crises,2 which were perceived as more likely and more severe after the 1990s financial crises. This chapter explores the relative importance of external shocks as key determinants of the significant increase of foreign reserves 1
See Calvo and Reinhart (2000), Hausman, Panizza and Stein (2000), Flood and Marion (2002), Aizenman and Marion (2003, 2004), and Aizenman and Lee (2005), among others. 2 According to a survey of central bankers of developing and emerging market countries, the main reason for the recent buildup in reserves was to “secure protection from volatile capital flows”. See Pringle and Carver (2005).
20
CHAPTER 2. EXTERNAL SHOCKS AND RESERVES ADEQUACY
21
accumulated by Mexico. In this chapter, I also propose a simple and tractable empirical method aimed at assessing the adequacy of reserve holdings, and I predict balance of payments crises forced by external shocks. First, I propose a decomposition method that measures the contribution of exogenous shocks to reserves accumulation. I argue that the major part of movements in reserves can be explained by a simple linear combination of external shocks, such as returns on international financial securities and oil variables. Subsequently, I use the impact of external shocks on reserves process, in conjunction with a VAR model of the shock processes and a two-factor asset pricing model, to develop a new approach to evaluate the adequacy of reserves holdings and to show to what extent reserves can mitigate the adverse consequences of external influences. Finally, I produce a prediction of financial crises based on a Monte-Carlo style simulation and investigate the impact of variations in Mexico’s reserves on the likelihood of a crisis. The basic framework is in the spirit of the optimal reserves model discussed by Frankel and Jovanovic (1981) and developed further by Flood and Marion (2002). The reserves-GDP ratio is assumed to depend on a target value plus a stochastic component driven by external shocks. Other components of the trade balance also depend on these external shocks. The estimated results indicate that, in addition to being exogenous to Mexico, these variables explain a much larger portion of the variation in foreign reserves movements than the variables traditionally used in the literature. In deed, I find that external shocks account for 70 percent of the variation in foreign reserves, 81 percent of that in net liabilities, and 53 percent of income transfers. I also find no evidence of reserves policy adjustment following the crisis in 1994.
CHAPTER 2. EXTERNAL SHOCKS AND RESERVES ADEQUACY
22
The notion of current account sustainability developed by Melesi-Ferri and Razin (1996) provides a basis for my new method to assess the adequacy of reserve holdings. My new method extends Melesi-Ferri and Razin’s (1996) model to allow reserves to influence the likelihood of balance of payments crises. That is, the balance of payments is sustainable if the stock of reserves accumulated plus the present discounted value of the trade balance, under a given reserves policy, is greater than the net liability position of the economy. A reserve policy is adequate if the probability of unsustainable balance of payments over a particular time horizon is sufficiently low, under that policy. The overall analysis suggests that Mexico has historically adopted an adequate reserves policy, with 1994 being an exception. The model predicts, however, a positive probability of balance of payments crisis in the near future. The remainder of the chapter proceeds as follows. Section 2 explains the decomposition method as well as the empirical model and results. In section 3, I introduce the new approach to assess the adequacy of reserve holdings and perform the empirical analysis necessary to its implementation (that is, the estimation of the trade balance components). Section 4 describes how to use a VAR model and a calibrated asset pricing model to compute the present value of the trade balance, and discuss the adequacy of the Mexican reserves policy. Concluding remarks are provided in section 5. Details regarding the data, my calibration methodology, market valuation of trade balance, and simulation algorithm are provided in appendix A.
2.2
External Shocks and Reserves Accumulation
The purpose of this section is to determine how much of the increase in reserves accumulated by Mexico in the aftermath of the Tequila crisis can be explained by
CHAPTER 2. EXTERNAL SHOCKS AND RESERVES ADEQUACY
23
a permanent shift in “reserves policy”, and how much can be attributed to external influences.
2.2.1
Decomposition of Foreign Reserves
I assume that the policymaker adopts a target level of the reserves-GDP ratio, Tt∗ , and reserves evolve as follows: Rt = Tt∗ eF (Zt ) , Yt or ln(
Rt ) = Γt + F (Zt ), Yt
(2.1)
where Γt = ln(Tt∗ ), and Zt is a vector that summarizes the exogenous shocks in period t. F (Zt ) represents the stochastic component of the reserves process. The term Γt is a key element of my analysis. It summarizes the permanent components of the government’s policy variables. It could be time-varying and may change in response to the debt level and political events. I interpret significant and persistent changes in Γt as being associated with changes in the central bank’s reserves policy. In general, the state vector Zt may contain variables that are difficult to identify or are not directly observable. Let Xt be a vector of observable variables that are correlated with the state vector Zt . Using a linear approximation, I can express Ft (Zt ) as follows: Ft (Zt ) = β 0 Xt + ²t ,
where ²t is the residual that represents the shocks that are not captured by the observable variables and it is i.i.d., and ² ∼ N (0, σ² ). The vector β measures the
CHAPTER 2. EXTERNAL SHOCKS AND RESERVES ADEQUACY
24
marginal impact of the exogenous shocks. Thus, the reserves process can be expressed as ln(
Rt ) = Γt + β 0 Xt + ²t . Yt
(2.2)
This representation separates out the variation of reserves resulting from exogenous shocks, βXt , from the permanent policy component, Γt .3 So, the first step in my decomposition method is to identify the vector of observable variables, Xt . Once these variables are identified, we can then use regression to estimate the shock dependence vector, β, and the policy component, Γt .
2.2.2
Empirical Analysis
I use quarterly foreign reserves, FR, data for Mexico over the 1981:Q1 to 2006:Q4 sample period for the dependent variable. To identify the vector of observable variables, I consider two sets of variables: the variables commonly used in the literature, which I denote as traditional variables, and a new set that I consider key to my analysis, which I denote as shock variables. The traditional variables are used to 3
In general policymakers might respond to exogenous shocks by adjusting reserves holdings. This raises the question of whether the policy target is independent of the exogenous shocks. To expose this issue further, another way to represent (2.2) is ln(
Rt ¯ +βX ˜ t + ²t , ) = Γ + βX | {z }t Yt P olicy
or ln(
Rt ˜ t + ²t , ) = Γ + (β¯ + β)X Yt
where β¯ captures the “automatic” response of the central bank to exogenous shocks and β˜ refers to the non-policy related effects. However, because it is not possible to estimate the response to exogenous shocks, I assume a time-invariant policy response to exogenous shocks; that is, the assumption I make is that β¯ + β˜ is constant. Although the assumption is very strong it is not unusual in policy modeling. This argument is similar to the inflation targeting model developed by Taylor (1993). Later I test for the stability of these parameters.
CHAPTER 2. EXTERNAL SHOCKS AND RESERVES ADEQUACY
25
identified the variability of international receipts and payments. They consist mainly of current and capital accounts variables. I introduce these variables to compare my results (based on the new set of shock variables) with the findings of previous studies (based on the set of traditional variables). The data for the traditional variables span from 1985:Q4 to 2006:Q4. I consider imports propensity LIM P (log of imports to GDP); broad money LM 2 (log of M2 to GDP); exports volatility EXPV (10 quarters backward-moving standard deviation of exports receipts); financial openness FO (ratio of capital flows to GDP); the exchange rate volatility EXRV (12 months backward moving standard deviation of end-of-period exchange rate); and the opportunity cost of holding reserves, OPPCOST (measured as the domestic lending rate minus the U.S treasury bill rate). The shock variables, or the exogenous shocks, consist of indices of the market returns on a set of internationally traded financial assets and oil variables. The data for this set of variables span over the same period as that of the dependent variable (1981:Q1 to 2006:Q4). The asset return variables are the value weighted return (excluding dividend) on the New York Stock Exchange, VWR (from the CRSP tape, the quarterly value is calculated as the sum of the values of each of the three months of the quarter); the dividend yield, DIV, on the CRSP value-weighted index (measured as a 1-year backward-moving average of dividends divided by the S&P500 Composite Price Index–stock market price index at the first month of the quarter); the 3-month U.S. Treasury bill rate, TBILL; and the yield on 10-year U.S. government bonds, LONG. These asset return variables (in addition to the 1-year moving average of the 3-month treasury bill rate), or linear combinations of them, have been found to forecast asset returns and are discussed in more detail in Campbell (1996). As for
CHAPTER 2. EXTERNAL SHOCKS AND RESERVES ADEQUACY
26
the oil variables, I consider the (log of) crude oil price, LCOP, and the (log of) U.S. imports of crude oil from Mexico, LUSMCO. Since Mexico is a small open economy, it is reasonable to assume that these shock variables are not influenced by Mexico. For my purposes, I view these variables as picking up key components of the shocks affecting the world economy. I also define an additional dummy variable, D, which takes a value of zero before the Tequila crisis (1994:Q4) and 1 afterwards.
2.2.3
Contribution of Traditional Variables to the Reserves Process
Since the data available for the traditional variables, TDL, span a shorter period than the data available for the dependent variable, I consider a reduced sample period for this section (1985:Q4-2006:Q4). I test for time-series properties of each series by conducting augmented Dickey and Fuller (1979) (hereafter, ADF) and Phillips and Perron (1988) (hereafter, PP) tests. In both tests, I cannot reject the null hypothesis of a unit root for LIM P and LM 2. For OPPCOST the ADF test rejects the null hypothesis of a unit root while the PP test does not. As for EXPV, the ADF test does not reject the null hypothesis of a unit root while the PP test does. Because of the mixed results, I will consider these two series as stationary in my analysis. For FO, EXRV, and FR, both tests reject the null hypothesis of unit root. So, I take the first difference of the LIM P and LM 2 then estimate (2.2) by OLS, when Xt is identified by ∆LIM P , ∆LM 2, EXPV, FO, EXRV, and OPPCOST.4 As the results in column 1 of Table 2.1 show, all the traditional variables are correctly signed, with 4 I also try the case where the variables OPPCOST and EXPV are assumed to be non-stationary series. That is, I estimate model (2.2) with Xt includes the first difference of variables OPPCOST and EXPV, instread. The model specification does not improve.
CHAPTER 2. EXTERNAL SHOCKS AND RESERVES ADEQUACY
27
the exception of broad money, ∆LM 2 (change of log M2 to GDP),5 but only exports volatility is statistically significant. As predicted by most studies in the literature, foreign reserves are positively correlated with export volatility and imports. Financial openness is positively correlated with foreign reserves, confirming the importance of capital flows in the accumulation of reserves. Note, however, that the traditional ¯ for no more than 12 percent of the variation in variables account, as reported by R, reserves. This fact suggests that, perhaps, as Figure A.1 in appendix A illustrates, the demand for reserves does not reflect what we might a priori believe to be important determinants of reserves accumulation. Next, I run the same regression but include the dummy variable. Results are reported in Column 2 of Table 2.1. The model specification improves since more coefficients are statistically significant, but no more than 31 percent of the variation in reserves is explained. Although the Chow test suggests a structural change in the data, the model does not pick up the sharp swing in the reserves process during the time of the crisis. The failure of the traditional variables in capturing the variation in demand for foreign reserves is not unexpected. For the decomposition method to work well, the observable vector Xt should satisfy at least two conditions: (i) it contains variables that can capture a significant portion of exogenous shocks that affect the reserves accumulation, so that we can more confidently attribute changes in the intercept, Γt , to policy changes, and (ii) it only contains variables that are exogenous to the reserves policy designer (i.e, the central bank) so that any policy changes will be reflected in the policy component of model (2.2). The traditional variables considered here and 5
I expected ∆LM 2, the potential for resident-based capital flight from the domestic currency, which is an indicator of capital account vulnerability, to be statistically significant and correctly signed. This is because of the increasing role of the self-insurance motive against potential internal drain. Rothenberg and Warnock (2006) find that almost half of the episodes of sudden stops are actually episodes of sudden flights.
CHAPTER 2. EXTERNAL SHOCKS AND RESERVES ADEQUACY
28
Table 2.1: Contribution of Traditional Variables to Reserves Process
Change of log: - imports to GDP Ratio - M2 to GDP Ratio Exports Volatility Financial Openness Exchange Rate Volatility Opportunity Cost Constant
Traditional Variables
Traditional Variables & Dummy
.15 (.57) -.20 (1.06) 2.91e − 05∗∗∗ (7.90e − 06) 1.73 (2.25) .09 (.19) .15 (.23) −2.87∗∗∗ (.04)
.52 (.51) -.47 (.94) 2.19e − 06 (8.97e − 06) 1.29 (1.99) −.54∗∗ (.21) .57∗∗ (.22) −3.26∗∗∗ (.09) .70∗∗∗ (.15) 84 .31 [0.0000] 10.63
Dummy NOBS ¯2 R P-value Chow
84 .12 [ 0.0144]
Notes: (1) standard errors are given in parentheses. (2) Significance at 10%, 5% and 1% is referred to by ∗ , ∗∗ , and ∗∗∗ , respectively.
widely discussed in the literature do not satisfy either of these conditions.
2.2.4
Contribution of the Exogenous Shocks to the Reserves Process
Here I consider an alternative approach to identify exogenous shocks to the reserves process. I use two types of exogenous shocks: four indices of the market returns on a set of internationally traded financial assets, and two oil variables. The market return indices that I consider have been used extensively in the finance literature to represent underlying factors in stock market returns and to capture cyclical activity
CHAPTER 2. EXTERNAL SHOCKS AND RESERVES ADEQUACY
29
in the U.S. economy.6 As for the oil variables, it is not unreasonable to consider them as key variables driving foreign reserves in Mexico. Like many oil exporting countries, Mexico’s business cycle is correlated with the price of oil, its main export, so much so that this price has become a signal of aggregate conditions to (foreign and domestic) investors and policymakers alike in these countries.7 As a result of the many internal and external reactions to this signal, the change in Mexican government revenue (and then the reserves accumulation in this country) is correlated with the crude oil price and U.S. imports of crude oil from Mexico. As discussed earlier, since Mexico is a small open economy, it is reasonable to assume that these international variables are not influenced by Mexico. As in the previous exercise, I test for time-series properties of each series by conducting ADF and PP tests, but now the sample period is from 1981:Q1 to 2006:Q4, instead. Both tests do not reject the null hypothesis of a unit root for LCOP and LUSMCO, and do reject it for TBILL and VWR. For FR, the PP test rejects the null at all levels while the ADF test rejects it at the 5 percent level. Since these tests (ADF and PP) have lack of power in small sample size data, I will consider that FR as stationary series. For DIV, and LONG the two tests give mixed results. So, there are two ways to deal with these series. We can consider them as stationary, take their first difference of LCOP and LUSMCO, then estimate (2.2) by OLS, when Xt is identified by ∆LCOP , ∆LU SM CO, DIV, TBILL, LONG, and VWR. This is the approach I take her. Alternatively, we can consider the series of FR, DIV and 6
The approach taken here is similar to that of Lloyd-Ellis and Zhu (2001, 2006), who investigate the large and persistent budget surplus in Canada during the 1980s and 1990s and use internationally traded asset returns as instruments to identify exogenous shocks to surplus. They decompose movements in the primary surplus into those resulting from exogenous shocks and those induced by significant shifts in fiscal stance. Their results show that two thirds of the variation in the primary surplus can be replicated by a simple linear combination of the asset returns. 7 See the discussion in Chapter One of the relevance of the oil industry to Mexico.
CHAPTER 2. EXTERNAL SHOCKS AND RESERVES ADEQUACY
30
LONG as non-stationary and do a cointegration analysis. See appendix A for the results of this second approach.8 The estimation results of the first approach (taken here) are presented in column 1 of Table 2.2. The results illustrate the striking fact
Table 2.2: Contribution of Exogenous Shocks to Reserves Process Variable Change of log: - Crude Oil Price - U.S. M of Oil from Mexico Dividend yield Treasury Bills Yield on 10-year U.S Bonds Value Weighted Returns Constant
Shocks
Shocks & Dummy
Stability
-.14 (.26) -.67∗∗ (.33) -2.31∗∗∗ (.70) -9.97∗∗∗ (3.07) -1.54 (4.12) -.11 (.46) -3.07∗∗∗ (.03)
-.12 (.27) -.65∗∗ (.33) -2.54∗∗∗ (.81) -9.25∗∗∗ (3.33) -2.46 (4.44) -.06 (.47) -3.04∗∗∗ (.07) -.07 (1.13) 103 .70 1.41 [0.000]
-.14 (.43) -1.77∗∗∗ (.40) -2.45∗ (1.29) -17.36∗∗∗ (6.04) 6.91 (6.96) -.47 (.87) -3.11∗∗∗ (.09)
Dummy NOBS ¯2 R Chow
103 0.70 [0.000]
55 .54 [0.000]
Notes: (1) standard errors are given in parentheses. (2) Significance at 10%, 5% and 1% is referred to by ∗ , ∗∗ , and ∗∗∗ , respectively. 8 In appendix A, I describe how to estimate model (2.2) based on cointegration analysis, if FR, DIV, and LONG series are assumed non-stationary. Results of this exercise are reported in Table A.1. Overall, the two models have the same explanatory power, but parameter estimates from the model based on cointegration analysis are less significant.
CHAPTER 2. EXTERNAL SHOCKS AND RESERVES ADEQUACY
31
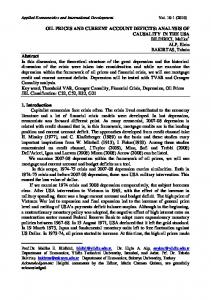
that 70 percent of the variation in foreign reserves can be explained by a simple linear combination of the asset returns and oil variables. The simple correlations between the reserves and the asset return variables are consistent with the theoretical predictions. All the asset return variables are negatively correlated with reserves. The treasury bill rate is viewed as an indicator of short-run opportunities in the U.S. economy. An increase in TBILL results in capital flows to the U.S. and then negatively affects the stock of foreign reserves. Dividends in the finance literature are used to forecast the future U.S. growth. An increase of DIV will result in capital flows to the U.S., and, consequently the stock of reserves is negatively affected. The RBC literature views the yields on 10-year U.S. government bonds, LONG, as a good indicator of the U.S. RBC. An increase in LONG reflects good expectations about the U.S. RBC, and then we should expect capital flowing to the U.S., a result confirmed by the sign of the coefficient on LONG. As for the correlations between the foreign reserves in Mexico and the oil variables, although ∆LU SM CO is statistically significant, both variables are not correctly signed. I expected that an increase in the crude oil price and U.S. imports from Mexico would generate more revenue to the Mexican government, resulting in a positive effect on the stock of reserves. Figure 2.1 shows the actual and fitted foreign reserves implied by the relationship between foreign reserves in Mexico and the exogenous shocks. The above exercise suggests that external shocks represent a good approximation of the factors driving the reserves accumulation in Mexico. This is an interesting finding and supports my argument that the significant increase in foreign reserves in Mexico is not necessarily the result of a policy adjustment that took place in the aftermath of the Tequila crisis. To explore this interpretation further, I ran the same
CHAPTER 2. EXTERNAL SHOCKS AND RESERVES ADEQUACY
−2
ln(FR/GDP)
32
Actual Foreign Reserves Fitted Foreign Reserves
−3
−4
−5 1981Q1
1994Q4
2006Q4
Figure 2.1: Contribution of Exogenous Shocks to Foreign Reserves regression but included the dummy variable. As the results in column 2 of Table 2.2 indicate, the coefficient on this dummy is statistically insignificant. A Chow test confirms this result and suggests that Mexico did not adjust upward its long-run target level of the reserves-GDP ratio. As discussed in the decomposition method, the constant term in this regression captures the permanent component of the government’s policy variable. The model suggests that, using the shock variables, over the period 1981-2006, the long-run policy target was 4.64 percent. By accounting for the possibility of a policy adjustment (i.e., introducing a dummy variable to test for a structural break) the long-run target
CHAPTER 2. EXTERNAL SHOCKS AND RESERVES ADEQUACY
33
became 4.46 percent. Thus, the reserves to GDP target decreased slightly by 0.18 percentage point.9 −2
ln(FR/GDP)
−2.7 −3.08 −3.4 Actual Foreign reserves Fitted Foreign Reserves
−5 1981Q1
1994Q4 date
2006Q4
Figure 2.2: Constant vs. Constant and Dummy Figure 2.2 depicts the fitted values from regressions of foreign reserves on a constant (dot line), and on a constant and the dummy (the dashed line with a jump), which might be viewed as an estimate of the non-shocks-adjusted foreign reserves. The non-shocks-adjusted foreign reserves suggest that there might be a policy shift in ∗ 0 t Recall that I estimate the model ln( R Yt ) = Γt + β Xt + ²t , so the long-run target of the reserves to GDP ratio is 9
ˆ∗
Tt∗ = eΓt = exp(−3.07) = 4.64%. When I include a dummy variable to account for the structural break, the long-run target of the reserves to GDP ratio becomes ˜∗ ˆ T˜t = eΓt +βdummy = exp(−3.07 − .04) = 4.46%.
CHAPTER 2. EXTERNAL SHOCKS AND RESERVES ADEQUACY
34
the aftermath of the Tequila crisis. However, after accounting for the shocks (Figure 2.1), the evidence of a policy shift disappears. In interpreting this relationship and using it for my purposes, I must address the following question: is this relationship stable over time? In Column 3 of Table 2.2, I report the results of estimating the model over the pre-crisis period 1981:1-1994:4. Although the shortness of the sample suggests that one should not expect very stable results that would be robust across possible specifications, the coefficient estimates (with the exception of the coefficient on the yield on 10-year U.S bonds, LONG) are fairly robust to this truncation of the sample period. Based on these empirical results, I interpret Mexico’s foreign reserves accumulation process as follows: Under the policy regimes that were in place up to the mid-1990s, exogenous global shocks accounted for 70 percent of the variation in the demand for international reserves. In the mid-1990s, however, exogenous shocks caused a period of liquidity problems and resulted in higher demand for foreign reserves. The Mexican government, however, did not respond to the crisis by increasing its long-run target level of the reserves-GDP ratio. The reason that the central bank did not increase its reserves-GDP ratio, in response to the financial distress the country went through, might be related to the the rescue package Mexico received in the aftermath of the Tequila crisis. As discussed in Chapter 1, in January 1995, the U.S. provided $20 billion in repayable support, part of a nearly $50 billion international package to stem Mexico’s difficulties. Having received enough funds to cope with the liquidity shortages, the Mexican government avoided making costly policy adjustments, namely increasing its reserves policy. According to the conventional view, the U.S bailout of Mexico in
CHAPTER 2. EXTERNAL SHOCKS AND RESERVES ADEQUACY
35
1995 was a success because it restored confidence in the collapsing peso and led to a quick economic recovery. The bailout, moreover, helped to keep Mexico on a marketoriented track. It is worth noting that many observers have argued that the bailout was justified given that Mexico’s relationship with the U.S is especially important.10 It is also important to note that Mexico received a rescue package from the IMF following the 1982 Mexican announcement that it could not service its foreign debt. It seems that the Mexican trade and financial integrations with the rest of the world in general, and with the U.S. in particular, together with Mexico’s conviction that it will be rescued should another crisis hit, discouraged it from undertaking a costly policy adjustment of its reserves policy in the aftermath of the Tequila crisis.
2.3
Adequacy of Foreign Reserves
In recent years, few studies have developed models that allow reserves to help prevent the onset of a sudden stop. Bussi`ere and Mulder (1999); Mody and Taylor (2002); Garcia and Soto (2004); Sachs, Tornell, and Velasco (1996); and Chamon, Manasse, and Prati (2007) argue and find support for the proposition that reserves may lower the likelihood of a crisis. Countries with large holdings of reserves may inspire confidence and be less susceptible to panic, which leads to self-fulfilling crises.11 This confidence argument is consistent with the approach of the major credit rating agencies, which factor in reserve holdings when determining sovereign credit ratings. In sum, it is quite uncontroversial to state that, other things being equal, foreign reserves help absorb unexpected (external) shocks and smooth current and capital 10
See Summers and D’Amato (1996). Even in first generation models, such as Krugman (1979), additional reserves affect the timing of a crisis. 11
CHAPTER 2. EXTERNAL SHOCKS AND RESERVES ADEQUACY
36
account imbalances. The question, of course, is how much reserves does an economy need to hold? Although this question has been asked many times in the recent past, it has not received a satisfactory answer. This is why policymakers have been using rules of thumb, which I outlined in Chapter 1. In fact, the official statements usually point to the need of building up international reserves to fend off external shocks and speculative attacks, but, they do not offer a target level based on fundamental considerations. For instance, an official in Korea’s central bank said “[T]here is no such thing as too much foreign international reserves.” On China’s international reserve holding, a Chinese official argued that there is “no unified benchmark on the appropriate amount of forex international reserve a country should hold in both theory and practice” and that “it could not be said to be ‘excessive’ or ‘deficient’.”12 It might be that the lack of applicability of theoretical predictions of optimal reserves holdings led to their non-implementation. Policymakers usually need tools and mechanisms that are simple and easy to use but, most importantly that satisfy their political concerns. Clearly, policymakers want to avoid external (and domestic) crises. But with increasing financial and trade openness (and with the associated increase in risk) it is less likely that an economy can be fully insured against external imbalances. Nonetheless, policymakers can adopt strategies to reduce the likelihood of the crisis. In this context, I introduce a flexible and practical approach to assess the policy of holding reserves as an insurance tool. 12
Day and Choi (2004) and Xinhua News Agency (2004).
CHAPTER 2. EXTERNAL SHOCKS AND RESERVES ADEQUACY
2.3.1
37
Sustainability and Adequacy
Here I introduce a concept of balance of payments sustainability that can accommodate many policy patterns and allows the stock of reserves to influence the likelihood of balance of payments crises. This has traditionally been done by investigating the external insolvency condition. Solvency is defined theoretically in relation to an economy’s present value budget constraint. By this definition, an economy is solvent if the present discounted value of future trade surpluses exceeds its current external indebtedness.13 The practical applicability of this definition, however, is inhibited by the fact that it relies on future events and policy decisions, without imposing any structure on them. Few studies have therefore attempted to define a baseline for future policy actions (Corsetti and Roubini (1991)). This attempt gives rise to the notion of sustainability: the current policy stance is sustainable if its continuation into the indefinite future does not violate solvency (budget) constraints (Milesi-Ferretti and Razin (1996)). Defining sustainability in relation to solvency is complex for current-account imbalances because current-account imbalances reflect the interaction among the savings and investment decisions of the government and domestic private agents, as well as the lending decisions of foreign investors. Although government decisions may at first be taken as given, private-sector decisions may not. An alternative way to think about this situation is to ask whether a continuation of the current policy stance is going to require a “drastic” policy shift ( unless ‘bailed out’), or lead to a “crisis.” If the answer is yes, the imbalance is unsustainable. Such a drastic change in policy or crisis situation may be triggered by a shock, either domestic or external, which 13
See Glick and Rogoff (1995), Razin (1993) and Liederman and Razin (1991).
CHAPTER 2. EXTERNAL SHOCKS AND RESERVES ADEQUACY
38
causes a shift in the confidence of domestic and foreign investors and a reversal of international capital flows. The framework I develop here addresses this question, and investigates whether a policy change has taken place since the Tequila crisis hit the Mexican economy. I also produce a prediction of crisis, under the current policy stance. In particular, I introduce a notion of sustainable balance of payments that accounts for all liabilities in the economy (not only the government’s and private agents’ external borrowing) and allows the reserve holdings to influence the likelihood of balance of payments crises. In addition, my definition of sustainability takes into account the fact that not all the assets an economy holds are liquid. In fact, the economy might not be able to liquidate its assets in a short time to satisfy its international obligations. On the other hand, even if the assets are highly liquid, the country might not be willing to liquidate them if its stock of assets reaches a lower bound, and this argument is supported by the fact that the debt and financial crises of the 1980s and 1990s showed that countries choose to default on their external debt while they still hold assets. The sustainability condition I define in this chapter accounts for this possibility. In this way, I implicitly relate the sustainability of an economy to the perception of foreign investors of the country’s inability or unwillingness to meet its external obligations. This approach provides a basis for a flexible and simple method for determining the implicit market assessment of a country’s external position and serves as an effective and practical tool to evaluate the adequacy of a reserves policy. Based on the assumption that reserves are ultimately being accumulated to service liabilities and to influence the perception of foreign investors, the adequacy rule developed here considers that the current reserves policy is adequate if the balance of
CHAPTER 2. EXTERNAL SHOCKS AND RESERVES ADEQUACY
39
payments, under that policy, is sustainable. The balance of payments is sustainable if g Rt + P V t (T Bt ) − N Lt ≥
φYt ,
(2.3)
g where, Rt is the stock of reserves; P V t (T Bt ) is the present discounted value of the trade balance, under a given policy stance; N Lt is the net liability (all liabilities minus all non-reserves assets) position of the economy at time t; and Yt is the GDP. The parameter φ captures foreign investors’ perception of the country’s inability or unwillingness to meet its external obligations. We can think of φ as the critical value of the net asset position that triggers a crisis. If condition (2.3) is satisfied, then the target level of the reserves-GDP ratio is adequate. But, if it is violated, then there is a need to change the policy. Therefore, the natural question in evaluating reserves policy is whether the current targets are effective in preventing a crisis (i.e., adequate). To answer this question I need first to calculate the trade balance, then calculate its discounted present value under the current policy stance. I also use the Mexican crisis in 1994 to calibrate φ. The remainder of this section uses the balance of payments equation to derive the trade balance and its components, then uses the decomposition method discussed in the previous section to estimate the movements of the trade balance components.
2.3.2
Trade Balance
In an open economy , the balance of payments equation is
CAt + KAt = ∆Rt ,
(2.4)
CHAPTER 2. EXTERNAL SHOCKS AND RESERVES ADEQUACY
40
where KAt is the financial account,14 CAt is the current account, and ∆Rt = Rt −Rt−1 is the change in reserves. The current account, in turn, can be written as,
CAt = T Bt + ITt ,
(2.5)
where ITt is the net income transfers. Combining (2.4) and (2.5) we get
T Bt + ITt + KAt = ∆Rt .
(2.6)
The financial account, KAt , represents the change in the net liabilities position of the country.15 That is, KAt = N Lt − N Lt−1 ,
(2.7)
where N Lt = All Liabilities - All Assets (exluding reserve assets). Combining equations (2.4)-(2.7) we can write the trade balance as follows:
T Bt = ∆Rt − ∆N Lt − ITt ,
(2.8)
which represents the net income of the whole economy. 14
The financial account was formally called the capital account. I will use the two terms interchangeably. 15 ”The financial account records, by type of financial instrument, the changes in the financial assets and liabilities” (OECD (2001): Glossary of Statistical Terms. Source of Publication ESA 8.50-8.51 [III.2]. http://stats.oecd.org/glossary/detail.asp?ID=960). ”The financial account covers all transactions, including the creation and liquidation of financial claims, associated with change of ownership in international financial assets and liabilities” (Balance of Payments Sources and Methods, Central bank of New Zealand, 2004).
CHAPTER 2. EXTERNAL SHOCKS AND RESERVES ADEQUACY
41
It is important to note at this point that I do not model T B directly. Rather, I model every component (∆Rt , ∆N Lt , and ITt ) separately. The reason is that the trade balance in the data does not capture the dynamics of these components. Moreover, ∆Rt , ∆N Lt , and ITt seem to follow different processes. Most importantly, because modeling the trade balance directly without decomposition of its components to policy components and external shocks would not be helpful in assessing the different policies driving the trade balance. Next, I adopt the same decomposition used in section 2 to approximate the processes driving net liabilities, N Lt , and income transfers, ITt . That is,
ln(
N Lt ) = N¯L + α0 Xt + µt , Yt
(2.9)
ITt ¯ + γ 0 Xt + ξt , ) = IT Yt
(2.10)
and ln(
where µt and ξt are the residuals for net liabilities and income transfers, respectively, that are not captured by the observables. Because my focus is on reserves policy, I ¯ could be interpreted as policy targets or means, and I will assume that N¯L and IT take them as given when assessing the reserves policy. I use the same vector of observable variables discussed in the previous section (i.e., asst returns and oil variables) to identify shocks to the trade balance components, N Lt and ITt . Time series properties for N Lt and ITt over the sample period 1981:Q1 to 2006:Q4 are tested using ADF and PP tests. For the income transfers series, ITt , the ADF test rejects the null at all levels while the PP test rejects it at the 10 percent level only. For the net liabilities, N Lt , ADF test rejects the null at all levels while
CHAPTER 2. EXTERNAL SHOCKS AND RESERVES ADEQUACY
42
the PP test does not. For my purposes, I assume that these series are stationary and estimate models (2.9) and (2.10) by OLS, where Xt is defined by ∆LCOP , ∆LU SM CO, DIV, TBILL, LONG, and VWR.16 Estimation results are reported in Table 2.3. My findings suggest that , as can be seen in Columns 1 and 3, external shocks explain 81 percent of the variation in net liabilities and 53 percent of income transfers, respectively.
0
ln(NL/GDP)
−1
−2
−3
Actual Net Liability Position Fitted Net Liability Position
−4
−5 1981Q1
1994Q4
2006Q4
Figure 2.3: Contribution of Exogenous Shocks to Net Liabilities As Figures 2.3 and 2.4 show, the model replicates the movements in both processes.
16
I also consider the alternative approach of estimation here. That is, I assume N Lt and ITt are non-stationary series, do a cointegration analysis, and then estimate models (2.9) and (2.10) by dynamic OLS. The results are almost the same as those of the approach taken here.
CHAPTER 2. EXTERNAL SHOCKS AND RESERVES ADEQUACY
43
Table 2.3: Contribution of Shocks to Trade Balance Movements Variable Change of log: -Oil Price - U.S. M of Oil from Mexico Dividend yield Treasury Bill Yield on 10-year U.S. Bonds Value Weighted Returns Constant
Net Liabilities Shocks
Net Liabilities Shocks & Dummy
Income Transfers Shocks
Income Transfers Shocks & Dummy
.27 (.24) -.015 (.29) −2.64∗∗∗ (.63) -3.61 (2.76) −11.21∗∗∗ (3.71) .51 (.41) −1.44∗∗∗ (.03)
.10 (.19) -.15 (.24) -.50 (.59) −10.20∗∗∗ (2.41) -2.83 (3.21) .05 (.34) −1.75∗∗∗ (.05) .67∗∗∗ (.09) 103 .88 21.14 [0.000]
-.05 (.27) -.26 (.33) 1.29∗ (.71) .37 (3.14) 9.42∗∗ (4.22) .09 (.47) −4.82∗∗∗ (.04)
-.03 (.27) -.25 (.33) 1.00 (.83) 1.26 (3.40) 8.30∗ (4.53) .15 (.48) −4.78∗∗∗ (.07) -.09 (.13) 103 .53 4.87 [0.000]
Dummy NOBS ¯2 R Chow
103 .81 [0.000]
103 .53 [0.000]
Notes: (1) standard errors are given in parentheses. (2) 10%, 5% and 1% is referred to by ∗ , ∗∗ , and ∗∗∗ , respectively.
2.4
Assessing Foreign Reserves Policy
The notion of adequacy that I proposed above (i.e., condition (2.3)) suggests that the target level of the reserves-GDP ratio an economy can afford depends on future trade surplus (i.e., trade balance), which is a function of foreign reserves, net liabilities, and income transfers, which are, in turn, functions of the policies in place, as well as the exogenous shocks. This implies that, as the state of an economy evolves, expectation of future trade surpluses may change, too. Therefore, it is not meaningful to ask what level of the reserves-GNP ratio the economy can afford independently of the state of the global (and domestic) economy.
CHAPTER 2. EXTERNAL SHOCKS AND RESERVES ADEQUACY
ln(−IT/GDP)
−4
44
Actual Income Transfers Fitted Income Transfers
−5
−6
1981Q1
1994Q4 date
2006Q4
Figure 2.4: Contribution of Exogenous Shocks to Income Transfers Process
2.4.1
Assumptions for Valuation of Future Trade Balance Surpluses
Following Lloyd-Ellis and Zhu (2006), I assume that there is a complete world financial market in which all contingent claims with payoffs that are functions of the set of the exogenous shocks, zt , can be traded. Under this assumption and the assumption of noarbitrage, there exists a unique sequence of stochastic discount factors, {Mt }tº0 , such that the time t price of a contingent claim that pays q(zt ) units of the consumption good in period t + j is
·
¸ Mt+j P (t, j) = Et q(zt+j ) Mt
(2.11)
CHAPTER 2. EXTERNAL SHOCKS AND RESERVES ADEQUACY
45
Since Mexico is a small open economy, the stochastic discount factors are exogenous with respect to domestic agents’ actions. Given our specification for the trade balance in equation (2.8) and the processes driving it given by models (2.2), (2.9) and (2.10), if the central bank’s reserves policy continues to be Γt in the future , the country’s wealth can be expressed as ·X µ ¶¸ ∞ 1 g P V t (Λ|z) = Et Mt+j [Rt+j − Rt+j−1 ] − [N Lt+j − N Lt+j−1 ] − ITt+j , | {z } | {z } Mt j=1 ∆Rt+j
∆N Lt+j
(2.12) ¯ } is the current policy stance. Recall that Γ is the estimated where Λ = {Γ, N¯L, IT ¯ is average long-run reserves policy, N¯L is the average net liability position, and IT g income transfers position. P V t (.) is the present discounted value under a given policy stance. g To compute the market valuation, P V t (Λ|z), I need to specify a process for the stochastic discount factor, Mt , applied by the market in valuing future cash-flows. Moreover, since movements in the discount factor will also reflect global shocks, an important determinant of the present value is its covariance with the trade surpluses. I take “the market” to be a representative U.S. investor and assume that the “state of the world” is captured by the asset return indices and the oil variables discussed in the previous section. Specifically, I assume that the vector Xt = (X1,t , X2,t , X3,t , X4,t , X5,t , X6,t ) = (∆LCOPt , ∆LU SM COt , DIVt , T BILLt , LON Gt , V W Rt )
follows a vector autoregressive process
Xt = AXt−1 + ut
(2.13)
CHAPTER 2. EXTERNAL SHOCKS AND RESERVES ADEQUACY
46
where A is 6 × 6 matrix of parameters. ut is a 6 × 1 vector, where ut is i.i.d. and ut ∼ N (0, Σ). Table A.2 in appendix A provides the estimated process using quarterly ˆ and data from 1981:Q1 to 2006:Q4. The estimated parameters of the VAR model, A, ˆ are given by Table A.2 and the variance-covariance matrix of the error terms, Σ, matrix A.1 in appendix A, respectively.
2.4.2
Asset Pricing Model
To calibrate the model for the stochastic discount factor, I again use the approach of Lloyd-Ellis and Zhu (2001, 2006). Let rtT BILL be the interest rate on the 3-month Treasury bills, rtLON G be the yield on 10-year Treasury bonds, and Rm be the nominal return on the market portfolio. Then, the following no-arbitrage conditions should hold for any asset pricing model:
Et µ · 12
£ Mt+1 ¤ exp(rtT BILL ) = 1, Mt 
P20
LON G j=1 Mt+2j rt
Et
+ Mt+40 ¸
Mt Et
(2.14)
£ Mt+1 m ¤ R = 1. Mt t+1
= 1,
(2.15) (2.16)
where rtT BILL = E[rtT BILL ] + 14 X4,t , rtLON G = E[rtLON G ] + X5,t , and Rm = exp(X6,t ).
Since I use the stochastic discount factors to value cash-flows that are functions of Xt , it is important to model the covariance between the stochastic discount factors and Xt . Here, I adopt the following linear specification for the growth rate of the
CHAPTER 2. EXTERNAL SHOCKS AND RESERVES ADEQUACY
47
nominal stochastic discount factor:
−ln(
Mt ) = $ + b0 Xt−1 + ωt , Mt−1
(2.17)
where ωt is i.i.d., ωt ∼ N (0, σω2 ), and E[ωt ut ] = v. In my calculations, I focus on the following special case of this specification, which has been adopted by Lloyd-Ellis and Zhu (2006)17 :
−ln(
1 Mt T BILL ) = rt−1 + σω2 + ωt . Mt−1 2
(2.18)
T BILL By definition, X4,t−1 = 4(rt−1 − E[rtT BILL ]). So, the above equation is a special T BILL case of (2.17) with $ = E[rt−1 ] + 21 σω2 , and b0 = (0, 0, 0, 1/4, 0, 0). Under this
specification, the first moment condition (2.14) is always satisfied by construction. We further assume that ωt = ρ4 u4,t + ρ6 u6,t .
(2.19)
That is, the innovation in the stochastic discount factor is a linear combination of the innovation in the 3-month interest rate and the innovation in the return on market portfolio. Then, we have σω2 = ρ24 Σ4,4 + ρ26 Σ6,6 + 2ρ4 ρ6 Σ4,6 ,
(2.20)
v0 = (0, 0, 0, ρ4 , 0, ρ6 )0 Σ.
(2.21)
where Σ4,4 and Σ6,6 are the fourth and sixth elements of the diagonal of matrix Σ, and 17
Lloyd-Ellis and Zhu (2006) extend the term structure model discussed in Campbell and Viceira (1998) and Campbell, Lo and MacKinlay (1997) by allowing the innovation in the stochastic discount factor to be correlated with the innovations in the shock variables.
CHAPTER 2. EXTERNAL SHOCKS AND RESERVES ADEQUACY
48
refer to the variances of X4,t and X6,t , respectively. Σ4,6 is the covariance between X4,t and X6,t . The parameters ρ4 and ρ6 are calibrated so that the two moment conditions (2.15) and (2.16) hold.18 For more details on calibration and present value calculation, see the appendix A.
2.4.3
Historical Assessment of Sustainability
To assess the adequacy of the reserves policy adopted by Mexico during the period 1981:Q1 to 2006:Q4 I need to evaluate the sustainability condition (2.3) over that period. I use the asset pricing model specified above to determine the present value of g the trade balance (under the existing policy) at each date, P V t (T Bt ). The calculation is based on the estimates of models (2.2), (2.9), and (2.10). Finally, to be able to evaluate (2.3) at each date, I need to calibrate the critical value of the net asset position that triggers a crisis, φ. I use the Tequila crisis to calibrate φ. That is, φ is calibrated so that the sustainability condition (2.3) holds with equality in 1994:Q4. In other words, φ=
g R1994:4 P V 1994:4 (T B) N L1994:4 + − . Y1994:4 Y1994:4 Y1994:4
(2.22)
According to my simulations, φ = 0.23. Figure 2.5 illustrates the historical evolution of the reserves-GDP ratio plus my estimate of Mexico’s present value of trade surpluses as a percentage of GDP , under the current policy stance, in comparison with the liabilities-GDP ratio. As we can 18
The sample period considered for calibration in Lloyd-Ellis and Zhu (2006) is slightly different from the sample I consider for estimation; their model was calibrated for the period 1975:Q1 to 2003:Q4. Moreover, the asset pricing models considered were homoscedastic, which implies that both the term premium and the equity premium are constant over time. In the data, however, these premiums are time varying. Therefore, the calibrated parameters depend on the sample period. Nevertheless I use the parameters of Lloyd-Ellis and Zhu (2006) because their model covers all of the period I am considering (except 2004:Q1 to 2006:Q4).
CHAPTER 2. EXTERNAL SHOCKS AND RESERVES ADEQUACY
49
1.5
R Y
+ PYV
1
¾
φ
0.5
1981Q1
NL Y
1986Q1
1991Q1
1994Q4
2001Q1
2006Q4
Figure 2.5: Historical Assessment of Reserves Policy in Mexico. see, while the liabilities-GDP ratio increases throughout the period, the future income floats around a constant but at a higher level than the liabilities-GDP ratio. Note, however, that in the mid-1990s Mexico experienced a large increase in its liability position, and, at the same time, its net income experienced a significant drop, getting very close to the lower bound of the sustainability condition described by (2.3). This situation refers to the financial distress that Mexico experienced during the last quarter of 1994. It is my view that the Mexican economy reached un upper bound on its accumulated liabilities by the end of 1994, which is when my earlier estimates suggest a significant increase in the net liability position (Column 5 of Table 2.3). This is the
CHAPTER 2. EXTERNAL SHOCKS AND RESERVES ADEQUACY
50
point at which the net liability position reached a level that was considered unsustainable by outside investors. And, given the state of the world at that time and the existing reserves policy, the net incomes (discounted present value plus foreign reserves; LHS of (2.3)) dropped significantly. Thus, the perception of foreign investors of Mexico’s inability and unwillingness to fulfil its external obligations reached a high level at that time. This approach of assessing the adequacy of the reserves policy is much more meaningful than conventional rules of thumb, such as the Greenspan-Guidotti rule of full coverage of short-term debt, the ratio of 3 or 4 months of imports (e.g., Fisher (2001)), and the 5-to-20-percent rule of ratio of reserves to broad money (e.g., Calvo (1996)). These rules suggest, implicitly, that the central bank should adjust its reserve holdings whenever the lower bound (3 months of imports, short-term debt to GDP ratio of 1, and a ratio of M2 to reserves of 5 percent) is reached. In doing so, these rules do not account for the costs that the economy is subject to when adjusting its stock of reserves. These costs might be very high so that the adjustment undertaken, if any, might lead to unfavorable economic conditions. The approach taken here suggests that so long as condition (2.3) is satisfied the policymaker does not need to adjust its stock of reserves even if it reaches a lower bound of zero. What counts the most for the policymakers is the sustainability of the balance of payments, no matter how much reserves they hold. This means that policymaker avoid unnecessary costly adjustments when the stock of reserves reaches a lower bound (as the rules of thumb suggest). Moreover, each rule of thumb accounts for only one variable of the current account and addresses its efficiency independently of other aspects of the balance of
CHAPTER 2. EXTERNAL SHOCKS AND RESERVES ADEQUACY
51
payments, ignoring its correlation and interaction with other components of the balance of payments. Furthermore, these rules do not consider dynamics of the overall balance of payments. In contrast to these rules, the approach I propose considers all the components of the balance of payments, their correlation, and their dynamics. Indeed, the adequacy rule based on the notion of sustainable balance of payments provides a comprehensive framework for reserves policy evaluations.
2.4.4
Reserves Policy and Crisis Prediction
Since Mexico has historically satisfied its balance of payments sustainability condition, with 1994 being an exception, it is important to investigate whether or not the balance of payments will be sustainable in the future, given the current policy and the risk arising from global conditions. To this end, I simulate the likelihood of violating the sustainability condition defined by (2.3), under the current policy and given the shocks process defined by (2.13). The simulation exercise consists of generating data for all variables using initial conditions derived from the actual data (the starting date is 2006:Q4). I set the number of paths to 5000 and the number of (future) periods for every path to 100. For every path i and at each date t + j I calculte the LHS and RHS of the sustainability condition defined by (2.3) and check whether it is satisfied. i i i That is, I calculate (Rt+j + P Vt+j (T B) − N Lt+j ) and compare it with φYt+j . If the
condition is violated, the economy experiences a crisis at that date. Then, initial conditions are reset, and I do the same exercise along the next path (i + 1), and so on. Next, I average the number of times the condition is violated at a particular date t + j across all paths. This is the simulated probability of condition (2.3) being violated at date t + j.
CHAPTER 2. EXTERNAL SHOCKS AND RESERVES ADEQUACY
52
0.12
Probability of BOP crisis
0.1
0.08
0.06
0.04
0.02
2006:4
2011:4
2016:4
2021:4
2026:4
2031:4
Figure 2.6: Probability of crisis under the current reserves policy. Figure 2.6 illustrates the evolution over time of the simulated probability of violating the sustainability condition (2.3) for the first time. That is, the cumulative probability of a crisis. It is interesting to note that even though Mexico historically held sustainable balance of payments, except in 1994, there is a positive probability of crisis in the near future. However, this probability is very low suggesting that Mexican policy has being sustainable in recent years. Figure (2.5) supports this point as the gap between future incomes and the net liabilities position is quite large since the mid-1990s. But the fact that this probability increases over time means that policymakers might consider adjusting upward their target level of the reserves-GDP ratio in the future if they want to decrease the the likelihood of a crisis. Whether
CHAPTER 2. EXTERNAL SHOCKS AND RESERVES ADEQUACY
53
0.1
Probaility of BOP crisis
0.08
0.06
0.04
0.02
2006:4
2011:4
2016:4
2021:4
2026:4
2031:4
Figure 2.7: Probability of crisis if current target of Reserves-GDP ratio is doubled. the policymaker will do so (i.e. change reserves policy) depends on their preferences, whether or not they are planning to stay in power, the expected cost of crisis, and the pressure they get from outside agencies (e.g., IMF). This possibility of policy change leads to the natural question of how changes in the target level of the reserves-GDP ratio affect the probability of crisis. To address this question, I assume that policymakers double the (long-run) target level of the reserves-GDP ratio; then simulate the likelihood of a balance of payments crisis over time in the same way described above. As Figure 2.7 shows, by doubling
CHAPTER 2. EXTERNAL SHOCKS AND RESERVES ADEQUACY
54
the target level of the reserves-GDP ratio, the probability of a crisis is lower at all periods. However, more reserves do not eliminate the risk of a crisis completely as the probability of violating the sustainability condition is still positive, although reserve holdings have been doubled. Jeanne (2007) estimates the benefits of reserves accumulation (in terms of reduction in crisis probability) for a set of emerging market economies. He finds that, in 2000, Mexico could have reduced its estimated crisis probability from 9.6 percent to 5.6 percent by doubling its reserves. The big difference between Jeanne’s result and mine (the probability of a crisis decreases by almost 4 percentage points in Jeanne’s model) comes from the different approaches to reserves adequacy we consider. Indeed, Jeanne (2007) calculates the reduction in the probability of a crisis based on the Greenspan-Guidotti rule (i.e., ratio of reserves to short-term debt) while I calculate them based on the sustainability condition discussed above.
2.4.5
Adequacy Rule
This approach to assessing the adequacy of reserve holdings is much more meaningful than the rules of thumb discussed earlier. It is a flexible tool that can accommodate many aspects of the economy. In fact, the assessment of adequacy here accounts explicitly for the shocks affecting the world economy, their size and their probabilities. This method suggests that, given the domestic and global conditions, the stock of reserves policymakers choose depends on their preferences, described by the maximum probability they can tolerate, and by the time horizon they are concerned with. Figure 2.8 summarizes this approach. If policymaker adopt a reserves target that satisfies both the time horizon and the maximum probability that can be tolerated, then it is
CHAPTER 2. EXTERNAL SHOCKS AND RESERVES ADEQUACY
55
adequate.
0.12
Probability of BOP crisis
0.1
Max Prob. Fixed by Policymaker
0.08
0.06
Time Horizon
0.04
0.02
2006:4
2011:4
2016:4
2021:4
2026:4
2031:4
Figure 2.8: Adequacy Rule.
The advantage of this empirical method of assessing the adequacy of foreign reserves holding is its applicability. It is a practical tool that policymakers can consider. The rules of thumb outlined above are not based on modeling approaches, and they do not offer economic intuitions on why reserves should be at a particular level. Moreover, the existing literature on optimal reserve holdings still does not offer a common framework that central banks can adopt in considering what level of reserves to accumulate. Next chapter represents one step in this direction.
CHAPTER 2. EXTERNAL SHOCKS AND RESERVES ADEQUACY
2.5
56
Conclusion
Increasing financial and trade openness exposes emerging market economies to unavoidable shocks that are outside the control of the local authorities. As a result, many countries experienced liquidity problems and financial distress during the 1990s. The international finance literature has provided evidence suggesting that these countries opted for a new policy: increasing international reserve holdings as precautionary savings against future financial troubles. In this chapter, I have argued that external shocks (i.e., more favorable global conditions) were key determinants of the significant increase of foreign reserves accumulated by Mexico since the mid 1990s. My results suggest that there is no evidence of permanent policy adjustment in the aftermath of the Tequila crisis. I argue that many of the shocks to the Mexican reserves can be replicated using a linear combination of internationally traded asset returns and oil variables. In fact, it is possible to approximate the reserves accumulation process over the last three decades as a stationary function of these shocks. My results are consistent with the hypothesis that the rise in reserve holdings experienced by Mexico was the result of a series of positive shocks in the post-crisis period. The strong and stable correlation between international reserves and external shocks provides a basis for a flexible and simple method for evaluating current reserves policy. A reserves policy is adequate if the probability that the external finances become unsustainable over a given time horizon is sufficiently low. This method, however, does not address the optimal level of reserves. Indeed, as long as a target level of the reserves-GDP ratio is effective in fending off external shocks, a policymaker is satisfied with it. Any higher (or lower) ratio that fends off shocks would be satisfactory, too. In such a scenario, the policymaker might not be motivated to adjust
CHAPTER 2. EXTERNAL SHOCKS AND RESERVES ADEQUACY
57
the reserves policy, especially if adjustment costs are high. This, of course, results in forgone benefits due to excessive reserve holdings. Looking at reserve holdings from this perspective motivates the study of the optimal reserves that a country should hold. In the next chapter, I address this issue.
Chapter 3 A Simple Model of Optimal Reserves 3.1
Introduction
This chapter develops a novel but practical method of estimating a country’s optimal level of international reserves. The level of reserves a country should hold reflects a trade-off between the desire to control for the costs of balance of payments imbalances and the opportunity cost of holding reserves. I consider a simple benchmark policy rule that is consistent with official statements, which usually point to the need for building up international reserves in order to fend off external shocks. The framework used in this chapter builds on the results of the previous chapter. I assume that, under any target level of its reserves-GDP ratio, a country faces a risk of balance of payments crisis. Whenever the sum of current reserves and the present value of the economy’s expected future trade balance surpluses, under the current reserves policy, minus its net liabilities falls below a critical value of its asset position, the economy experiences 58
CHAPTER 3. A SIMPLE MODEL OF OPTIMAL RESERVES
59
a sudden stop and incurs the cost associated with it, in addition to the opportunity cost of holding reserves.1 If, under the current reserves policy, no crisis occurs, the economy only incurs the opportunity cost of holding reserves. Thus, the optimal target level of the reserves-GDP ratio reflects a trade-off between the opportunity costs of holding reserves and the sudden stop cost. After calibrating the sudden stop costs and the costs of holding reserves, I compute the present values of the expected total costs incurred under different target levels of the reserves-GDP ratio. The target value of the reserves-GDP ratio associated with the lowest expected discounted total cost is the optimum. After facing financial crises during the 1990s, many emerging market countries experienced rapidly rising international reserves relative to their GDP. This has raised interesting questions in the literature regarding the cost and benefits of reserve accumulation. The cost of holding reserves has been estimated by Rodrik (2006) at close to 1 percent of GDP annually for all developing countries.2 Against this argument, an explanation commonly advanced is that countries may have accumulated reserves as an insurance mechanism against the risk of an external crisis–self-protection through increased liquidity. Others view this development as the unintended consequence of large current account surpluses and suggest that the level of international reserves has become excessive in many of these countries.3 In addition to using the stock of reserves to cope with their liquidity problems, many emerging market economies hit by the 1990s’ financial crises received substantial support from the international financial community. For instance, in 1995, the United 1
In my framework, a balance of payments crisis results in a sudden stop of capital flows, so, I will be using the terms “balance of payments crisis” and “sudden stop” interchangeably. 2 Rodrik (2006) estimates the cost of reserves as the spread between the private sector’s cost of short-term borrowing abroad and the yield the Central Bank earns on its liquid foreign assets. 3 See, for example, Summers (2006).
CHAPTER 3. A SIMPLE MODEL OF OPTIMAL RESERVES
60
States committed up to $20 billion in repayable support, part of a nearly $50 billion international package to stem Mexico’s difficulties. In the following years, the IMF responded to the increased frequency and severity of financial crises by providing bailouts to Thailand, South Korea, Indonesia, Russia, Brazil, Turkey, and Argentina. This emergency aid, together with increasing financial and trade integrations, have created a conviction among many policymakers that rescue packages will be provided (V´asquez, 2002). Against this background, there has been surprisingly little work trying to quantify the level of reserves that can be rationalized in the presence of a bailout scenario like the one described above. Moreover, the existing literature does not explicitly address the contribution of external factors to the shaping of reserves policy in emerging economies. This chapter addresses the question of optimal reserves in the face of shocks experienced by emerging market countries and considers the possibility of external rescue plans and bailout options should a crisis hit. My model looks at the intertemporal optimization problem of a small open economy that accumulates international reserves at a cost to insure itself against the risk of a sudden stop associated with a fall in output. I consider this problem with and without the possibility of bailouts. The major purpose of my model is to bring the approach of reserves policy assessment discussed in the previous chapter into the consideration of optimal reserves determination. This implies that the new notion of sustainable balance of payments introduced there is the key element through which the expected total cost is evaluated. Note that, because the assessment of the sustainability condition was based on a numerical exercise, I solve for the optimal reserves numerically, too.
CHAPTER 3. A SIMPLE MODEL OF OPTIMAL RESERVES
61
Although my approach is new, I am not the first to discuss a numerical method to solve for optimal reserves. Aizenman and Marion (2003) and Miller and Zhang (2006) present two-period precautionary savings models of reserves. Caballero and Panageas (2005) and Durdu, Mendoza, and Terrones (2007) present more dynamic precautionary savings models of international reserves. These models do not yield closed-form solutions for the optimal level of reserves but can be solved numerically. One contribution of my analysis, however, is the introduction of a dynamic examination of the cost-benefit approach. Because of this focus, I estimate the optimal level of international reserves as a function of the discounted present value of the country’s trade surpluses flows. This implies that, as expectations about the country’s future income improve, the need for international reserves should be reduced. A second contribution of my analysis is the introduction of the policymakers’ perceptions of the possibility of a potential bailout into the derivation of the optimal reserves. The first step in my analysis is to estimate the current reserves policy on the basis of the model discussed in the previous chapter. Next, I discuss my approach to optimal reserves determination, which is in line with standard cost-benefit models but introduces a different constraint consisting of the sustainability condition discussed in the previous chapter. I then calibrate the model for Mexico, simulate the optimal reserves policy and compare the model’s predictions with my estimate of the current reserves policy. Subsequently, I allow the outside world to intervene, if it wants to, and rescue the distressed economy, and, I emphasize the implications for optimal reserves policy. One lesson from this exercise is that the optimal level of reserves is subject to considerable uncertainty because it is sensitive to certain parameters that are difficult to measure. The model nevertheless produces ranges of plausible
CHAPTER 3. A SIMPLE MODEL OF OPTIMAL RESERVES
62
simulated results against which the estimated policy can be compared. The model predicts an optimal target level of the reserves-GDP ratio on the order of 9 percent for Mexico, which is considerably higher than the (estimated) long-run target of the reserves-GDP ratio of 4.64 percent for the full sample period (1981:Q1 to 2006:Q4). This result raises the question of why Mexico holds lower reserves-toGDP ratio than it should, even though it went through a severe crisis in 1994. One possible explanation is the international aid package it got at the time of the crisis and its strong conviction that it will get a similar rescue package should a crisis hit. When I account for this scenario the current reserves policy is in the range of the model’s predictions. In fact, the bailout scenario produces an optimal level of the reserves-GDP ratio of 5 percent (close to the estimated long-run level). A brief review of the the main findings from the previous chapter that are needed to derive optimal reserves is presented in section 2. Section 3 develops a novel approach to optimal reserves determination. Discussion of the cost-benefit analysis is presented in section 4. Details of the calibration and simulation, as well as the results, are discussed in section 5, and section 6 concludes this chapter.
3.2
Reserves Process and Balance of Payments Sustainability
In the previous chapter I discussed a new approach to evaluating different target levels of the reserves-GDP ratios. That approach was based on a decomposition method that separates out movements in reserves process resulting from policy components from those exogenous to the policymaker. Model (2.2) summarizes the decomposition
CHAPTER 3. A SIMPLE MODEL OF OPTIMAL RESERVES
63
method. Two sets of shock variables that best fit the Mexican economic environment were discussed: internationally traded financial securities (VWR, DIV, TBILL, and LONG) and oil variables (LCOP and LUSMCO). After these variables were identified, I estimated the target level of the reserves-GDP ratio and the contribution of the exogenous shocks to the reserves process. Column 1 of Table 2.2 presents the results from an OLS estimation of model (2.2) over the period 1981:Q1-2006:Q4. The results illustrate the striking fact that 70 percent of the variation in the reserves can be replicated by a simple linear combination of these shocks. According to the model, the estimated long-run target level of the reserves-GDP ratio (i.e. policy component) is 4.64 percent. Then, I tested the argument, which is widely discussed in the literature, that claims that Mexico has adjusted its reserves policy in the aftermath of the Tequila crisis. To do so, I ran the same regression but included a dummy variable, which takes on the value of 1 in the post-crisis period and of zero before the crisis. Column 2 of Table 2.2 reports the results. As we can see, the coefficient on this dummy is statistically insignificant. Moreover, the model, suggests that Mexico did not change its reserves policy, even though it experienced a financial distress. This result implies that external shocks account for most of the variation in the reserves process. According to my interpretations there are at least two reasons that there was no significant change in Mexico’s reserves policy (as compared to other emerging market economies, who doubled and even tripled their reserves-GDP ratios). First, there is a cost of adjustment, which stems from the need to reduce expenditures relative to income so as to yield the desired balance of payments surplus that is necessary for the accumulation of reserves.4 Second, it is likely that the U.S. bailout of the Mexican 4
In principle the stock of reserves could be built up by international borrowing. However, during
CHAPTER 3. A SIMPLE MODEL OF OPTIMAL RESERVES
64
economy during the crisis gave the Mexican government less incentive to adopt a new reserves policy. Indeed, the U.S committed up to $20 billion in repayable support, part of a nearly $50 billion international package to stem Mexico’s difficulties. A few months after the support started, the stage was set for Mexican recovery. Mexico all but eliminated the short-term debt instruments that spawned the crisis. It seems that this rescue package from the international financial community and the high likelihood of similar international intervention may have discouraged Mexico from changing its international reserves policy.
3.2.1
Adequacy of Reserves Policy
The adequacy rule developed in Chapter Two was based on a new concept of balance of payments sustainability that allows the stock of reserves to influence the likelihood of balance of payments crises. If a continuation of the current reserves policy is going to require a drastic policy shift or lead to a crisis (unless bailed out), then it is not adequate. This approach provides a basis for a flexible and simple method of determining the implicit market assessment of a country’s external position and serves as an effective and practical tool to evaluate the adequacy of reserves policy. Condition (2.3) summarizes this new approach, and for convenience, I rewrite it here g Rt + P Vt (T Bt ) − N Lt ≥ φYt ,
(3.1)
where φ was calibrated to the 1994 Mexican financial crisis. Under a target value of the reserves-GDP ratio, if the above condition is violated, a period of financial distress, borrowing opportunities are limited and very costly; thus, by and large, adjustment requires a current account surplus.
CHAPTER 3. A SIMPLE MODEL OF OPTIMAL RESERVES
65
the country experiences a sudden stop of capital flows and incurs a social cost. In addition to the social cost of a crisis, there is an opportunity cost of holding reserves, which is associated with the entire stock of reserves, regardless of whether they are used to cope with the crisis.5 The evaluation of condition (3.1) requires, in addition to the process driving the reserves, a specification of the processes driving the net liabilities and the income transfers. Table 2.3 reports the estimates of the net liabilities and the income transfers. Furthermore, the evaluation of condition (3.1) depends on the calculation of the discounted present value of future trade trade balance surplus. Section 2.4 describes how I use the estimates of the impact of external shocks, in conjunction with a VAR model of the shock processes and a two-factor asset pricing model, to calculate the g discounted present value of the trade balance, P V (T Bt ).
3.3
Total Cost of Holding Reserves
In this section, I present a simple framework for a cost-benefit analysis of the optimal level of reserves to deal with the risk of sudden stops. For my purposes, I define “sudden stop” as a violation of condition (3.1). Reserves are useful both in terms of crisis prevention (reducing the likelihood of balance of payments crisis) and in terms of crisis mitigation (reducing the cost of a crisis, once it has occurred). However, this self-insurance comes at a price because of the opportunity cost of accumulating low-yield securities such as U.S. government bonds. I assume that the central bank chooses a target level of reserves-GDP ratio that 5
Standard models of optimal reserves assume that, when the crisis hits, reserves are exhausted (i.e., reach the lower bound of zero). Consequently, there is no opportunity cost of holding reserves at the time of a crisis in these models.
CHAPTER 3. A SIMPLE MODEL OF OPTIMAL RESERVES
66
minimizes the expected total costs of holding reserves. In accordance with standard procedure, I further assume that, at every period, these total costs, T Ct , consist of an opportunity cost of holding reserves (i.e. forgone earnings), OCt , plus a social cost of a sudden stop crisis (i.e., output loss), SCt , if crisis occurs; that is,
T Ct = χt SCt + OCt ,
(3.2)
where χt = 1 if crisis hits, and 0 otherwise.
3.3.1
The Social Cost of Sudden Stop
In Heller (1966) and Clark (1970), when the balance of payments experiences problems (i.e., reserves reach a lower bound), policymakers need to cut imports in order to restore the reserves. This cost is inversely related to the economy’s openness or import propensity. Ben-Bassat and Gottlied (1992) consider costs of a different nature–that is, the cost of default (or cost of reserve depletion) incurred by a borrowing country. A default on the external debt (which happens at the time of crisis) will disturb the orderly flow of raw materials imports, implying a negative output effect. Furthermore, the economy will also lose the possibility of consumption smoothing over time, by means of temporary debt accumulation. The more specialized the economy at the time of default, the stronger is the chain reaction caused by a shock such as a cut in the supply of inputs. Therefore, in Ben-Bassat and Gottlied’s (1992) model, the effect of openness on the cost of reserve depletion is positive, unlike in Heller (1966). In this chapter, I do not investigate the effect of the degree of openness on the magnitude of the cost incurred if a balance of payments crisis hits. Rather, like Jeanne and Ranci`ere (2006), I assume that, when a crisis hits, output falls by a
CHAPTER 3. A SIMPLE MODEL OF OPTIMAL RESERVES
67
constant fraction, γ, below its long-run growth path.6 However, unlike Jeanne and Ranci`ere (2006), who assume that there is only one sudden stop, I allow for multiple sudden stops. Each time a crisis hits, the economy incurs a cost equivalent to a fraction γ of its output, and, in the subsequent period, the economy (whether bailed out or not) faces a new risk of crisis. I then write
SCt = γYt ,
(3.3)
where γ < 1.
3.3.2
The Opportunity Cost of Reserve Holdings
Holding low-yield reserves presents an opportunity cost to the country. This opportunity cost, OCt , has been widely discussed in the literature on optimal reserves. It depends on the level of reserves, and on the difference between the economy’s marginal productivity of capital and the interest rate on reserves. The opportunity cost can then be written as OCt = ∆rt Rt ,
(3.4)
where ∆rt represents the difference between the economy’s marginal productivity of capital and the interest rate on (low-yield) reserves. It could be time-varying and may change in response to the debt level, global conditions, and political events. For simplicity, and in line with many studies, I consider that ∆rt is constant and use ∆r instead. 6
Jeanne and Ranci`ere (2006) model sudden stop as a debt rollover crisis associated with a fall in output. When the sudden stop occurs, two things happen: the representative consumer is unable to roll over her external debt, and output falls below its long-run growth path by a fraction.
CHAPTER 3. A SIMPLE MODEL OF OPTIMAL RESERVES
68
Edwards (1985) argues that the relevant opportunity cost for the borrowing country can be measured by the spread between the interest rate on the debt and the reserves. Ben-Bassat and Gottlied (1992) define the opportunity cost as the difference between the rate of return on capital, calculated as the ratio of profits to gross capital stock, and the yield on reserves, calculated as the average of real interest on short-term deposits in dollars and marks. Barnichon (2008) calculates the opportunity cost as the difference between nominal interest rates and low-yield securities such as U.S. government bonds.
3.3.3
The Expected Total Cost
The objective of the policymaker is to choose a target level of the reserves-GDP ratio that minimizes the expected total cost (under that target). Substituting conditions (3.3) and (3.4) into (3.2), the optimization problem is given by
min Et R
∞ X Mt+j j=1
Mt
T Ct+j
(3.5)
subject to condition (3.1).
If a solution exists, it can be written as ¡ ¢ R∗ = R Yt , Xt , γ, P V (.), ∆r, φ .
(3.6)
However, It is not possible to solve for equation (3.6) analytically. The method I consider here is based on the assessment of the sustainability condition (3.1) for multiple hypothetical policy rules. For every possible policy rule (i.e. target level
CHAPTER 3. A SIMPLE MODEL OF OPTIMAL RESERVES
69
of the reserves-GDP ratio), I evaluate the sustainability condition (3.1) using the estimated parameters of models (2.2), (2.9), and (2.10) (summarized in Table 2.3), and the calculated present discounted value of the trade balance, defined by equation (2.12). It is important to recall that a given policy rule is defined by the (exponential of the) constant term of model (2.2). This means that, in my evaluation of the sustainability condition (3.1), both the reserves process and future trade surpluses will be affected by the change of the policy rule, which is captured by the constant term of model (2.2). Under a given reserves policy, in every period the total cost of holding reserves is calculated based on the outcome of the evaluation of condition (3.1) and the calibrated parameters γ, ∆r, and φ. If condition (3.1) is violated, then the economy incurs both the social cost, SCt , and the opportunity cost, OCt . If condition (3.1) is satisfied, only the opportunity cost, OCt , is incurred. The expected total cost for a target value of the reserves-GDP ratio is the simulated present discounted value of total costs. The target value of the reserves-GDP ratio associated with the lowest expected total cost is the optimal reserves policy, and it is equivalent to the solution R∗ defined by equation (3.6). As discussed above, my approach consists of solving for R∗ numerically. To do so, I simulate the economy, under a candidate policy rule, using Monte Carlo techniques; evaluate condition (3.1); and calculate the expected total costs associated with the outcome of the evaluation of condition (3.1).
3.3.4
Present Discounted Value of Total Costs
I set the number of paths, N , to 1000 and the number of periods, T , to 300. For every path, i, and at each date, t + j, I evaluate condition (3.1), given the current
CHAPTER 3. A SIMPLE MODEL OF OPTIMAL RESERVES
70
target level of the reserves-GDP ratio and the risk coming from global conditions. i i If it is violated, then the economy incurs a social cost SCt+j = γYt+j at that date i (i.e., χit+j = 1). If condition (3.1) is satisfied, then SCt+j = 0. Next, whether the
economy is bailed out (by receiving rescue package) or not, I evaluate condition (3.1) for all the subsequent dates (i.e., t + j + 1, t + j + 2, t + j + 3,..., T ) along the same path, i. If condition (3.1) is violated again, then the social cost applies again; if not, no social cost is incurred, and so on. I do the same calculation at all dates for all paths until I investigate the social cost at date T of path N . Note that at every i . date, t + j, and along every path, i, the economy incurs the opportunity cost, OCt+j
After calculating and discounting the total costs at all dates along every path, I add them up to get the expected total cost of every path. In other words, the expected total cost of path i is calculated as the sum of the total costs at dates 1 through T, T
discounted with the sequence of discount factors, {Mt }0 , discussed in the precious chapter. I then average the expected total costs of all paths, i = 1, 2, ..., N , in order to find the discounted total cost under a given policy rule. The following equation summarizes the procedure: ˆ = EV C(R)
N T ¤ 1 X 1 X i £ i i i Mt+j χ+j SCt+j + OCt+j i N i=1 Mt j=1
(3.7)
ˆ is the present discounted value of the total costs incurred if the target where EV C(R) i ˆ in the future. Mt+j is the stochastic value of the reserves-GDP ratio continues to be R
discount factor between dates (t + j) and (t + j − 1). χit+j is an indicator function that takes the value of 1 if condition (3.1) is violated at date t + j and 0 otherwise.
CHAPTER 3. A SIMPLE MODEL OF OPTIMAL RESERVES
3.4 3.4.1
71
Estimation of Optimal Reserves Benchmark Calibration
For the social cost of sudden stop, I use the calibration of Jeanne and Ranci`ere (2006). They look for sudden stops in a set of 34 middle-income countries between 1975 and 2003.7 The output cost of a sudden stop is estimated by looking at the average difference between the GDP growth rate in normal years and the growth rate in sudden stop years. Jeanne and Ranci`ere (2006) find that the growth rate in a sudden stop year falls by 4.5 percent on average relative to a normal year and falls by 2.2 percent in the year following the sudden stop year. Thus, in their model γ is set to 6.5 percent per year.8 In my model, because I am using quarterly data, γ is set to 1.63 percent. As far as the measurement of the opportunity cost of holding liquid international reserves is concerned, much depends on the form in which these reserves are held. Heller (1966) discusses reserves composition in developing and developed countries. He argues that less developed countries seem to have a tendency to hold a larger proportion of their reserves in the form of interest-yielding dollar or sterling balances, 7
They identify a sudden stop in year t if the ratio of capital inflows to GDP falls by more than 5 percent of GDP relative to the previous year. See Table 1 of their paper for the countries they consider and the years in which they had a sudden stop. 8 To see how γ is calculated, let ∆g be the change in the growth rate g. According to Jeanne and Ranci`ere’s (2006) model, ∆g = −4.5% in the first year following the sudden stop and ∆g = −2.2% in the second year following the sudden stop. Thus, the overall change in the growth rate is ∆g = −6.7%. The output drop is then γ = 1 − e−∆g = 1 − e−0.067 = 6.48%. This is consistent with the output cost of currency crises as estimated, for example, by Ranci`ere Tornell, and Westermann (2003).
CHAPTER 3. A SIMPLE MODEL OF OPTIMAL RESERVES
72
while the more developed countries tend to hold a larger fraction in the form of noninterest-yielding assets, such as gold or foreign-demand deposits. He concludes that the opportunity cost of holding reserves should be roughly equal for most countries, and he makes, in his own words the “heroic assumption” that the opportunity cost of holding liquid international reserves is 5 percent. Barnichon (2008) calibrates the opportunity cost at 4 percent. Jeanne (2007), using data for all Latin American countries, calibrated the opportunity cost of holding reserves at 6.5 percent.9 For my purposes, I set the opportunity cost of holding reserves at 5 percent per year. The quarterly opportunity cost is then 1.25 percent.
3.4.2
Optimal Reserves
As outlined above, the expected total costs of reserve policies are calculated by adding the simulated values of GDP foregone in case of crisis, SC, to the opportunity cost of holding reserves, OC. The optimal reserves policy corresponds to the level of the reserves-GDP ratio associated with the lowest expected total cost. In Chapter One, I discussed some historical arrangements that Mexico had when it was hit by the Tequila crisis. One renowned (and very controversial) example is the $50 billion international aid package, including the $20 billion U.S. bailout. The bailout certainly helped the Mexican economy to recover quickly, but that came, as the opponents of the bailout claim, at high costs–namely in the form of moral hazard–to the world economy.10 More importantly, policymakers in Mexico have not seriously considered market-oriented alternatives to official bailouts. For my 9
His benchmark calibration for all emerging market economies is 3 percent. See, for example, Chari and Kehoe (1998), and Hoskins and Coons (1995) for a discussion of the consequences of the international intervention, especially that of the IMF, during the financial crises of the 1990s. 10
CHAPTER 3. A SIMPLE MODEL OF OPTIMAL RESERVES
73
purposes, I consider this issue further and emphasize whether the bailout in Mexico in the aftermath of the Tequila crisis might have affected its optimal reserves policy. In what follows, I investigate the optimal reserves determination under two scenarios: (i) no bailout, then (ii) bailout. Note that, with the 1995 bailout, Mexico all but eliminated the short-term debt instruments that spawned the crisis. So, when I consider the bailout scenario, I assume that the money (or, more generally, the aid) received was used to pay external liabilities. This means that, in my simulation of the bailout scenario, the mean (or the target) of net liabilities to GDP ratio is reduced each time condition (3.1) is violated. In other words, the estimated constant term in model (2.9) needs to be reduced following a crisis, in order to reflect the bailout in my simulations. 3.4.2.1
No Bailout
In determining the optimal target level of the reserves-GDP ratio without bailout, I use the long-run level of net liabilities to GDP reported in Table 2.3 (i.e. 23.7 percent). I consider a grid of 20 points, in which each point corresponds to a candidate policy rule. The grid starts at the lowest possible value, zero, and ends at 20 percent, a less likely scenario given the current target). Figure 3.1 illustrates how the expected total cost varies with the target level of the reserves-GDP ratio in the absence of bailouts.
According to my simulation results, the optimal reserves-GDP ratio for Mexico is 9 percent. This is considerably higher than the estimated long-run target level of the reserves-GDP ratio of 4.64 percent over the whole sample period (1981:Q12006:Q4), and the adjusted target level of 4.46 percent in the post-crisis period
CHAPTER 3. A SIMPLE MODEL OF OPTIMAL RESERVES
74
4
Expected Total Cost ($1000)
7.8
x 10
7.7
7.6
7.5
7.4 0
5% 10% 15% Target Level of the Reserves−GDP Ratio
20%
Figure 3.1: Optimal Reserves Without Bailout.
(1995:Q1-2006:Q4). Note that the estimated rate of 4.64 percent represents only 51.6 percent of the calculated optimal reserves policy, while the post-crisis rate represents only 49.6 percent of the calculated optimum. This suggests that the current reserves policy in Mexico is sub-optimal. In other words, the current reserves policy fells short of optimal policy by almost 50 percent. This result represents a key contribution to the literature on optimal reserves in Mexico because no other study, to my knowledge, concluded that Mexico holds reserves less than it should.
CHAPTER 3. A SIMPLE MODEL OF OPTIMAL RESERVES
75
Ben-Bassat and Gottlieb (1992), studying the case of Israel over the period 196488, find that, while optimal and actual reserves are highly correlated, optimal reserves instead fell short of actual reserves by an average of 6 percent. Kim (2008) presents a model that builds upon the global games framework of Morris and Shin to establish a unique relationship between the probability of a sudden stop and the level of reserves. He calibrates his model to 15 emerging market countries, including Mexico, over the sample period of 1993-2006. Over the full sample period, calibrated optimal reserves average between 10 and 30 percent of GDP for most countries in the sample. As for Mexico, Kim (2008) finds an optimal level of the reserves-GDP ratio of 9.1 percent, which is the same as my estimate, over his full sample (1993-2006), and 12.2 percent over the period 1993-99. Jeanne (2007) develops a simple welfare-based model of the optimal level of reserves to deal with the risk of capital account crises or of sudden stops in capital flows. His benchmark calibration, the probability of a sudden stop of 10 percent, implies an optimal level of reserves of 7.7 percent of GDP (or 77 percent of short-term external debt). He argues that this is close to the ratio of reserves to GDP observed in the data on average over 1980-2000, but significantly below the level that has been observed in the most recent period, especially in Asia. Jeanne’s (2007) model also finds that, the optimal level of reserves is zero if the probability of crisis falls below 5 percent, but it almost doubles, from 7.7 percent to 13.3 percent of GDP, if the probability of crisis increases from 10 to 20 percent. Jeanne concludes that the levels of reserves observed in many countries, particularly in Latin America, in the recent years are within the range of his model’s predictions.
CHAPTER 3. A SIMPLE MODEL OF OPTIMAL RESERVES
3.4.2.2
76
Bailout
To address the effect of a bailout in Mexico on optimal reserves policy, I calibrate the bailout Mexico gets every time it experiences a sudden stop to 40 percent of its net liability position. This calibration is based on the 1994 experience. As discussed previously, after the Tequila crisis, Mexico received a $50 billion international aid package, which represents about 40 percent of its net liabilities position (i.e., $128 billion) at the time of crisis. Within 7 months, Mexico managed to decrease its overall liabilities, and, in particular, eliminated the short-term debt instruments that spawned the crisis. This means that Mexico has used the funds mainly to reduce its liabilities. Based on this experience, I make the assumption that 40 percent of the Mexican net liability position will be bailed out every time a crisis hits. Figure 3.2 illustrates how the expected total cost varies with the target level of the reserves-GDP ratio under the bailout scenario. As we can see, the bailout scenario resulted in a lower target level of the reservesGDP ratio. In fact, the optimal target level of the reserves-GDP ratio is now 5 percent, a decrease of 4 percentage points with respect to the no bailout case. Note that this level is very close to the estimated long-run target of 4.64 percent over the whole sample period as well as the the estimated adjusted long-run level of 4.46 percent. This result implies, that when accounting for the possibility of bailout, current reserves policy in Mexico is within the model’s predictions. This, however, is not an unexpected result. Mexico realizes that it is an important partner of the U.S. and the world economy in general, and that the international community will not let it down in case of a crisis.11 Moreover, the strong conviction of policymakers in 11
Mexico is the third-largest export market for U.S. products, and hundreds of thousands of American jobs depend on trade with Mexico. See Summers and D’Amato (1996) for a discussion of
CHAPTER 3. A SIMPLE MODEL OF OPTIMAL RESERVES
77
5
1.4
x 10
Expected Total Cost ($1000)
1.3
1.2
1.1
1
0.9
0.8
5% 10% 15% Target Level of the Reserves−GDP Ratio
20%
Figure 3.2: Optimal Reserves With Bailout
Mexico (based on the 1982 and 1995 experiences) that their economy will be rescued should a crisis hit gave them reason to consider bailouts in their optimization problem. Accounting for this bailout scenario, the current reserves policy is within my model’s predictions. Thus, the reserves policy in Mexico is not sub-optimal as it was in the no bailout scenario. This approach to investigating the quantitative impact of a bailout on optimal the economic and social costs to the U.S. economy in the aftermath of the Tequila crisis.
CHAPTER 3. A SIMPLE MODEL OF OPTIMAL RESERVES
78
reserves policy is, to my knowledge, a new contribution to the optimal reserves literature. In fact, the current literature excludes bailout scenarios in addressing optimal reserves determination. Given the recent developments in international financial architecture, in particular the new role played by the IMF, as well as the emergence of new regional institutions such as the Chiang Mai Initiative or the Latin American Reserve Fund, the bailout scenario seems to be even more likely to occur. An interesting and implicitly related work is worth mentioning here. Dhasmana and Drummond (2008) look at the optimal level of reserves in sub-Saharan African countries in light of the shocks faced by these nations. Using a two-good endowment economy model facing terms of trade and aid shocks, which might be interpreted as bailout shocks, they find that the optimal level of reserves in these economies is equal to 11 to 12 percent of total output. They also find that there were a few countries whose reserve levels were significantly below the optimal level. 3.4.2.3
Sensitivity of Optimal Reserves to Changes in Parameters
Figure 3.3 shows the sensitivity of the optimal target level of the reserves-GDP ratio to an increase in the social cost of a sudden stop crisis. As we can see, the optimal level of reserves is quite sensitive to welfare cost (output loss) resulting from a sudden stop. An increase in the social cost (i.e., an increase in γ) from 6.5 percent (benchmark model, Figure 3.1) to 10 percent results in a new optimal level of reserves of 11 percent, an increase of 2 percentage points. Not surprisingly, this exercise suggests that a higher cost of crisis would motivate policymakers to insure themselves even more by accumulating more reserves. Figure 3.4 shows that the optimal level of the reserves-GDP ratio is also very sensitive to a change in the opportunity cost of holding reserves. In fact, a decrease
CHAPTER 3. A SIMPLE MODEL OF OPTIMAL RESERVES
79
5
1.7
x 10
Expected Total Cost ($1000)
1.6
1.4
1.2
1
4% 8% 12% 16% Target Level of the Reserves−GDP Ratio
20%
Figure 3.3: Sensitivity of Optimal Reserves to Change in Social Cost.
of the opportunity cost (i.e., ∆r ↓) from 5 percent to 3 percent increases the optimal level of reserves to 15 percent. This is not an unexpected result either, since a decrease in the opportunity cost is equivalent to small forgone earnings related to a higher stock of reserves. So, it is less costly to accumulate reserves, which implies that it is optimal to accumulate more reserves.
CHAPTER 3. A SIMPLE MODEL OF OPTIMAL RESERVES
80
4
Expected Total Cost ($1000)
9
x 10
8.5
8
7.5
7
6.5
6
5%
10%
15%
20%
25%
30%
Target Level of the Reserves−GDP Ratio Figure 3.4: Sensitivity of Optimal Reserves to Change in Opportunity Cost.
3.5
Conclusion
The model developed in this chapter has several advantages compared to other studies in the literature on optimal reserves. Most importantly, the model explicitly links the optimal level of reserves not only to local policy rules, such as the current target levels of the reserves-GDP ratios and the net liability position, but also to the notion of sustainable balance of payments, which is, in turn, linked to global factors such as U.S. interest rates and oil prices. A key contribution of my framework is that the model
CHAPTER 3. A SIMPLE MODEL OF OPTIMAL RESERVES
81
accounts for emergency lending by multilateral institutions that the country may seek in order to defend itself against sudden stops. Incorporating these alternative defense measures into the model tends to lower the level of optimal reserves. As a consequence, my estimates of the no-bailout scenario should be viewed as an upper bound on optimal reserves. The calibration results are broadly consistent with two key facts: (i) current reserves policy is below the predicted optimal level, reflecting, most likely, Mexico’s perceptions of a potential bailout in the case of crisis, and (ii) considering a target level of 4.64 percent, which is close to the present average level of the reserves-GDP in developed economies, suggests that, although Mexico is highly exposed to external shocks, its fundamentals have improved substantially.12 If this is the case, Mexico might be better insured in recent years than it was in the 1990s. A common result in the international reserves literature suggests that emerging market countries (including Mexico) holdings of international reserves as a means of dealing with capital flow volatility and the risk of capital account crisis are more than can be justified by this objective. But the evidence from my model suggests that Mexico holds less international reserves than can be justified. This raises an important question: what factors might account for the gap between the model’s predictions and the observed actual hoarding of reserves? One plausible explanation is the Mexican government’s strong conviction that it will be bailed out should a crisis hit. Another explanation (which is related to the previous one) is that the emergence of collective insurance–such as that provided by the IMF at the global level or the Latin American Reserve Fund at the regional level– gave less incentives to Mexico to 12
According to Alfaro and Kanczuk (2008), in 2006, reserves accumulation amounted to 20 percent of GDP in low- and middle-income countries, whereas this number was close to 5 percent in highincome countries.
CHAPTER 3. A SIMPLE MODEL OF OPTIMAL RESERVES
undertake costly adjustment policies in order to increase its reserve holdings.
82
Chapter 4 Learning, Risk Taking, and Sudden Stops 4.1
Introduction
Emerging markets can find themselves suddenly cut off from international capital markets. For example, in 1994, Mexico experienced a reduction in net private capital flows equivalent to almost 4 percent of its GDP followed by a further drop of more than 5 percent in 1995. Output dropped 6 percent in the crisis year, and the economy was plunged into a systemic banking crisis until 1997. Korea and Indonesia, and other emerging Asian markets, faced a similar situation in late 1997, when they were unable to obtain desperately needed private foreign financing. These episodes of financial distress have become known as sudden stops.1 These are typically treated as exogenous events with sharp falls in output and employment. This chapter seeks to 1
According to Calvo (1998), the expression sudden stop was inspired by a bankers adage that it is not speed that kills, it is the sudden stop.
83
CHAPTER 4. LEARNING, RISK TAKING, AND SUDDEN STOPS
84
develop a theory of sudden stops which explains the existence and nature of financial crises without imposing exogenous restrictions. As noted by Arellano and Mendoza (2002), sudden stops are seriously at odds with the majority of existing models of current account determination, which rely on perfect capital markets. This failure of the existing theory has led to extensive research seeking to build models that can deliver predictions consistent with the sudden stop phenomenon.2 The present chapter proposes to complement the literature by introducing a trade-off between costly learning and risk-taking, and examines its impact on international capital market decisions and outcomes. This chapter enriches the description of the financial crisis in a way that makes it considerably easier to motivate endogenous sudden stops. In fact, a sudden stop in the present work forms a necessary solution to the moral hazard problem in investment. In my economy a representative borrower (i.e., a domestic entrepreneur) has a project which lasts for two periods and requires a fixed amount of capital.3 There is only one foreign bank who can finance the project. Two informational problems overlap in this model: an adverse selection problem followed by aggregate uncertainty. Adverse selection is the result of an alternative investment opportunity that might be available to the borrower after the first period loan is secured, encouraging her to misbehave. After the investment decision in the first period is made, a large unexpected shock might hit: a bad shock to the investment destroys the capital stock and hence discourages international lenders from continuing to finance the project. The information structure in this economy creates the possibility of collapse in credit 2
For an extensive survey of these models see the November, 1996 and June, 2000 symposia issues of the Journal of International Economics, or the NBER volumes edited by Edwards (2000), Krugman (2000) and Frankel and Edwards (2002). 3 The borrower could be the goverment
CHAPTER 4. LEARNING, RISK TAKING, AND SUDDEN STOPS
85
markets. In this environment, I investigate the existence of separating and pooling equilibria and characterize the optimal contract. One major result of my model is that sudden stops can be rationalized as part of an optimal lending strategy in the face of asymmetric information. The optimal contract that I derive suggests that the project will continue in the second period if and only if the first period’s observed investment is positive. The intuition behind this result is that, by threatening to terminate funding if a borrowing country’s performance is poor, international lenders can mitigate incentive problems. This strategy, however, implies that there is an ex post inefficiency: the project is discontinued (i.e., sudden stop) when first-period observed investment is 0 even if expected profit is positive and it is efficient to continue the relationship. Since first period investment is null, the size of the overall debt burden increases significantly, and no repayment scheme would make the continuation of the relationship attractive to the lender. This result is consistent with previous empirical findings (see Rodrik and Velasco (1999), for example). Moreover, the model generates a share of long-term debt smaller than the share of short-term debt in the overall loan. This debt maturity structure matches the documented fact that the share of short-term debt in the overall debt is higher in emerging markets. The framework I develop in this chapter explores three key features of the 1990s emerging economies financial crises. First, many observers pointed to the growing ratios of short-term liabilities relative to long-term liabilities as a fundamental source of financial distress.4 I argue that, while there is theoretical and empirical evidence supporting this view, even long-term loans will not prevent the crisis from occurring 4
See, for instance, Sachs Tornell, and Velasco (1996b) for Mexico, Chang and Velasco (1998a) and Radelet and Sachs (1998) for East Asia. Others, such as Corsetti, Pesenti and Roubini(1999) have emphasized fundamental economic imbalances as the main source of fragility in East Asia.
CHAPTER 4. LEARNING, RISK TAKING, AND SUDDEN STOPS
86
in the presence of asymmetric information, and this finding contradicts the traditional view of a large part of the literature.5 Second, in addressing the East Asian crises, Pomerleano (1999) points out that the high profitability of investment in the East Asian economies led to financial excesses that violated prudent financial practices, and eventually led to inevitable financial distress. In fact, the average Return on Equity performance during 1992-96 in these economies6 was outstanding, reaching 12.7 percent. In addition, the high level of Tobin’s q confirms that investment opportunities were high. Moreover, projected growth of 6 percent per year for developing countries (IMF) compared to 2.5 percent for industrialized nations can explain the capital inflows to emerging markets. These findings offer a plausible explanation why international investors target emerging market economies even though a lack of market discipline and asymmetric information characterize the economic environment in these markets. Finally, because information acquisition is costly and “depreciates” quickly, international lenders have less incentive to pay for fixed country-specific information. Calvo and Mendoza (2000) show that, in the presence of informational frictions, financial globalization may have reduced the incentive to pay fixed country-specific information costs. As a result, the expected-utility gain of paying information costs declines. When they calibrate their model to asset-return projections based on costly information (proxied by country credit rating) and the variance-covariance matrix of emerging markets returns, they find that, as the number of emerging markets rises from 2 to 20, the utility gain of paying for country-specific information falls from 60 percent to 10 percent in terms of the mean portfolio return. Hence, international 5
See also, Cole and Kehoe (1996), Furman and Stiglitz (1998), Obstfeld (1998), Eichengreen and Hausmann (1999), and Feldstein (1999). 6 Hong Kong, Indonesia, Malaysia, Philippines, Taiwan, Thailand, and Korea.
CHAPTER 4. LEARNING, RISK TAKING, AND SUDDEN STOPS
87
lenders might not be willing to pay the costs needed to verify the state of the world, and the equilibrium outcome would be the same as the equilibrium outcome of an environment characterized by information frictions (like those in this model). The above features (short-term lending, financial excesses, and information acquisition) are likely to be correlated, and each of them seems to have direct implications for the recently documented episodes of emerging markets crises. For example, the fact that information about economic fundamentals is costly to acquire would lead lenders not to pay for it. Aware of the lenders’ strategy of not buying information, borrowers in developing countries may be tempted to violate prudent financial practices and probably devote loans to different purposes (or simply divert or consume them). Knowing that borrowers might behave this way could lead lenders to prefer short-term contracts. My work builds on contributions by Bolton and Scharfstein (1990) and Stiglitz and Weiss (1983). Both studies have argued that the termination threat is an effective incentive device. Their analyses, however, differ from mine in three ways: (1) The contracts they investigate do not consider learning; and the first-period capital they consider is a exogenous constant amount while it is an endogenous continuous amount of resources in my model. (2) The contracts that Stiglitz and Weiss (1983) consider are not optimal while the contract I have designed is. Bolton and Scharfstein (1990) consider an optimal contract, but their incentive problem concerns observability of profit while returns are instead observable in my model. (3) Apart from the focus on termination threats as an incentive compatible device in credit and labour market contracts, none of these studies investigate similar issues in the international capital markets context. My approach here is an application of this framework to an
CHAPTER 4. LEARNING, RISK TAKING, AND SUDDEN STOPS
88
international capital market. The remainder of the chapter is organized as follows. Section 2 describes the economic environment. Section 3 defines potential candidate equilibria and discusses conditions necessary for their existence. Section 4 characterizes the optimal contract, and section 5 discusses the results. Finally, concluding remarks are given in section 6.
4.2
The Environment
Consider a small country inhabited by a single representative agent, domestic entrepreneur or borrower. The domestic entrepreneur, has a project that lasts for two periods (three-date model: t = 0, t = 1, and t = 2) and offers stochastic returns. The project requires K units in capital and produces output only on date 2. The domestic entrepreneur starts with zero wealth7 and thus requires a lender to finance her investment. There is only one foreign bank that can finance the project. Both the borrower and the lender are risk neutral (so both are uninterested in consumption smoothing), and the utility for both depends on last-period consumption, which imply that everyone acts to maximize expected final payoff. Both borrower and lender discount flows using the same subjective discount rate, β > 0. Although K is fixed, the bank can divide the required amount into two installments over the two periods; the first installment represents a long-term loan, and the second installment represents a short-term loan. So, the project could be financed with long-term debt or a mix of short-term and long-term debt. If it consists of 7
Whereas domestic loans are generally supported by substantial collateral, the assets that can be appropriated in the event of a sovereign’s default are generally negligible. For this reason one must look beyond collateral to find incentives for repayment.
CHAPTER 4. LEARNING, RISK TAKING, AND SUDDEN STOPS
89
long-term financing, then the bank provides K at t = 0 and collects repayment at t = 2. If financing includes both short-term and long-term debt, then the long-term debt consists of the first installment, a fraction, σK, where 0 ≤ σ ≤ 1, of the required capital provided at t = 0 and to be paid back at t = 2. The short-term debt consists of the remaining fraction of required capital input, (1 − σ)K provided at t = 1 and to be paid back at t = 2.8 Note here that an increase of long-term debt (i.e., σ high) results in a decrease of short-term debt (i.e., (1 − σ) drops) and vice versa. In other words, the relative size of short- versus long-term debt is determined by the value of σ. If undertaken and completed, the project yields verifiable income y > 0. If an ˜ < K is invested over the two periods, then y = 0. The assumption that amount K y is verifiable simplifies the analysis. To keep the analysis tractable, I consider that the production function is linear in capital, that is
y = AK,
(4.1)
where A > 1 is a productivity parameter. Further, I assume that there is no uncertainty in the second period; that is, if the entrepreneur invests in period 2, she will be able to generate output and repay the lender. In the first period, once the loan is secured (i.e., after first period transfer, σK, has been made), nature assigns an alternative investment opportunity to the borrower. After observing this opportunity, the entrepreneur might use (i.e., divert) 8 Note that first period capital input might be zero or K. If it is zero, then the second period capital input must be equal to K for the project to be productive.
CHAPTER 4. LEARNING, RISK TAKING, AND SUDDEN STOPS
90
all the provided funds to the new investment opportunity; that is, she may misbehave. The alternative investment opportunity consists of a constant returns-to-scale ¯ is a investment technology that returns R per unit invested per period. R ∈ {0, R} random return on the alternative investment opportunity, drawn by nature and observed by the borrower only. If the entrepreneur does not invest and diverts the funds granted to her, the bank cannot expect any repayment. In this respect, my model is somewhat orthogonal to the incomplete financial contracts literature, where it is assumed that the output is not verifiable or is only partially so, regardless of whether ¯ > A. So, because of the the entrepreneur invests. In addition, I assume that R risk neutrality assumption, the entrepreneur uses the whole amount received in the ¯ Thus, misbehaving alternative investment opportunity if the choice of nature is R. ¯ per unit results in zero output, y = 0, with probability one and a private benefit of R invested. Alternatively, the entrepreneur invests the borrowed funds in the project if R = 0. In addition to the adverse selection problem, first-period investment, if any, is subject to an exogenous shock, ² ∈ {0, 1}. The prior probability that ² = 0 is µ; that is, P r(² = 0) = µ.9 Thus, if K units of capital are invested over the two periods, returns of the project are
y=
0
with probability µ
AK with probability 1 − µ.
This means that investing σK in the first period does not necessarily result in 9
² in this setup could take various forms: investment-specific technology shock in the intermediate good sector, productivity shock, non-concluding R&D activities, weather-induced shocks, etc. Or, it could just be a “mistake” by workers.
CHAPTER 4. LEARNING, RISK TAKING, AND SUDDEN STOPS
91
a good outcome. Let I = ²σK denote first period observed investment. If ² equals 0, first period investment, I, would be 0, too, and the domestic entrepreneur needs to borrow K units of capital in the second period for the project to be successful. Behaving in the second period (i.e., in first period R = 0) yields a positive output y = AK with probability one and no return from the alternative investment opportunity to the domestic entrepreneur. Throughout the chapter, a “good” borrower, or an (R = 0)-type, refers to an ¯ entrepreneur who is assigned R = 0 by nature, while a “bad” borrower, or an (R = R)¯ by nature. The lender knows only the type, is an entrepreneur who is assigned R = R distribution of R. Let ρ0 denote the initial prior that the borrower is of the good type; that is, P r(R = 0) = ρ0 (i.e., the prior about the borrower being a bad type is 1 − ρ0 ). After realization of the random variables (² and R), and conditional on the outcome of events, the lender updates his prior with the newly arrived information (observed investment, I). Therefore, updating of beliefs, ρ1 , is the result of a mapping from the public information to the unit interval. I model this mapping, or learning process, as Bayesian updating based on the public information available to the lender. Thus, learning proceeds as follows:
ρ1 = P r(R = 0|ρ0 , I) =
P r(ρ0 , I|R = 0) P r(R = 0). P r(ρ0 , I)
(4.2)
where P r(R = 0|ρ0 , I) is probability that R = 0 conditional on observing I = 0, and given the prior ρ0 . Two kinds of inefficiencies might take place. The first one refers to a situation in which investment has been undertaken; that is, the borrower did invest σK, but a “bad” shock, ² = 0, hit the investment. The result is then actual (or observed)
CHAPTER 4. LEARNING, RISK TAKING, AND SUDDEN STOPS
92
investment of zero (I = 0), and the bank may stop funding the borrower when she should not. The second inefficiency arises when the bank decides to continue financing the project on the basis of a “wrong” belief that the borrower is (R = 0)-type. As a result, additional funding will be provided to the borrower, who is going to use it in the alternative investment opportunity and not in the project. This scenario means that the bank loses its money and “rewards” the entrepreneur when it should not.10 Note that the non-observability of the investment decision is a standard scenario. Projects often require specific human capital or the design of blueprints for machinery, buildings or logistics. Or an entrepreneur may spend a great deal of time reading and designing. The bank is unlikely to observe whether the efforts are directed towards the project or whether blueprints are competently drafted. For simplicity, I assume that the cost of verifying cash flow is zero if the entrepreneur has invested the capital.
4.2.1
Contracting
I assume that at t = 0 the foreign bank makes a take-it-or-leave-it offer to the entrepreneur. The offer consists of a contract with the following terms: cash flows from the lender to the borrower at t = 0 and t = 1, suspension policies, and repayment schedule at t = 2. These terms can be contingent on all information available. Note that the entrepreneur accepts the offer if the contract provides non-negative expected value. A lending contract specifies an initial loan size, σ, (a fraction of K) at t = 0; a 10
This result may not be inefficient. The social surplus is the sum of the lender’s and the borrower’s ¯ and since R ¯ > A, then it is socially efficient to divert the second period funds. payoffs. If R = R,
CHAPTER 4. LEARNING, RISK TAKING, AND SUDDEN STOPS
93
repayment schedule (at t = 2) conditional on I: Z if I > 0 repayment = Z0 if I = 0;
(4.3)
and the probabilities that the bank offers a second-period financing (beginning at t = 1). Both the repayment schedule and the probabilities are conditional on first period investment. These probabilities are defined in the spirit of Bolton and Scharfstein (1990) and Stiglitz and Weiss (1983). That is, let x1 ∈ [0, 1] be the probability that the foreign bank gives the domestic entrepreneur funds at date t = 1 to continue the project (production stage) if the observed first period investment is positive (i.e. σK), and let x2 ∈ [0, 1] be the probability that the foreign bank terminates the relationship if the observed first period investment is 0. Note that it is easy to show that x1 = 1;11 thus, to ease the notation, I set x1 = 1 and x2 = x. The choice of these variables determines future borrowing and the ability and willingness to repay. The model I develop here is a self-selection model like those of Rothschild and Stiglitz (1976) or Stiglitz and Weiss (1981). However, my model has three additional complications. First, the information frictions are such that the entrepreneur cannot be forced to invest. Second, non-investing entrepreneurs cannot be separated from investing entrepreneurs in the selection process; hence, standard sorting devices, such as collateral (Bester (1985) and Bester (1987)), cannot be used to separate a bad entrepreneur from a good one. Third, I allow for arbitrary “high” probability of the entrepreneur being of a good type (i.e., ρ0 is high). Targeting such a good type 11
If I > 0, it must be that the borrower is (R = 0) type with return being positive, y > 0, at t = 2.
CHAPTER 4. LEARNING, RISK TAKING, AND SUDDEN STOPS
94
by a foreign bank creates more moral hazard and leads to the additional inefficiencies. These three complications lead to a perfect Bayesian equilibrium in which the bank does not continue lending to the borrower if first-period observed investment is sufficiently low (I = 0). The bank can be involved in this relationship either for one period or for two periods. It is involved for two periods if it continues financing the project in the second period. In this case, if first-period observed investment is positive, (i.e., if I = σK), then the bank provides (1 − σ)K in the second period. If I = 0, the bank provides K units of the capital good. Alternatively, the bank may be involved for only the first period if it believes that the borrower misbehaved. In such a case, the contracting relationship is terminated. While a one-period relationship implies the end of the contract, continuation gives rise to a second moral hazard problem. In fact, once the second-period funding is available, the borrower again has to decide whether to behave or to misbehave.
4.2.2
Timing
The timing of events in this environment is represented by Figure 4.1. First, the bank decides whether to fund the project. If so, it provides σK ≤ K. Second, after ¯ Third, the domestic entrepreneur the transfer is made, nature chooses R ∈ {0, R}. decides to behave or to misbehave. Then, the investment shock, ², hits. Prior to its second-period decision, the bank observes the investment level, I ∈ {0, σK}, updates its beliefs about R, and then decides whether to continue funding or terminate the relationship. If it decides to continue, it provides second-period funding (1 − σ)K or K; then the borrower decides whether to behave or not. If she behaves, output y is
CHAPTER 4. LEARNING, RISK TAKING, AND SUDDEN STOPS
Lender offers
Investment is
σK
∈ {0, σK}
0≤σ≤1
95
Bank observes I ∈ {0, σK} then offers
{0, (1 − σ)K, K} y = AK t=2
t=1
t=0 Nature chooses
Shock hits
Borrower invests
¯ R ∈ {0, R}
² ∈ {0, 1}
{0, (1 − σ)K, K}
Figure 4.1: Timing. realized, and the borrower pays back the lender at the end of the second period.
4.3
Bayesian Strategies and Bayesian Equilibria
In this section, I discuss two potential equilibrium candidates, separating and pooling, and analyze under what conditions these equilibria might exist. In each case, given σ and Z, I propose an equilibrium loan contract (strategies for the bank and the entrepreneur as well as the outcome) and discuss the necessary conditions for that equilibrium to hold. Note that from the bank’s point of view, two informational
CHAPTER 4. LEARNING, RISK TAKING, AND SUDDEN STOPS
96
problems overlap in this model. In the absence of a perfect signal, the bank will only rely on its updated belief to make its second-period decision to stop or continue. At t = 2, the bank’s beliefs that the borrower behaved given that I = 0 (i.e., ρ1 = P r(R = 0|I = 0)) are given by
ρ1 =
µρ0 . 1 − ρ0 + µρ0
(4.4)
Note that ρ1 < ρ0
4.3.1
Separating Equilibrium
At t = 0, the lender offers a first installment, σK. If I = 0 after one period, the lender does not offer a second installment. If I = σK > 0, the lender makes a second installment of (1 − σ)K. The borrower accepts the contract. If R = 0, the borrower invests the first installment in the project. If ² = 1, she invests the second installment. ¯ she does not invest the first installment. Under what conditions is this If R = R, an equilibrium? To answer this question, I solve for the equilibrium using backward induction. In the second period (i.e., at t = 1), if I = σK, lender’s expected repayment is βZ. The bank will make the second installment (1 − σ)K if and only if
βZ ≥ (1 − σ)K.
(4.5)
CHAPTER 4. LEARNING, RISK TAKING, AND SUDDEN STOPS
97
This scenario effectively treats the first installment as sunk. The payoff to the (R = 0)type in this case will be β[AK − Z] and she will continue as long as
AK ≥ Z
(4.6)
Condition (4.6) also represents the limited liability constraint.12 If I = 0, the bank’s expected repayment is ρ1 βZ0 , and it will lend K if
ρ1 βZ0 ≥ K
(4.7)
The expected payoff to (R = 0)-type borrower is β[AK − Z0 ], and she will continue if and only if AK ≥ Z0 .
(4.8)
¯ the borCondition (4.8) stands for the limited liability constraint, too. (If R = R, ¯ rower misbehaves and gets a payoff RK).
Lemma 1: For the equilibrium to be as described above, it must be the case that 1 − ρ0 + µρ0 1 = > A. βρ1 βµρ0
(4.9)
Lemma 1 implies that there is no repayment Z0 that an (R = 0)-type borrower could make that the bank will find profitable. Under this condition, if I = 0, the bank stops lending. ¯ ¯ − σ)K, and she will accept the second-period Note that (R = R)-type’s payoff in period 2 is R(1 funding with no constraint since she will not pay at t = 2 anyway. Note that this possibility is off the equilibrium path. 12
CHAPTER 4. LEARNING, RISK TAKING, AND SUDDEN STOPS
98
In the first period (i.e., at t = 0), the expected repayment in this equilibrium is
βρ0 (1 − µ)[βZ − (1 − σ)K].
It follows that the bank will make the first installment if and only if
βρ0 (1 − µ)[βZ − (1 − σ)K] ≥ σK
(4.10)
¤ 1£ σ + (1 − σ) K. β βρ0 (1 − µ)
(4.11)
or, Z≥
Note that if condition (4.11) holds condition (4.5) must hold. The expected payoff to a (R = 0)-type borrower in this equilibrium is β 2 (1 − µ)[AK − Z],
and so she will enter the relationship as long as condition (4.6) holds. The expected ¯ ¯ payoff to an (R = R)-type borrower in this equilibrium is RσK. For the equilibrium ¯ to be separating , the (R = R)-type should not have an incentive to mimic the other type by investing the first installment just to get the second installment. A sufficient condition for no mimicking is ¯ ¯ − σ)K RσK ≥ β(1 − µ)R(1
σ≥
β(1 − µ) = σ. 1 + β(1 − µ)
(4.12)
So, the first installment must be sufficiently large. Overall, the restrictions on σ and
CHAPTER 4. LEARNING, RISK TAKING, AND SUDDEN STOPS
99
Z for this equilibrium to exist are given by conditions (4.6), (4.9), (4.11), and (4.12). Combining conditions (4.6) and (4.11), for there to exist a Z that is consistent with this equilibrium, σ must satisfy
σ≤
βρ0 (1 − µ)(βA − 1) =σ ¯. 1 − βρ0 (1 − µ)
(4.13)
Conditions (4.12) and (4.13) impose upper and lower bounds on σ: if σ is too low (i.e., smaller than σ), mimicking will occur, and no information will be derived from the initial loan. If σ is too high (i.e., bigger than σ ¯ ), the bank exposes her self to much risk, and no mutually beneficial contract exists. Note finally that condition (4.9) implies
βA − 1
0, it makes a second installment of (1 − σ)K. The borrower accepts the contract and invests the first installment in the project for any R. If ² = 1, she invests the second installment if and only if R = 0. First, note that in this candidate for pooling equilibrium, there is no updating of beliefs. That is, ρ0 = ρ1
(4.15)
In the second period, if I = σK, the bank’s expected payoff is ρ0 βZ, and it will offer the second installment if and only if
ρ0 βZ ≥ (1 − σ)K.
(4.16)
If R = 0, the expected payoff to the borrower is β[AK − Z], and she will continue ¯ the borrower gives up her period-one if and only if condition (4.6) holds. If R = R, investment (i.e., the project is discontinued) and misbehaves (i.e., uses the additional funding she gets in the alternative investment opportunity). In this case, her expected ¯ payoff is (1 − σ)K R. If I = 0, bank’s expected repayment is ρ0 βZ0 , and it will lend K to restart the project if ρ0 βZ0 ≥ K.
(4.17)
The borrower will continue in the second period if R = 0 and as long as condition ¯ and additional funds are provided in the second period, the (4.8) holds. If R = R
CHAPTER 4. LEARNING, RISK TAKING, AND SUDDEN STOPS
101
¯ > A and her payoff would be borrower would divert them since (by assumption) R ¯ > 0. This possibility is off the equilibrium path. RK
Lemma 2: For the equilibrium to be as described above, it must be the case that 1 > A. βρ0
(4.18)
That is, there is no repayment scheme Z0 that an (R = 0)-type borrower could make that the bank would find profitable. Under this condition, if I = 0, the bank stops lending. In the first period, the expected repayment in this equilibrium (i.e., where condition (4.18) holds) is · ¸ £ ¤ £ ¤ β(1 − µ) ρ0 βZ − (1 − σ)K − (1 − ρ0 ) (1 − σ)K .
It follows that the bank will make the first installment if and only if £ ¤ β(1 − µ) ρ0 βZ − (1 − σ)K ≥ σK
or,
· ¸ 1 σ Z≥ + (1 − σ) K. ρ0 β β(1 − µ)
(4.19)
Note that if condition (4.19) holds condition (4.16) must hold. The expected payoff to (R = 0)-type borrower in this equilibrium is β 2 (1−µ)[AK− Z], so she will enter the relationship as long as condition (4.6) holds. The expected ¯ ¯ − σ)K. payoff to (R = R)-type borrower in this equilibrium is β(1 − µ)R(1
CHAPTER 4. LEARNING, RISK TAKING, AND SUDDEN STOPS
102
¯ For this to be a pooling equilibrium, the (R = R)-type prefers to mimic the other type by investing the first installment just to get the second installment. A sufficient condition for mimicking is ¯ ¯ − σ)K RσK ≤ β(1 − µ)R(1
or, σ≤
β(1 − µ) . 1 + β(1 − µ)
(4.20)
Overall, the restrictions on σ and Z for this equilibrium to exist are given by conditions (4.6), (4.18), (4.19), and (4.20). However, for there to exist a Z that is consistent with this equilibrium, σ (by combining conditions (4.6) and (4.19)) must satisfy
σ
0, implying that this pooling equilibrium cannot exist. The following proposition summarizes these findings.
¯ PROPOSITION 2: There is no pooling equilibrium such that the (R = R)-type borrower mimics the (R = 0)-type in the first period.
CHAPTER 4. LEARNING, RISK TAKING, AND SUDDEN STOPS
4.4
103
Optimal Contract
In the previous section I derived the conditions necessary for the existence of a separating equilibrium contract. These conditions include lower and upper bounds on σ, a lower bound on Z and condition to rule out any payment scheme involving Z0 . In this section, I narrow my analysis and investigate the most efficient combination of all these variables. In other words, I focus on finding the optimal contract that maximizes the bank’s expected payoff, subject to the borrower’s incentive and participation constraints.
4.4.1
Equilibrium Contract
The optimal contract maximizes the expected payoff of the foreign bank, subject to the following constraints: (i) incentive compatibility (hereafter IC): the (R = 0)-type ¯ invests at dates 0 and 1, and (R = R)-type misbehaves at dates 0 and 1; (ii) limited liability: the contract does not violate limited liability; (iii) individual rationality: the entrepreneur opts to sign the contract at date 0. Formally, the problem is the following: ½ µ ¶ ¾ ¡ ¢ max β ρ0 (1 − µ)[βZ − (1 − σ)K] + xµ[βρ1 Z0 − K] − (1 − ρ0 ) σK + xK − σK
{σ,Z,Z0 ,x}
s.t (4.6), (4.8), and ½ ¯ ≥ β (1 − µ)(1 − σ)K R ¯ + µxK R ¯ σK R
¾ (4.23)
½ µ ¶ ¾ ¡ ¢ ¯ ¯ β ρ0 β (1 − µ)[AK − Z] + xµ[AK − Z0 ] + (1 − ρ0 ) σK R + xβK R ≥ 0 (4.24)
CHAPTER 4. LEARNING, RISK TAKING, AND SUDDEN STOPS
104
where x is the the probability that the bank terminates the relationship if the observed first-period investment is 0. To make the contract incentive compatible, the lender designs the contract so that ¯ the (R = R)-type does not mimic the (R = 0)-type. Formally, I analyze the contractdesign problem as a direct revelation game, in which the terms of the contract are based on the entrepreneur’s report of her alternative investment opportunity. The ¯ the domestic entrepreneur (bad incentive constraint (4.23) ensures that when R = R type) does not mimic the good type in the first period. By investing in the first ¯ period (mimicking), the (R = R)-type receives nothing at the end of the period, and she may not be able to raise funds in the second period (with probability 1 − x) since a negative shock may hit (with probability µ). By setting the probability of not terminating the relationship when first period investment is zero, x, very small the foreign bank makes it costly for the domestic entrepreneur to mimic since she receives ¯ in the first period if she does not mimic. positive payoff σK R Note that I have omitted the incentive-compatibility constraint ensuring that the (R = 0)-type invests. Since an (R = 0)-type has no alternative investment opportunities, she has no option but to invest in the project. Obviously, that participation constraint is automatically fulfilled since the entrepreneur does not risk losing anything by participating in the game. Moreover, the limited-liability constraints (4.6) and (4.8) imply that the individual-rationality constraint (4.24) is not binding. The following lemma simplifies the analysis of the optimal contract. See appendix B for the way in which this lemma simplifies the maximization problem.
Lemma 3 : The incentive compatibility constraint (4.23) is binding at an optimum.
CHAPTER 4. LEARNING, RISK TAKING, AND SUDDEN STOPS
105
Lemma 3 is a typical feature of contracting problems. Using Lemma 3 and solving the binding IC constraint (4.23) for σ, we get
σ=
β[1 − (1 − x)µ] . 1 + β(1 − µ)
(4.25)
By substituting (4.25) into the bank’s objective function, the maximization problem simplifies to ½ · max β ρ0 (1 − µ)[βZ −
Z,Z0 ,x
1 β(1 − µ) K] − (1 − ρ0 )[ ]K 1 + β(1 − µ) 1 + β(1 − µ)
¸
¸¾ · β(1 − µ) K + h(K, Z0 , β, µ, ρ0 )x − 1 + β(1 − µ) subject to conditions (4.6) and (4.8) where ¢ ½ ¡ ¾ µ 1 − ρ0 (1 − µ)β + (1 − ρ0 )(1 + β) h(K, Z0 , β, µ, ρ0 ) = β K − ρ0 µ[βρ1 Z0 − K] . 1 + β(1 − µ) Note that h(K, Z0 , β, µ, ρ0 ) ≥ 0 if and only if
Z0 ≤ f (ρ, µ)K
(4.26)
where
f (ρ, µ) =
µ[1 − ρ0 β(1 − µ)] + (1 − ρ0 )(1 + β) + ρ0 µ[1 + β(1 − µ)] . ρ0 µβ[1 + β(1 − µ)]ρ1
(4.27)
CHAPTER 4. LEARNING, RISK TAKING, AND SUDDEN STOPS
106
Recall that by the limited liability constraint (4.8), we have AK ≥ Z0 . So, we need to compare A and f (ρ, µ), and, if it turns out that f (ρ, µ) ≥ A, then condition (4.26) is satisfied (because Z0 ≤ AK ≤ f (ρ, µ)K). In appendix B, I show that f (ρ, µ) ≥ A. Consequently, condition (4.26) is satisfied, which implies that h(Z0 , K, β, µ, ρ0 ) ≥ 0. It follows immediately from the maximization problem that x = 0, and the objective function simplifies to ½ · max β ρ0 (1 − µ)[βZ − Z
1 β(1 − µ) K] − (1 − ρ0 )[ ]K 1 + β(1 − µ) 1 + β(1 − µ)
β(1 − µ) K − 1 + β(1 − µ)
¸
¾
Since the bank’s payoff is linear in Z, it follows that Z ∗ = AK = y. Note that using Lemma 3 together with the result x = 0, and solving the IC, (4.23), constraint for σ, we get σ∗ =
β(1 − µ) . 1 + β(1 − µ)
(4.28)
It is important to mention that σ ∗ satisfies both condition (4.12) and (4.13). More interestingly, σ ∗ = σ, which means that the lender provides the minimum amount of capital necessary in the first period to induce separation. In sum, the optimal contract can be represented as: {x1 , x2 , σ, Z} = {1, 0, σ ∗ , y}. That is, in the first period, the foreign bank provides a fraction of capital equal to σ ∗ which is smaller than half. After observing the first period’s outcome, the bank will provide additional funding if and only if investment is positive, i.e. x1 = 1 and x2 = 0.
CHAPTER 4. LEARNING, RISK TAKING, AND SUDDEN STOPS
107
At the end of period 2, the entrepreneur pays back the loan, and this repayment is y. Finally, I must determine the conditions under which the bank earns non-negative profit. Given the optimal contract, the bank’s expected profits are ·
¸ 1 β(1 − µ) β(1 − µ) β ρ0 (1 − µ)[βAK − K] − (1 − ρ0 )[ ]K − K. 1 + β(1 − µ) 1 + β(1 − µ) 1 + β(1 − µ) (4.29) Thus, for the bank to finance the project at date 0, the prior, ρ0 , should satisfy 1+β ¢ = ρ0 . ρ0 ≥ ¡ β 1 + A[1 + β(1 − µ)] − 1
(4.30)
As a result, some positive net present value projects may not be funded.
I summarize these results in the following proposition.
PROPOSITION 3: The foreign bank lends at date t = 0, if and only if ρ0 ≥ ρ0 . In this case, it offers σ ∗ =
β(1−µ) 1+β(1−µ)
in the first period; sets the probabilities of additional
funding in the second period to x1 = 1 if I > 0, and x2 = 0 if I = 0; and requires a repayment of Z ∗ = y.
4.4.2
Comparative Statics
Having characterized the equilibrium contracts in the presence of information frictions, I now perform two types of comparative statics exercises, with respect to the breakpoint between short- and long-term loans, σ ∗ , and the bank’s participation condition defined by (4.30) (i.e. nonnegative profit). The proofs are simple consequences of the characterization of the the optimal contract (differential of σ ∗ and ρ with
CHAPTER 4. LEARNING, RISK TAKING, AND SUDDEN STOPS
108
respect to the parameters of the model) and are therefore omitted. 4.4.2.1
Debt Maturity
Changes in the discount rate. Corollary 1. The equilibrium share of long-term loan is an increasing and concave function of the discount rate. That is, ∂σ ∗ 1−µ = >0 ∂β [1 + β(1 − µ)]2
and
∂ 2σ∗ −2(1 − µ) = < 0. 2 ∂β [1 + β(1 − µ)]3
(4.31)
A decrease in the short-term interest rate (i.e., an increase of β) motivates more longterm lending (i.e., an increase of σ ∗ ) since short-term lending is less attractive to the bank. This implies that the bank will be better off if it finances the project with a long-term loan only. However, because of the information frictions and the risk associated with them, the bank cannot finance the project by long-term debt alone. The concavity property emphasizes this fact. This result is further confirmed by the fact that, as we saw in condition (4.28), σ ∗ < 0.5 for all µ ∈ [0, 1]; that is, the longterm debt is smaller than the short-term debt. This finding matches the stylized fact that the share of short-term debt in the overall debt is higher in emerging markets. Changes in the distribution of the aggregate uncertainty. Corollary 2. The equilibrium share of long-term loan is a decreasing and concave function of the aggregate uncertainty. That is, −β ∂σ ∗ = 0.
(4.33)
The reasoning behind this result is that as the interest rate decreases (i.e., increases β), loans are more affordable. And, because the optimal contract induces separation, only good types of borrowers are attracted. The lower bound on the prior that the 13
See appendix B for the expression of
∂2ρ 0 ∂β 2
CHAPTER 4. LEARNING, RISK TAKING, AND SUDDEN STOPS
110
bank requires, ρ, decreases, and consequently, more projects with positive net present value are funded. It is important to note here that, while the change in the discount rate decreases the prior, it has (as discussed in Corollary 1) increased long-term lending (↑ σ). Changes in the productivity. Corollary 4. The foreign bank’s participation condition is decreasing and convex in the project productivity. That is, £ ¤ £ ¤2 ∂ 2 ρ0 −β(1 − β) 1 + β(1 − µ) 2(1 + β)β 2 1 + β(1 − µ) = £ ¡ = £ ¡ ¢ ¤2 < 0 and ¢ ¤3 > 0. ∂A ∂A2 β 1 + β(1 − µ) − 1 β 1 + β(1 − µ) − 1 (4.34)
∂ρ0
As we can see, changes in the productivity parameter have implications similar to those of changes in the discount rate. Changes in the distribution of aggregate uncertainty. Corollary 5. The foreign bank’s participation condition is increasing and convex in the distribution of the aggregate uncertainty. That is,
∂ρ ∂2ρ β 2 A(1 + β) 2β 2 A(1 + β)β 2 A =£ ¡ > 0 and =£ ¡ ¢ ¤ ¢ ¤3 > 0. 2 2 ∂µ ∂µ β 1 + A[1 + β(1 − µ)] − 1 β 1 + A[1 + β(1 − µ)] − 1 (4.35)
4.5
Sudden Stop
Proposition 3 implies that there is an ex post inefficiency; the project is discontinued when first-period observed investment is 0, even if βA > K and it is profitable to operate. This scenario implies that, in this model, the size or the overall debt burden
CHAPTER 4. LEARNING, RISK TAKING, AND SUDDEN STOPS
111
is an important determinant of the financial distress a country might experience. In fact, the model shows that when first period investment is zero, there is no repayment scheme Z0 that makes the continuation of the relationship attractive to the bank. This result is consistent with previous empirical work. Rodrik and Velasco (1999), for example, find that crisis probabilities are increasing in the overall debt burden (measured by the debt-GDP ratio). This ex post inefficiency implies also that, because of the information frictions, a good borrower is not able distinguish himself from a bad borrower, leading to a termination of the contracting relationship.
4.5.1
Sudden Stop and Debt Maturity
As noted earlier, σ in this model represents the amount of long-term debt, and (1 −σ) represents short-term debt. So, a decrease in σ implies an increase of the short-term (and a decrease of long-term) debt. The existing literature on financial crises suggests that short-term borrowing was a causal factor in episodes of sudden stops. Rodrik and Velasco (1999), for example, find that longer term borrowing is associated with a lower probability of crisis. One interpretation of Rodrik and Velasco’s result is that the medium- and long-term debt stock is correlated with omitted country attributes that increase creditworthiness and reduce the risk of crises. My results show that, even with long term debt (i.e., σ > 0), emerging market economies are vulnerable to crises. This finding is similar to Calvo (1998)’s model, which shows that capitalmarket crises could take place even if most capital inflows take the form of foreign direct investment. It is important to note that the external debt structure derived in this economy, characterized by information frictions, might not be different from the debt structure
CHAPTER 4. LEARNING, RISK TAKING, AND SUDDEN STOPS
112
of an economy characterized by deeper financial markets. In fact, as economies get richer and financial markets become deeper (through financial liberalization, lower monitoring costs, good information environment, etc.), the external debt structure gets tilted towards short-term liabilities, a view widely supported in the literature. One reason for this shift is that countries that go on a borrowing binge are forced to shorten the maturity of their external liabilities in the short run. My model shows that, with limited information, the debt structure is very similar as the information asymmetries tilt external debt towards a smaller share of long-term loans (i.e., σ small). This result implies that short-term debt is not necessarily a feature of financial markets with lack of information. The fact that σ ∗ does not depend on ρ0 supports this view.
4.5.2
What is International about All That?
The above discussion could have been carried out in terms of a contracting relationship between any two agents in the economy/country. Once identified, each agent–lender or borrower– would have a well-defined set of variables, so the same narrative would apply with only minor presentation changes. However, although the threat of contractual termination occurs in a national context, there are important international characteristics that would be absent. As a general rule 1. Domestic lenders, as opposed to international lenders, are most likely able to learn about the exogenous shocks that may hit the investment and then infer easily the alternative investment opportunities available to the borrower. In particular, domestic lenders might be willing to verify the state of the world at lower cost than international lenders; for example domestic lenders can pay
CHAPTER 4. LEARNING, RISK TAKING, AND SUDDEN STOPS
113
monitor costs. Thus, in a way, domestic lenders are more able to achieve firstbest contract. 2. For legal and institutional reasons, capital mobility across countries is markedly more responsive to cyclical fluctuations than the mobility within a country; thus, expected international transfers (loans and/or payments) are more reflective of more international capital market conditions than local capital market conditions. Point 1 implies that “country risks” are bound to include more non-natural factors (e.g., non-prudent financial practices) than “domestic risks.” Assessing non-natural risks could be more costly in crisis-stricken economies because the financial and political institutions in many of them (e.g., Mexico, Korea, Indonesia) are in a state of flux and, in some cases (e.g., Argentina), because they have a relatively young economic system. As shown in Calvo and Mendoza (1997), high risk-assessment costs make herding more likely. This means that, if an international lender withdraws from the country, it will be very difficult for the domestic entrepreneur to find another to replace it. Moreover, in this context, the probability of herding is even higher if credit runs produce (and/or are expected to produce) negative effects of their own. Point 2 implies that a country hit by a shock is less likely to avoid the crisis. Higher international capital mobility together with the high reliance on foreign capital implies that, during crisis times, withdrawals of international lenders are instantaneous and more harmful than termination by domestic lenders. The above discussion leads to the conjecture that a cut in foreign loans contributes to deeper and longer-lasting financial crises than a cut in domestic loans. Furthermore, because of informational limitations, foreign lenders cannot distinguish among
CHAPTER 4. LEARNING, RISK TAKING, AND SUDDEN STOPS
114
borrowers from the same country and treat them all as equally risky. In fact, the policy of sovereign ceilings followed by rating agencies, in which no single company can have a rating higher than the government of its country, suggests that this is indeed the case.
4.6
Conclusion
The debate on the causes of sudden stops will undoubtedly go on for a long time. Bad luck, in the form of exogenous shocks from abroad and from nature, and bad policy, in the shape of poor regulation and imprudent macro policies, doubtless carry some of the blame. But these are not the sole causes of sudden stops. The main message of this chapter is that information frictions were at the center of the financial crises of the 1990s and that, even though short-term debt is a crucial ingredient of financial fragility, it is not the key factor in sudden stops. In the aftermath of the crises, the reaction, particularly from multilateral lenders, has been to call for more prudent monetary and fiscal policies and greater supervision and transparency in local financial markets. But there is limited agreement on what macroeconomic policies are “appropriate” in this context. Analysts of the Asian episodes, for instance, seem to be evenly divided between those who think that liberalization of capital markets should go on and those who claim that some restrictions must be imposed on international capital flows. The current emphasis on strengthening domestic financial systems also glosses over the practical difficulties. Putting in place an adequate set of prudential and regulatory controls to prevent moral hazard and excessive risk-taking in the banking system is much more easily said than done.
CHAPTER 4. LEARNING, RISK TAKING, AND SUDDEN STOPS
115
Even the most advanced countries fall considerably short of the ideal.14 My model matches many of the qualitative properties of sudden stops that have been recently documented. Moral hazard seems to be a good foundation for the analysis of financial crisis. One key policy goal to deal with informational frictions, like those in this chapter, is to improve information channels. Recent efforts by the IMF and developing countries to improve data dissemination move in the direction of this goal.15
14 Indeed, banking crises have taken place in countries such as Sweden and Japan in the 1990s, and in all developed economies in 2007-08. 15 The IMF’s work on data dissemination standards began in October 1995, when the Interim Committee (now the International Monetary and Financial Committee or IMFC) endorsed the establishment by the Fund of standards to guide members in the dissemination to the public of their economic and financial data. Those standards were to consist of two tiers: the General Data Dissemination System (GDDS), which would apply to all Fund members, and the Special Data Dissemination Standard (SDDS), for those member countries having or seeking access to international capital markets. The SDDS was approved by the IMF Executive Board in March 1996, and the GDDS in December 1997.
Bibliography
Alfaro, A. and Kanczuk, F. (2008). Optimal Reserve Management and Sovereign Debt. NBER Working Papers, Working Paper 13216 Aizenman, J. and J. Lee. (2005). International Reserves: Precautionary Versus Mercantilist Views, Theory and Evidence. NBER Working Papers, Working Paper 11366. Aizenman, J., Lee, Y., and Rhee, Y. (2004). International Reserves Management and Capital Mobility: Policy Considerations and a Case Study of Korea. NBER Working Papers, Working Paper 10534. Aizenman, J. and Marion, N. (2003). The High Demand for International Reserves in the Far East: What’s Going On?. Journal of the Japanese and International Economies, 17(3): 370-400. Aizenman, J. and Marion, N. (2004). International Reserve Holdings with Sovereign risk and Costly Tax Collection. The Economic Journal 114, 569-591. Arellano, C and Mendoza, E. G. (2002). Credit Frictions and ’Sudden Stops’ in Small Open Economies: an Equilibrium Business Cycle Framework for Emerging Markets Crises. NBER Working Papers, Working Paper 8880. Bank for International Settlements (2000). Managing Foreign Debt and Liquidity Risks. BIS Policy Paper 8, BIS Monetary and Economic Department, Basel. Barnichon, R. (2008). International Reserves and Self-Insurance against External Shocks. IMF Working Paper WP/08/149. Ben-Bassat A. and D. Gottlieb (1992). Optimal international reserves and sovereign risk. Journal of International Economics, vol. 33, pp. 345-362. Bester, H. (1985). Screening vs. Rationing In Credit Markets With Imperfect Information. American Economic Review 75, pp.850-855. Bester, H. (1987). The Role Of Collateral in Credit Markets with Imperfect Information. European Economic Review, 31, pp.887-899. Bird, G. and Rajan, R. S. (2003). Too good to be true? the adequacy of international reserve holdings in an era of capital account crises. The World
116
BIBLIOGRAPHY
117
Economy, 26. pp. 873-891. Bolton, P. and Scharfstein, D. (1990). A theory of predation Based on Agency Problems in Financial Contracting. American Economic Review 80, pp.93-106. Bussi`ere, M., and Mulder, C. (1999). External Vulnerability in Emerging Market Economies: How High Liquidity Can Offset Weak Fundamentals and the Effects of Contagion. IMF Working Paper 99/88. Caballero, R. J. and Panageas, S. (2005). A Quantitative Model of Sudden Stops and External Liquidity Management. NBER Working Papers, Working Paper 11293. Calvo G. A. (1998). Capital Flows and Capital-market Crises: The Simple Economics of Sudden Stops. Journal of Applied Economics, Vol. I, No.1, pp.35-54. Calvo, G. A., Leiderman L., and Reinhart C. M. (1993). Capital inflows and real exchange rate appreciation in Latin America: the role of external factors. IMF Staff Papers, vol 40, no 1, pp.108-51. Calvo, G. A. (1996). Capital Flows and Macroeconomic Management: Tequila Lessons. International Journal of Finance and Economics 1, No.3, pp.207-23. Calvo, G. A. and Mendoza, E. G. (1997).Rational Contagion, Globalization, and the Volatility of Capital Flows. mimeo., Center for International Economics, University of Maryland. Calvo, G. A. and Mendoza, E. G. (2000). Capital-Markets Crises Collapse in Emerging Markets: An Informational-Frictions Approach. American Economic Review, Vol. 90(2), pp. 59-64, Papers and Proceeding of the One Hundred Twelfth Annual Meeting of the American Economic Association. Calvo, G. A., and Reinhart, C. M. (2000). Fear of Floating. NBER Working Papers, Working Paper 7993. Calvo, G. A. Izquierdo, A. and Mej´ıa, L-F. (2004). On The Empirics of Sudden Stops: The Relevance OF Balance-Sheet Effects. NBER Working Papers, Working Paper 10520. Campbell, J. Y. (1996). Understanding risk and return. Journal of Political Economy 104, 298-345.
BIBLIOGRAPHY
118
Campbell J. Y., Lo A. W., and MacKinlay A. C. (1997). The Econometrics of Financial Markets. New Jersey: Princeton University Press. Campbell J. Y. and Viceira L. M. (1998). Who Should Buy Long-Term Bonds? unpublished manuscript. Chamon, M., Manasse, P., and Prati, A. (2007). Can We Predict the Next Capital Account Crisis?. IMF Staff Papers , Palgrave Macmillan Journals, vol. 54(2), pp. 270-305. Chang, R. and Velasco, A. (1998a). The Asian Liquidity Crisis. NBER Working Papers, Working Paper 6796. Chang, R. and Velasco, A. (1998b). Financial Crises in Emerging Markets: A Canonical Model. NBER Working Papers, Working Paper 6606. Chari, V. V. and Kehoe, P. J. (1998). Asking the Right Questions about the IMF. Federal Reserve Bank of Minneapolis Annual Report. Cheung, Y-W., and Ito, H. (2007). A Cross-Country Empirical Analysis of International Reserves. memo Clark, P. B. (1970). Optimum International Reserves and the Speed of Adjustment. Journal of Political Economy Vol. 78(2), pp. 356-376. Cole, H. L. and Kehoe, T. (1996). A Self-fulfilling Model of Mexico’s 1994-1995 Debt Crisis. Journal of International Economics 41, pp.309-330. Corsetti, G., Pesenti, P. and Roubini, N. (1999). What Caused the Asian Currency and Financial Crises? Japan and the World Economy 11, pp. 305-373. Corsetti, G. and Roubini, N. (1991). Fiscal Deficits, Public Debt and Government Solvency: Evidence from OECD Countries. Journal of the Japanese and International Economics 5, pp.354-380. Day, P. and Choi, H. W. (2004). Asian Central Banks Consider Alternative to Big Dollar Holdings. Wall Street Journal, February 5, 2004. De Beaufort-Wijnholds, J. O., and Kapteyn A. (2001). Reserve Adequacy in Emerging Market Economies. IMF Working Paper 01/143. Dhasmana, A. and Drummond, P. (2008). Foreign Reserve Adequacy in SubSaharan Africa. IMF Working Paper WP/08/150. Dickey, D. and W. Fuller. 1979. Distribution of the Estimators for Autoregressive Time Series with a Unit Root. Journal of the American Statistical Association,
BIBLIOGRAPHY
119
Vol. 74. pp.427-31. Durdu C. B., Mendoza E. G., and Terrones M. E. (2007). Precautionary Demand for Foreign Assets in Sudden Stop Economies: An Assessment of the New Merchantilism. IMF Working Paper WP/07/146. Edison, H. (2003). Are Foreign Exchange Reserves in Asia Too High?. World Economic Outlook, Chapter 2, pp. 78-92. Edwards, S. (1985). On the Interest-Rate Elasticity of the Demand for International Reserves: Some Evidence from Developing Countries. Journal of International Money and Finance 4(2): 287-95. Edwards, S. ed. (2000). Capital Flows and the Emerging Markets Economies. A NBER Conference Report. Chicago: University of Chicago Press. Eichengreen, B. and Hausmann, R. (1999). Exchange Rates and Financial Fragility. In proceedings of the Symposium New Challenges for Monetary Policy, Federal Reserve Bank of Kansas City, pp. 329-368. Feldstein, M. S. (1999). A Self-Help Guide for Emerging Markets. Foreign Affairs 78(2): pp. 93-109. Fisher, S. (2001). Opening Remarks. IMF/World Bank International Reserves: Policy Issues Forum. Flood, R. and Marion N. (2002). Holding International Reserves In an Era of High Capital Mobility. IMF Working Paper 02/62. Frenkel, J. and Jovanovic B. (1981). Optimal International Reserves: A Stochastic Framework. Economic Journal 91, 507-514. Frankel, J. and Edwards, S. (2002). Preventing Currency Crises in Emerging Markets. A NBER Conference Report. Chicago: University of Chicago Press. Furman, J. and Stiglitz, J.E. (1998). Economic Crises: Evidence and Insights from East Asia. Brookings Papers on Economic Activity, Vol. 2, pp. 1-114. Presented at Broking Panel on Economic Activity. Garcia, P. S., and Soto, C. (2004). Large Hoarding of International Reserves: Are they worth it?. Manuscript, Bank of Chile. Glick, R. and Rogoff, K. S. (1995). Global versus Country-Specific Productivity Shocks and the Current Account. Journal of Monetary Economics, 35 (1), pp. 59-192.
BIBLIOGRAPHY
120
Gosselin, M-A. and Parent N. (2005). An Empirical Analysis of Foreign Exchange Reserves in Emerging Asia. Bank of Canada Working Paper 2005-38. Greenspan, A. (1999). Currency Reserves and Debt. Remarks by Chairman Alan Greenspan before the World Bank Conference on Recent Trends in Reserve Management, Washington, 29 April. Hamada, K. and Ueda, K. (I977). Random walks and the theory of optimal international reserves. Economic Journal, vol. 87, pp. 722-42. Hausmann, R., Panizza, U. and Stein E. (2000). Why Do Countries Float the Way They Float? memo, Inter-American development Bank. Heller, R. H. (I966). Optimal international reserves. Economic Journal, vol. 76, pp. 296-311. Heller, R.H. and Khan,M.S. (1978). The Demand for International Reserves Under Fixed and Floating Exchange Rates. IMF Staff Papers, 25(4), pp. 623-649. Herrera, J. (2004). Business Cycles in Mexico and the United States: Do They Share Common Movements? Journal of Applied Economics, Vol. VII, No.2, pp. 303-23. Hoskins, W. L., and Coons, J. W. (1995). Mexico: Policy Failure, Moral Hazard, and Market Solutions. Cato Institute Policy Analysis No. 243. Inter American Development Bank (1995). Economic and Social Progress in Latin America, Part 2: Overcoming Volatility. International Energy Agency, Annual Report 2006. Jeanne O. (2007) International Reserves in Emerging Market Countries: Too Much of a Good Thing? Brookings Papers on Economic Activity (1). Jeanne, O. and Ranci`ere, R. (2006). The Optimal Level of International Reserves for Emerging Market Countries: Formulas and Applications. IMF Working Paper WP/06/229. Kim, J. (2008). Sudden Stops and Optimal Self-Insurance. IMF Working Paper WP/08/144. Krugman, P. (1979). A model of BOP crises. Journal of Money, Credit, and Banking 11, pp. 311-325. Krugman, P. ed. (2000). Currency Crises. A NBER Conference Report. Chicago:
BIBLIOGRAPHY
121
University of Chicago Press. Landell-Mills, J.M. (1989). The Demand for International Reserves and their Opportunity Cost. IMF Staff Papers 36(3): 107-32. Lane, P.R. and Burke D. (2001). The Empirics of Foreign Reserves. Open Economy Review 12(4), pp. 423-34. Leiderman, L. and Razin, A (1991). Determinants of External Imbalances: The Role of Taxes, Government Spending, and Productivity. Journal of the Japanese and International Economics, 5, pp. 421-450. Levy-Yeyati, E. and Sturzenegger, F. (2000). Implications of the Euro for Latin America’s Financial and Banking Systems. Emerging Markets Review 1, pp. 53-81. Lizondo, J. and Mathieson D. (1987). The Stability of the Demand for International Reserves. Journal of International Money and Finance 6(3), pp. 251-82. Lloyd-Ellis, H. and Zhu X. (2001). Fiscal shocks and fiscal risk management. Journal of Monetary economics, 48, 309-338. Lloyd-Ellis, H. and Zhu X. (2006). Using Financial Market Information to Enhance Canadian Fiscal Policy. Public Finance and Management, vol. 6 (2), pp.151-185. Milesi-Ferretti, G. M. and Razin A. (1996). Current Account Sustainability. Princeton Studies in International Finance, No. 81. Miller, M. and Zhang, L. (2006). Fear and Market Failure: Global Imbalances and Self-Insurance. London: Centre for Economic Policy Research. Discussion Paper 6000. Mody, A., and Taylor, M. P. (2002). International Capital Crunches: The TimeVarying Role of Informational Asymmetries. IMF Working Paper 02/43. Mollick, A. (2002). Effects Of U.S. Interest Rates On The Real Exchange Rate In Mexico. Economics Bulletin, vol. 6, pp. 1-15. Obstfeld, M., (1998). The Global Capital Market: Benefactor or Menace? Journal of Economic Perspectives, 12:4, pp. 9-30. Phillips, P. and Perron P. (1988). Testing for a Unit Root in Time Series Regression. Biometrika 75. pp. 335-46.
BIBLIOGRAPHY
122
Pomerleano, M. (1999). The East Asia Crisis and Corporate Finances: The Untold Micro Story. The World Bank, Policy Research Working Paper 1990. Pringle, R. and Carver, N., eds. (2005). RBS Reserve Management Trends. London: Central Banking Publications. Radelet, S. and Sachs, J. (1998). The East Asian Financial Crises: Diagnosis, Remedies, Prospects. Brookings Papers on Economic Activity 1, pp. 1-90. Razin, A. (1993). The Dynamic-Optimizing Approach of Current Account: Theory and Evidence, in Peter B. Kenen, ed. Understanding Interdependence : The macroeconomics of the Open Economy, Princeton, N.J., Princeton University Press. pp. 169-198. Ranci`ere, R., Tornell, A. and Westermann, F. (2003). Crises and Growth: A Re-evaluation. NBER Working Papers, Working Paper 10073. Rodrik, D. (2006). The Social Cost of Foreign Exchange Reserves. NBER Working Papers, Working Paper 11952. Rodrik, D. and Velasco, A. (1999). Short-Term Capital Flows. NBER Working Papers, Working Paper 7364. Rothenberg, A. D. and Warnock F. E. (2006). Sudden flight and true sudden stops. NBER Working Papers, Working Paper 12726. Rothschild M., Stiglitz J. (1976). Equilibrium In Competitive Insurance Markets: An Essay On The Economics Of Imperfect Information. Quarterly Journal of Economic 90, pp. 629-649. Sachs, J. D., Tornell, A., and Velasco, A. (1996). The Mexican peso crisis: Sudden death or death foretold? Journal of International Economics 41, pp.265-283. Sachs, J., Tornell, A., Velasco, A., (1996a). The Mexican peso crisis: sudden death or death foretold? Journal of International Economics 41, 265-283. Sachs, J., Tornell, A., Velasco, A., (1996b). Financial crises in emerging markets: the lessons from 1995. Brookings Papers on Economic Activity 10 (1), pp. 147-198. Saikkonen P. (1991). Asymptotically Efficient Estimation of Cointegration Regression. Econometric Theory, 7. pp. 1-21. Sosa, S. (2008). External Shocks and Business Cycle Fluctuations in Mexico:
BIBLIOGRAPHY
123
How Important are U.S. Factors? IMF Working Paper WP/08/100. 19, pp.559-60, and chapter 20, pp.611-12. Stiglitz, J. E. (2006). Making Globalization Work. Norton. Stiglitz, J. E. and Weiss, A. (1981). Credit Rationing in Markets with Imperfect Information. American Economic Review, Vol. 71, pp.393-411. Stiglitz, J. E. and Weiss, A. (1983). Incentive Effects of Terminations: Applications to the Credit and Labor Markets. American Economic Review, Vol. 73, pp. 912-927. Summers, L. H. (2006). Reflections on Global Account Imbalances and Emerging Markets Reserves Accumulation. L. K. Jha Memorial Lecture, Reserve Bank of India, Mumbai, March 24. (www.president.harvard.edu/speeches/2006/0324 rbi.html). Summers, L. and D’Amato, A. M. (1996).Was the U.S. bailout of Mexico a good investment? Insight on the News, Vol. 12, January 1, 1996. Swiston, A. and Bayoumi, T. (2008). Spillovers Across NAFTA. IMF Working Paper 08/3. Taylor, J. B. (1993). Discretion Versus Policy Rules in Practice. CarnegieRochester Conference Series on Public Policy, 39, pp. 195-214. Torres, A. and Vela O. (2003). Trade Integration and Synchronization Between the Business Cycles of Mexico and the United States. North American Journal of Economics and Finance, 14, pp. 319-42. & Technology, HKUST. V´asquez I. (2002). A Retrospective on the Mexican Bailout. Cato Journal, Vol. 21, No. 3, pp. 545-51. Xinhua News Agency (2004). China Sets No Target for Forex Reserve. http://news.xinhuanet.com/english/2004-03/07/content 1350147.htm
Appendix A
A.1 A.1.1
Model Estimates Dynamic OLS Estimation
Recall that, using both ADF and PP tests, I cannot reject the null hypothesis of a unit root for LCOP, LUSMCO; I reject the null hypothesis of a unit root for TBILL and VWR; and I get mixed results for FR, DIV and LONG. Considering these later series (FR, DIV and LONG) non-stationary motivates the use of cointegration methods for my analysis. More specifically, I apply the system cointegration approach developed in Johansen (1988) to determine whether there is any evidence of a long-run relationship between the foreign reserves in Mexico and the crude oil price, U.S. imports of crude oil from Mexico, dividend yields, and the yield on 10-year U.S. government bonds. Johansen’s testing procedure strongly rejects the null hypothesis of no cointegration and fails to reject the null hypothesis of at most 1 cointegration equation. These time-series properties suggest that I estimate elasticities via dynamic OLS. The estimation method proposed here is based on Saikkonen (1991). This method consists of augmenting the model (2.2) where X is now identified by LCOP, LUSMCO, DIV, TBILL, LONG and VWR and augmented by leads and lags of I(1) explanatory variables (LCOP, LUSMCO, DIV, LONG) to correct for the autocorrelation in error terms. The estimation results are presented in Table A.1.
124
APPENDIX A.
125
Table A.1: Decomposing Reserves Based on Cointegration Analysis
Change of log: - Oil Price - U.S. M of Oil from Mexico Dividend yield Treasury Bills Yield on 10-year U.S. Bonds Value Weighted Returns
Shocks
Shocks & Dummy
.38∗ (1.98) -.89∗ (-1.86) -4.43∗ (-1.90) -7.65∗ (-1.83) -5.14 (-.39) .43 (.39)
.54∗ (1.92) -1.77∗∗ (-1.71) -4.65∗∗ (-1.72) -10.10∗ (-1.51) -5.50 (-.49) .35 (.38) .46 (1.10) -3.10∗∗∗ (-15.93) 96 4 .70 2.69 [0.000]
Dummy -2.91∗∗∗ (-26.93) 96 4 .70
Constant NOBS Lags & Leads ¯2 R Chow P-value
[0.000]
Error Correction Model .38 -.66 -1.90 -2.75 -8.76 .26
103
Notes: (1) Corrected t-statistics are given in parentheses. (2) Significance at 10%, 5% and 1% is referred to ∗ , ∗∗ , and
A.1.2
∗∗∗
, respectively.
Estimated Variance-Covariance Matrix of the Shocks .01738675
.00108336 −.00011453 ˆ Σ= .00013576 .0001713 −.00243556
.00108336
−.00011453
.00013576
.0001713
−.00243556
.0092803
.0002455
−.00015961
−.0000157
.00081493
.0002455
.00109096
−.00001936 −.00001719
.00046624
−.00015961
−.00001936
.00003275
.0000174
−.00009976
−.0000157
−.00001719
.0000174
.00002666
−.00011604
.00081493
.00046624
−.00009976 −.00011604
.00626487 (A.1)
APPENDIX A.
A.1.3
126
Estimated Parameters of the VAR Model Table A.2: VAR Estimates variable ∆LCOP (−1) ∆LU M CO(−1) DIV(-1) TBILL(-1) LONG(-1) VWR(-1)
A.1.4
∆LCOP .13 (.10) .11 (.12) .009 (.26) .13 (1.18) -.81 (1.59) -.07 (.17)
∆LU SM CO -.16 (.07) -.33 (.09) .02 (.19) .46 (.86) -.24 (1.16) -.21 (.13)
DIV .02 (.03) -.006 (.03) .69 (.07) -.32 (.30) 1.32 (.40) -.02 (.04)
TBILL .007 (.004) -.005 (.005) .008 (.01) .92 (.05) -.012 (.07) .015 (.008)
LONG .001 (.004) .0006 (.005) .005 (.010) .057 (.046) .891 (.062) .005 (.007)
VWR .07 (.06) -.02 (.07) .35 (.16) -.15 (.71) -.91 (.95) -.10 (.10)
Other Estimates and calibration
Table A.3 reports additional estimates and some of the calibrated results needed for the simulation exercise. Table A.3: Other Estimates and calibration σ ˆ²2 .102
A.2 A.2.1
σ ˆµ2 σ ˆξ2 .029 .070
g 0.035
ρ4 -0.1573
ρ6 0.0388
φ 0.08
Data Traditional variables
GDP: gross domestic product is taken from the national accounts of the BOP (Billions of Pesos), IFS series code 27399B.CZF... It is converted into U.S. dollars using the end of period pesos per U.S. dollars rate taken from IFS series code 273..WE.ZF... EXRV: 12 months moving average standard deviation of the end of period Pesos per U.S.dollars rate.
APPENDIX A.
127
EXPV: exports volatility is measured as 10 quarters backward moving standard deviation of exports receipts. Exports receipts are the Exports of Goods and Services (billions of Pesos) taken from national accounts of the BOP, IFS series code 27390C.CZF... ∆LIM P : change in the (log of) imports to GDP ratio. Imports of Goods and Services are taken form national accounts of the BOP, IFS series code 27398C.CZF... ∆LM 2: change in the (log of) broad money, M2, to GDP ratio. M2 is taken from IFS, series code 27359MB.ZF... It is measured in Millions of Pesos. FO: financial openness, which is calculated as the ratio of Capital flows to GDP. Capital flows are measured by the financial account of the BOP, series code 27378BJDZF.... OPPCOST: the opportunity cost of holding reserves is calculated as the difference between the Mexican deposit rate, taken form the IFS, series code 27360L..ZF.... and the U.S. treasury bill rate series code 11160C..ZF....
A.2.2
Asset Returns
VWR is the index of value-weighted returns on the NYSE taken from the CRSP tape. DIV is the dividend yield on the NYSE from the CRSP tape. LONG is the nominal interest rate on 10 year U.S. government bonds. TBILL is the nominal 3-month U.S. treasury bill rate.
A.2.3
Other variables
∆LCOP : growth rate of the average crude oil (nominal) price (U.S.$/barrel). IFS series code 00176AAZZF... ∆LU SM CO: growth rate of quarterly totals of U.S. imports of crude oil from Mexico. 1000barrels/day. Taken from Economagic.com http://www.economagic.com/em-cgi/data.exe/tmp/130-15-74-172!20081021103306
APPENDIX A.
A.2.4
128
Trade Balance
Reserves: foreign exchange holdings, measured in U.S. dollars. 273.1D.DZF...
IFS series code
Income Transfers: it is calculated as the difference between Income Credits, IFS series code 27378AGDZF..., and Income Debt, IFS series code 27378AHDZF... Net Liability Position Only few observations of the international investment position are available in the IFS database. For Mexico, there are 6 annual observations, 2001 through 2006. To infer the quarterly data we use some identities from the BOP. To outline our approach we first need to define our variables. Define, • Lt : Net Liability Position in period t, • Rt : Stock of International Reserves the country holds in period t, • ITt : Net Income Transfers in period t. It is equal to Income Credit - Income Debt. • T Bt : Trade balance in period t. From the balance of payment equations we have Rt+1 − Lt+1 = Rt − Lt + ITt + T Bt or Lt+1 = ∆Rt + Lt − ITt − T Bt where ∆Rt = Rt+1 − Rt . Since we have only few observations of Lt which they are annual (end of period) and refer to the last 6 years only we infer the quarterly data starting from the last observation, i.e. 2006, which is also the observation relative to the last quarter of the year 2006, i.e. 2006:4 and then work our way backward using the quarterly flow variables we have (∆Rt , ITt , and T Bt ). That is, Lt = Lt+1 − ∆Rt + ITt + T Bt
A.3
(A.2)
Contribution of Traditional Variables to Reserves Process
Figure A.1 below shows the actual and fitted foreign reserves implied by the relationship between foreign reserves in Mexico and the traditional variables.
APPENDIX A.
129
−2
ln(FR/GDP)
−2.5
−3
Actual Foreign Reserves Predicted Foreign Reserves
−3.5
−4 1985Q4
1994Q4
2006Q4
Figure A.1: Traditional Demand for Reserves
A.4
Calibration of the Two-Factor Asset pricing Model: From Unpublished Appendix of LloydEllis and Zhu (2001)
From (2.14), (2.18), and (2.20), the moment condition of the risk premium can be written as follows: ¢ ¡ 1 m ] − rtT BILL + Σ6,6 − ρ6 Σ6,6 − ρ4 Σ4,6 = 1 exp Et [Rt+1 2
(A.3)
or,
1 m ] − rtT BILL + Σ6,6 − ρ6 Σ6,6 − ρ4 Σ4,6 = 0. Et [Rt+1 (A.4) 2 Taking unconditional expectations of the left hand side of the equation yields 1 Et [Rtm − rtT BILL ] + Σ6,6 − ρ6 Σ6,6 − ρ4 Σ4,6 = 0. 2
(A.5)
APPENDIX A.
130
Replacing the theoretical moments with sample moments, we have T 1X m 1 (Rt − rtT BILL ) + Σ6,6 − ρ6 Σ6,6 − ρ4 Σ4,6 = 0 T t=1 2
(A.6)
Using (2.14) and (2.15) we have µ ¶ ¡ £ Mt+2j ¤ 1 2¢ 1 T BILL ] + σω 2j − mz (t, 2j) + Vzz (t, 2j) . Et = exp − E[rt Mt 2 2
(A.7)
where £ ¤ mz (t, 2j) = Et − (lnMt+2j − lnMt ) − 2$j £ ¤ Vzz (t, 2j) = Et (−(lnMt+2j − lnMt ) − 2$j − mz (t, 2j))2 So, the moment condition (2.15) can be written as · 20 µ ¶¸ ¡ 1 X 1 2¢ 1 T BILL 1= exp − E[rt ] + σω 2j − mz (t, 2j) + Vzz (t, 2j) rtLON G 2 j=1 2 2 µ +exp −
¡
E[rtT BILL ]
1 ¢ 1 + σω2 40 − mz (t, 40) + Vzz (t, 40) 2 2
¶ (A.8)
Taking the sample average of the right hand side of this equation yields µ ¶¸ 20 · ¡ 1X 1 2¢ 1 T BILL 1= exp − E[rt ] + σω 2j − mz (t, 2j) + Vzz (t, 2j) rtLON G 2 j=1 2 2 µ +exp −
¡
E[rtT BILL ]
1 ¢ 1 + σω2 40 − mz (t, 40) + Vzz (t, 40) 2 2
¶ (A.9)
where σω2 is defined by (2.20). The parameters ρ4 and ρ6 are chosen so that they are the solutions to the equations (A.6) and (A.9). This is done by using (A.6) to express ρ6 as a linear function of ρ4 and substituting into (2.20), which in turn substituted into equation (A.9). We then numerically look for the value ρ4 that solves equation (A.9).
APPENDIX A.
A.5
131
Details Related to Calculation of the Present Value
To compute the present value of Mexico net income we proceed as follow: for each date, we computed the change in reserves, ∆Rt = Rt − Rt−1 , the change in net liabilities position, ∆Lt = Lt − Lt−1 , and the income transfers, ITt and then we discount at rate Mt /Mt−1 . We need to calculate present value of nominal cash-flows of the following form: · µ ¶¸ ¡ ¢ ¡ ¢ 1 B(t, j) = (A.10) Et Mt+j Rt+j − Rt+j−1 − Lt+j − Lt+j−1 −ITt+j Mt {z } | {z } | ∆Rt+j
∆Lt+j
Let Z(t, j) = −ln(Mt+j ). Then1 Z(t, j) = Z(t, j − 1) + bT Xt+j−1 + wt+j ,
(A.11)
where Z(t, 0) = −lnMt and ωt is i.i.d, and ωt ∼ N (0, σω2 ). It follows that · µ ¶¸ 1 −Z(t,j) B(t, j) = Et e ∆Rt+j − ∆Lt+j − ITt+j Mt
(A.12)
or 1 B(t, j) = Mt
½
¾ Et [e |
−Z(t,j)
{z
−Z(t,j)
∆Rt+j ] − Et [e } |
(I)
{z
−Z(t,j)
∆Lt+j ] − Et [e } |
(II)
{z
ITt+j ] }
(A.13)
(III)
To calculate this present value we need to calculate its three components, (I), (II), and (III). Recall that in sections 2.2 and 2.3 we derived the processes driving Rt , Lt , 1
This is the general form. As outlined in the paper, in our case we use the following specification −ln(
1 Mt ) = rt−1 + σ 2 + ωt Mt−1 2
That is bT = (0, 0, 1/4, 0). Which can be rewritten this as follow 1 −lnMt = −lnMt−1 + rt−1 + σ 2 + ωt 2
APPENDIX A.
132
and ITt . From model (2.2), we have Γt β T Xt +²t
R t = Yt e e
Γt β T Xt +²t
=e e
Y0
t Y
(1 + gs )
(A.14)
s=0
where Y0 standsQfor the output in 0, gs is the growth rate of output between periods s and s − 1, and ts=0 (1 + gs ) is the output growth between periods 0 and t. It follows that · ¸ t t−1 Y Y Γt β T Xt +²t β T Xt−1 +²t−1 ∆Rt = Y0 e e (1 + gs ) − e (1 + gs ) (A.15) s=0
s=0
Similarly, from model (2.9), we have N¯L+αT Xt +µt
Lt = Yt e
N¯L+αT Xt +µt
=e
Y0
t Y
(1 + gs )
(A.16)
s=0
it follows that · ∆Lt = Y0 e
N¯L
αT Xt +µt
e
t Y
(1 + gs ) − e
αT Xt−1 +µt−1
s=0
t−1 Y
¸ (1 + gs )
(A.17)
s=0
By using model (2.10), the income transfers, ITt , process is, ¯ +γ T Xt +ςt IT
ITt = −Yt e
¯ γ T Xt +ςt IT
= −Y0 e e
t Y
(1 + gs )
(A.18)
s=0
Note that 1 + gt can be approximated by egt ; that is, 1 + gt ≈ egt Let Θ(t, j) =
t+j Y
egs
(A.19)
(A.20)
s=0
Using (A.11), (A.15), (A.17), and (A.19)-(A.20) we can rewrite (I), (II), and (III) as follow · µ T −Z(t,j) Γ −Z(t,j) (I) : Et [e ∆Rt+j ] = Y0 e E0 e eβ Xt+j +²t+j Θ(t, j) ¶¸ β T Xt+j−1 +²t+j−1 −e Θ(t, j − 1)
APPENDIX A.
133
or, ½ −Z(t,j)
(I) : Et [e
∆Rt+j ] =
Y0 eΓ
· ¸ −Z(t,j)+β T Xt+j +²t+j E0 e Θ(t, j) {z } | (Ia)
·
−Z(t,j)+β T Xt+j−1 +²t+j−1
− E0 e |
{z
(A.21)
¸¾ Θ(t, j − 1) }
(Ib)
½ −Z(t,j)
(II) : Et [e
∆Lt+j ] =
Y0 e
N¯L
·
¸ −Z(t,j)+αT Xt+j +µt+j
E0 e |
(IIa)
· − E0 e |
Θ(t, j)
{z
−Z(t,j)+αT Xt+j−1 +µt+j−1
{z
(A.22) }
¸¾ Θ(t, j − 1) }
(IIb)
· (III) : Et [e
−Z(t,j)
¯ IT
ITt+j ] = −Y0 e
¸ −Z(t,j)+γ T Xt+j +ςt+j
E0 e |
(A.23)
Θ(t, j)
{z
}
(IIIa)
So, · ¸ · ¸ £ ¤ N¯L £ ¤ IT 1 1 ¯ Γ B(t, j) = Y0 e (Ia)−(Ib) −e (I)−(II)−(III) = (IIa)−(IIb) +e (IIIa) Mt Mt (A.24) The next exercise is to calculate (Ia), (Ib), (IIa), (IIb), and (IIIa) in order to get the present value of cash-flows. · ¸ £ ¤ £ ¤ T −Z(t,j)+β T Xt+j +²t+j (Ia) : E0 e Θ(t, j) = E0 e−Z(t,j)+β Xt+j +²t+j E0 Θ(t, j) ¡
−Z(t,j)+β T Xt+j +²t+j
+COV e
¡ ¢ T Note that COV e−Z(t,j)+β Xt+j +²t+j , Θ(t, j) = 0. Recall that Θ(t, j) =
t+j Y s=0
egs ,
(A.25) ¢ , Θ(t, j)
APPENDIX A.
134
and we also have that E[egs ] = eg¯. So, E[Θ(t, j)] = eg¯(t+j)
(A.26)
£ ¤ 1 T E0 e−Z(t,j)+βXt+j +²t+j = e−mz (t,j)+β mx (t,j)+E[²t+j ]+ 2 V (−Z(t,j)+βXt+j +²t+j ) where mz (t, j) = E[Z(t, j)] and mx (t, j) = E[Xt+j ]. Note that E[²t+j ] = 0. So, £ ¤ 1 T T E0 e−Z(t,j)+βXt+j +²t+j = e−mz (t,j)+β mx (t,j)+ 2 V (−Z(t,j)+β Xt+j +²t+j )
(A.27)
Let V (−Z(t, j) + βXt+j + ²t+j ) = Vβ,² (j). Then, Vβ,² (j) = V (−Z(t, j) + Xt+j β) + V (²t+j ) + 2COV (−Z(t, j) + Xt+j β, ²t+j ) =
V (Z(t, j)) + β T V (Xt+j )β + 2COV (−Z(t, j), Xt+j β) + V (²t+j ) +2COV (−Z(t, j) + βXt+j , ²t+j )
=
V (Z(t, j)) + β T V (Xt+j )β − 2COV (Z(t, j), Xt+j )β + V (²t+j ) £
¤ +2 − COV (Z(t, j), ²t+j ) + β COV (Xt+j , ²t+j )
(A.28)
T
We have that COV (Z(t, j), ²t+j ) = 0 and COV (Xt+j , ²t+j ) = 0. So it follows that Vβ,² (j) = V (Z(t, j)) + β T V (Xt+j )β − 2β T COV (Xt+j , Z(t, j))T + V (²t+j )
(A.29)
Let Vxx (j) = V (Xt+j ), Vzz (j) = V (Z(t, j)), Vxz (j) = COV (Z(t, j), Xt+j ). Then (A.29) can be written as Vβ,² (j) = Vzz (j) + β T Vxx (j)β − 2Vxz (j)β + σ²2
(A.30)
To iterate on this moment we need to calculate Vxx (j), Vzz (j), and Vxz (j). These moments can be calculated recursively as follows: mx (t, j) = Amx (t, j − 1),
(A.31)
mz (t, j) = mz (t, j − 1) + bT mx (t, j − 1),
(A.32)
Vxx (j) = AVxx (j − 1)AT + Σ,
(A.33)
Vxz (j) = AVxz (j − 1) + AVxx (j − 1)b + v,
(A.34)
APPENDIX A.
135
Vzz (j) = Vzz (j − 1) + 2bT Vxz (j − 1) + bT Vxx (j − 1)b + σω2 .
(A.35)
T
where mz (t, 1) = b Xt −lnMt , mx (t, 1) = AXt , Vxx (1) = Σ, Vxz = v, and Vzz = σω2 . We can rewrite (A.27) as follows £ ¤ 1 T E0 e−Z(t,j)+βXt+j +²t+j = e−mz (t,j)+β mx (t,j)+ 2 Vβ,² (j) Using (A.26) and (A.36) we have that ½ ¾ 1 T (Ia) = exp − mz (t, j) + β mx (t, j) + Vβ,² (j) + g¯(t + j) 2 Similar calculations lead to the derivation of (Ib), ½ ¾ 1 T (Ib) = exp − mz (t, j) + β mx (t, j − 1) + Qβ,² (j − 1) + g¯(t + j − 1) 2
(A.36)
(A.37)
(A.38)
where, £ ¤ Qβ,² = Vzz (j) + β T Vxx (j − 1)β − 2β T Vxz (j − 1) + Vxx (j − 1)b + σ²2 Following the same steps we can calculate, (IIa), (IIb), and (IIIa) ½ ¾ 1 T (IIa) = exp − mz (t, j) + α mx (t, j) + Vα,µ (j) + g¯(t + j) 2 ½ ¾ 1 T (IIb) = exp − mz (t, j) + α mx (t, j − 1) + Qα,µ (j) + g¯(t + j − 1) 2 ½ ¾ 1 T (IIIa) = exp − mz (t, j) + γ mx (t, j) + Vγ,ς (j) + g¯(t + j) 2
(A.39)
(A.40) (A.41) (A.42)
where, Qα,µ
Vα,µ (j) = Vzz (j) + αT Vxx (j)α − 2Vxz (j)α + σµ2 , £ ¤ = Vzz (j) + αT Vxx (j − 1)α − 2αT Vxz (j − 1) + Vxx (j − 1)b + σµ2 ,
(A.44)
Vγ,ς (j) = Vzz (j) + γ T Vxx (j)γ − 2Vxz (j)γ + σς2
(A.45)
(A.43)
Recall from (A.24) we have ¸ · ¸ · ¤ IT £ ¤ N¯L £ 1 1 ¯ Γ (IIa)−(IIb) +e (IIIa) (I)−(II)−(III) = Y0 e (Ia)−(Ib) −e B(t, j) = Mt Mt
APPENDIX A.
136
So, the present value of the trade balance (i.e., country’s future net income) is equal to ∞ 1 X V (T B) = B(t, j) (A.46) Mt j=1
Appendix B
B.1
Lender’s maximization Problem
To see how Lemma 3 simplifies the maximization problem, note that by Lemma 3, we solve the IC constraint for σ to get σ=
β[1 − (1 − x)µ] 1 + β(1 − µ)
(B.1)
Next, plug (B.1) into the lender’s expected payoff, EU , (for easy notation I ignore the max operator) ½ ¡ £ ¡ ¢ ¤ ¢ EU = β ρ (1 − µ) βZ − 1 − β[1−(1−x)]µ K + xµ[βbZ0 − K] 1+β(1−µ) ¾ ¡ β[1−(1−x)µ] ¢ −(1 − ρ) 1+β(1−µ) + x K ½ · ¸ · ¸ ¾ £ ¡ 1−βxµ ¢ ¤ £ ¤ x(1+β)+β(1−µ) = β ρ (1 − µ) βZ − 1+β(1−µ) K + xµ βbZ0 − K − (1 − ρ) K 1+β(1−µ) ½ =
β ρ(1 − µ)[βZ −
1 K] 1+β(1−µ)
+
ρ(1−µ)βµx K 1+β(1−µ)
+ ρµβbZ0 x ¾
−ρxµK −
(1−ρ)(1+β)x K 1+β(1−µ)
−
(1−ρ)β(1−µ) K 1+β(1−µ)
let g(x) a function that regroups all terms (in the above function) involving x; thus, · ¸ ρ(1 − µ)βµ (1 − ρ)(1 + β) g(x) = K− K + ρµβbZ0 − ρµK x 1 + β(1 − µ) 1 + β(1 − µ)
137
APPENDIX B.
138
The first and second terms in the square brackets on the right hand side can be arranged to get · ¸ ¡ ¢ 1 + β − ρ 1 + β + (1 − µ)µβ − K 1 + β(1 − µ) It follows that · · g(x) =
¡
¸ ¸
1+β−ρ 1+β+(1−µ)µβ
ρµ(βbZ0 − K) − £
¤£ ρµβbZ0 −ρµK
=
¢
1+β(1−µ)
¤
K x
£
x
1+β(1−µ)
£
¤
ρµβbZ0 [1+β(1−µ)]− ρµ[1+β(1−µ)]+(1+β)−ρ[1+β+(1−µ)µβ] K
=
1+β(1−µ)
= £ where h(Z0 , K) =
¤
1+β(1−µ) −(1+β)K+ρ 1+β+(1−µ)µβ K
x
−h(Z0 , K)x ¤ ρµ[1+β(1−µ)]+(1+β)−ρ[1+β+(1−µ)µβ] K−ρµβbZ0 [1+β(1−µ)] 1+β(1−µ)
.
Using the result x = 0 and plug it into (B.1) we get (4.28).
B.2
Proof of condition (4.26)
f (ρ, µ) = =
µ[1−ρ0 β(1−µ)]+(1−ρ0 )(1+β)+ρ0 µ[1+β(1−µ)] ρ0 µβ[1+β(1−µ)]ρ1
µ[1 − ρ0 β(1 − µ)] + (1 − ρ0 )(1 + β) + ρ0 µ[1 + β(1 − µ)] × βρ1 1 (B.2) ρ0 µ[1 + β(1 − µ)] | {z } m(ρ,µ)
APPENDIX B.
139
By (4.9), we have that βρ1 1 > A. We also have that A > 1. So, to complete our proof, we need to show that m(ρ, µ) ≥ 1. m(ρ, µ) µ + (1 − ρ0 )(1 + β) + ρ0 µ µ + (1 + β) − ρ0 (1 + β) + ρ0 µ µ + (1 + β)(1 − ρ0 )
≥ ≥ ≥ ≥
1 ρ0 µ[1 + β(1 − µ)] ρ0 µ + ρ0 µβ(1 − µ)] ρ0 µβ(1 − µ)
(B.3)
We have that µ > µρ0 β(1 − µ). So, m(ρ, µ) ≥ 1 and (4.26) is satisfied.
B.3
Corollary 3 ∂ 2 ρ0 ∂β 2
=
£ ¡
β 1+A[1+β(1−µ)] −1
· 2A(1−µ)
+
£ ¢ ¤3
4(1+β)+2βA(1−µ)(1+β)2 +2A(1+β) 1−β(1−µ)
¤
¸
2β(2+A)+β 2 A(1−µ)(3+β)−(1+β)
£ ¡
¢ ¤3
β 1+A[1+β(1−µ)] −1
>0
(B.4)