International Journal of Computer Theory and Engineering, Vol. 5, No. 6, December 2013
Customer Segmentation Using Clustering and Data Mining Techniques Kishana R. Kashwan, Member, IACSIT, and C. M. Velu
frontier research topic in computer science and engineering. For clustering method, the most important property is that a tuple of particular cluster is more likely to be similar to the other tuples within the same cluster than the tuples of other clusters. For classification, the similarity measure is defined as sim (ti, tl), between any two tuples, ti , tj D. For a given cluster, Km of N points {tml, tm2 ... tmN}, the centroid is defined as the middle of the cluster. Many of the clustering algorithms assume that the cluster is represented by centrally located one object in the cluster, called a medoid. The radius is the square root of the average mean squared distance from any point in the cluster to the centroid. We use the notation Mm to indicate the medoid for cluster Km. For given clusters Ki and Kj, there are several ways to determine the distance between the clusters. A natural choice of distance is Euclidean distance measure [5]. Single link is defined as smallest distance between elements in different clusters given by dis(Ki, Kj) = min(dist(ti1, tjm)) til Ki ¢ Kj and tjm Ki ¢ Kj. The complete link is defined as the largest distance between elements in different clusters given by dis (Ki, Kj) = max (dis (til, tjm)), til Ki ¢Kj and tjm Kj ¢Kj. The average link is the average distance between elements in different clusters. We thus have, dis(Ki, Kj) = mean(dis(til, tjm)), til Ki Kj, tjm Kj ¢Kj. If clusters are represented by centroids, the distance between two clusters is the distance between their respective centroids. We thus have, dis (Ki, Kj ) = dis (Ci, Cj), where Ci and Cj are the centroid for Ki and Kj respectively. If each cluster is represented by its medoid then the distance between the cluster can be defined as the distance between medoids which can be given as dis ( Ki , Kj )=dis (Mi, Mj ), where Mi and Mj are the Medoid for Ki and Kj respectively
Abstract—Clustering technique is critically important step in data mining process. It is a multivariate procedure quite suitable for segmentation applications in the market forecasting and planning research. This research paper is a comprehensive report of k-means clustering technique and SPSS Tool to develop a real time and online system for a particular super market to predict sales in various annual seasonal cycles. The model developed was an intelligent tool which received inputs directly from sales data records and automatically updated segmentation statistics at the end of day’s business. The model was successfully implemented and tested over a period of three months. A total of n = 2138, customer, were tested for observations which were then divided into k = 4 similar groups. The classification was based on nearest mean. An ANOVA analysis was also carried out to test the stability of the clusters. The actual day to day sales statistics were compared with predicted statistics by the model. Results were quite encouraging and had shown high accuracy. Index Terms—Cluster analysis, data mining, customer segmentation, ANOVA analysis.
I. INTRODUCTION Highlight Clustering is a statistical technique much similar to classification. It sorts raw data into meaningful clusters and groups of relatively homogeneous observations. The objects of a particular cluster have similar characteristics and properties but differ with those of other clusters. The grouping is accomplished by finding similarities among data according to characteristics found in raw data [1]. The main objective was to find optimum number of clusters. There are two basic types of clustering methods, hierarchical and non-hierarchical. Clustering process is not one time task but is continuous and an iterative process of knowledge discovery from huge quantities of raw and unorganized data [2]. For a particular classification problem, an appropriate clustering algorithm and parameters must be selected for obtaining optimum results. [3]. Clustering is a type of explorative data mining used in many application oriented areas such as machine learning, classification and pattern recognition [4]. In recent times, data mining is gaining much faster momentum for knowledge based services such as distributed and grid computing. Cloud computing is yet another example of
II. K-MEANS CLUSTERING TECHNIQUE The algorithm is called k-means due to the fact that the letter k represents the number of clusters chosen. An observation is assigned to a particular cluster for which its distance to the cluster mean is the smallest. The principal function of algorithm involves finding the k-means. First, an initial set of means is defined and then subsequent classification is based on their distances to the centres [6]. Next, the clusters’ mean is computed again and then reclassification is done based on the new set of means. This is repeated until cluster means don’t change much between successive iterations [7]. Finally, the means of the clusters once again calculated and then all the cases are assigned to the permanent clusters. Given a set of observations (x1, x2,….., xn), where each observation xi is a d-dimensional real vector. The k-means clustering algorithm aims to partition the n observations into k
Manuscript received December 25, 2012; revised February 28, 2013. Kishana R. Kashwan is with the Department of Electronics and Communication Engineering–PG, Sona College of Technology (An Autonomous Institution Affiliated to Anna University), TPT Road, Salem-636005, Tamil Nadu, India (e-mail:
[email protected],
[email protected]). C. M. Velu is with the Department of CSE, Dattakala Group of Institutions, Swami Chincholi, Daund, Pune–413130, India (e-mail:
[email protected]).
DOI: 10.7763/IJCTE.2013.V5.811
856
International Journal of Computer Theory and Engineering, Vol. 5, No. 6, December 2013
groups of observations called clusters where k ≤ n, so as to minimize the sum of squares of distances between observations within a particular cluster [8]. As shown in Table I, the sum of squares of the distance may be given by the equation arg min S = Σi=1Σsj si ||xj – μj||2, where μi is the mean of points in Si. Given an initial set, k-means computes initial means m1 (1),…,mk(1) and it identifies k clusters in given raw data set.
updating cluster centroid. This is repeated until SSE is reached to a minimum value or becomes constant without changing further, a condition similar to congruence. The SSE is represented mathematically by SSE = Σi=1(μi - x)2 where μi is the centroid of ith cluster represented by ci and x is any point in the same cluster. A condition for achieving minimum SSE can be easily computed by differentiating SSE, setting it equal to 0 and then solving the equation [12].
SSE k
TABLE I: K-MEANS ALGORITHM Simplified simulation flow of k-means algorithm Begin Inputs: X = (x1, x2,….., xn) Determine: Clusters – k Initial Centroids - C1, C2,….., Ck Assign each input to the cluster with the closest centroid Determine: Update Centroids - C1, C2,….., Ck Repeat: Until Centroids don’t change significantly (specified threshold value) Output: Final Stable Centroids - C1, C2,….., Ck End
k
k
i 1
( i x )
2
( i x ) 2 k
i 1
xci
2 ( i xk ) 0
xck
xk
k
mk k
xci
xci
Here mk is total number of elements and μK is centroid in kth cluster ck. Further it can be simplified as –
k
In most of the cases, k-means is quite slow to converge. For very accurate conditions, it takes quite a long time to converge exponentially. A reasonable threshold value may be specified for conversing in most of the cases to produce quick results without compromising much accuracy [9]. As shown in Table II, the Sum of Square of Errors (SSE) may be considerably reduced by defining more number of clusters. It is always desirable to improve SSE without increasing number of clusters which is possible due to the fact that k-means converges to a local minimum [10]. To decrease SSE, a cluster may be split or a new cluster centroid may be introduced. TABLE II: BISECTING OF K-MEANS ALGORITHM Bisecting sequence of k-means algorithm Begin Initialize clusters Do: Remove a cluster from list Select a cluster and bisect it using k-means algorithm Compute SSE Choose from bisected clusters one with least SSE Add bisected clusters to the list of clusters Repeat: Until the number of cluster have been reached to k End
To increase SSE, a cluster may be dispersed or two clusters may be merged. To obtain k-clusters from a set of all observation points, the observation points are split into two clusters and again one of these clusters is split further into two clusters. Initially a cluster of largest size or a cluster with largest SSE may be chosen for splitting process. This is repeated until the k numbers of clusters have been produced. Thus it is easily observable that the SSE can be changed by splitting or merging the clusters [11]. This specific property of the k-means clustering is very much desirable for marketing segmentation research. The new SSE is again computed after 857
1 mk
xck
xk
This concludes that the minimum SSE can be achieved under the condition of the centroid of the cluster being equal to the mean of the points in the kth cluster ck.
III. MARKET SEGMENTATION SURVEY The market segmentation is a process to divide customers into homogeneous groups which have similar characteristics such as buying habits, life style, food preferences etc. [13]. Market segmentation is one of the most fundamental strategic planning and marketing concepts wherein grouping of people is done under different categories such as the keenness, purchasing capability and the interest to buy. The segmentation operation is performed according to similarity in people in several dimensions related to a product under consideration. The more accurately and appropriately the segments performed for targeting customers by a particular organization, the more successful the organization is in the marketplace. The main objective of market segmentation is accurately predicting the needs of customers and thereby intern improving the profitability by procuring or manufacturing products in right quantity at time for the right customer at optimum cost. To meet these stringent requirements k-means clustering technique may be applied for market segmentation to arrive at an appropriate forecasting and planning decisions [14]. It is possible to classify objects such as brands, products, utility, durability, ease of use etc with cluster analysis [15]. For example, which brands are clustered together in terms of consumer perceptions for a positioning exercise or which cities are clustered together in terms of income, qualification etc. [16]. The data set consisted of usages of brands under different conditions, demographic variables and varying attitudes of the customers. The respondents constituted a representative random sample of 2138 as data points from customer transactions in a retail super market where various household
International Journal of Computer Theory and Engineering, Vol. 5, No. 6, December 2013
products were sold to its customers. The survey was carried for a period of about 3 months. The modelling and testing of market segmentation using clustering for forecasting was based on the customers of a leading super market retail house hold supplier located at Chennai branch, India. The organization’s name and the variables directly related to the organization are deliberately suppressed to maintain confidentiality as per our agreement. It was required to map the profile of the target customers in terms of lifestyle, attitudes and perceptions. The main objective was to measure important variables or factors which can lead to vital inputs for decision making in forecasting. The survey contained 15 different questionnaires as given below in Table III.
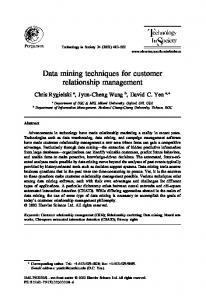
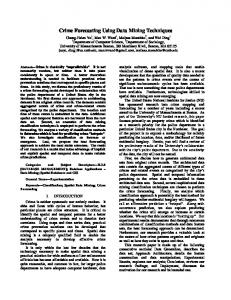
preferred emails to writing letters whereas 306 customers only agreed that they preferred email. Similarly 541 customers strongly disagreed with the idea of emails, may be they didn’t have access to internet or otherwise and so on. Graphical response for 5 scale point is shown in Fig. 1. The cluster mapping visualization of response matrix is illustrated in Fig. 2, which shows that distribution of the responses is quite wide and scattered but fairly uniform.
TABLE III: VARIABLES CHOSEN Different variables used for marketing segmentation Var1: Prefer email to writing a letter Var2: Feel that quality products are priced higher Var3: Think wisely before buying anything
Fig. 1. Response of customer on the five point scale.
Var4: Television is a major source of entertainment Var5: A entertainment is a necessity rather than a luxury Var6: Prefers fast food and ready-to-use products Var7: More health-conscious Var8: Competition improves the quality Var9: Women are active participants in purchase Var10:The advertisements can play a positive role Var11: Enjoy watching movies Var12: Like modern style and fashion Var13: Prefers branded products Var14: Prefer outing on weekends Var15: Prefer to pay by credit card than cash
Fig. 2. Customer response mapping for questionnaire.
TABLE IV: CUSTOMER RESPONSE ON THE SCALE OF FIVE POINTS Variable Strongly Agree No Disagree Strongly agree (5) (4) Opinion (2) disagree (3) (1) Var1 Var2 Var3 Var4 Var5 Var6 Var7 Var8 Var9 Var10 Var11 Var12 Var13 Var14 Var15
412 334 513 339 232 534 116 448 530 602 517 863 652 414 324
306 606 751 628 723 430 831 727 419 223 320 403 161 629 546
557 216 304 433 344 636 213 223 631 749 763 151 754 237 430
322 737 427 501 642 302 622 552 330 310 104 311 348 712 613
TABLE V: INITIAL AND FINAL CONVERGED CUSTOMER CENTERS Variable Initial Cluster Centre Final Cluster Centre Var1 Var2 Var3 Var4 Var5 Var6 Var7 Var8 Var9 Var10 Var11 Var12 Var13 Var14 Var15
541 245 143 237 197 236 356 188 228 254 434 410 223 146 225
1
2
3
4
1
2
3
4
1 3 5 4 3 5 3 2 3 2 4 1 1 1 5
4 5 1 4 5 4 5 1 1 5 3 3 5 5 2
4 3 3 2 1 2 1 5 2 2 4 5 1 1 2
3 2 1 5 3 4 4 2 1 2 1 2 2 4 4
1.80 2.60 3.40 2.80 3.20 4.40 2.40 3.00 3.80 3.40 3.60 2.00 2.20 2.20 4.60
3.13 3.50 2.50 3.25 3.88 3.25 4.38 2.00 2.63 3.80 3.13 3.63 4.00 3.88 2.75
2.80 2.20 3.20 2.60 2.60 3.40 1.40 4.60 1.80 3.00 4.20 3.60 2.40 2.40 1.80
4.00 1.50 1.00 5.00 2.00 3.00 4.00 2.00 1.50 3.00 2.50 2.50 2.50 3.50 3.00
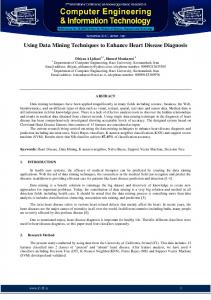
Further on, the clustering was carried out as explained in Section II. The value of k was chosen as 4 and it was desired to know that what kind of 4 groups existed in the data set of customer response matrix. For the values given in Table IV, k-means clustering is computed by using standard SPSS package. Table V shows initial and finally converged cluster centers with their means. The initial cluster visualization is shown in Fig. 3 with observation of quite scattered distribution. Initial centers were randomly selected, thus had wide variations and then SPSS
A five point rating scale was used to represent variables in segmentation. For this, the customers were asked to give their response in categories of strongly agree as 5, agree as 4, No Opinion as 3, disagree as 2 and strongly disagree as 1. The Euclidean distance was used to measure the clustering analysis. Euclidean distance is ideally suitable for similar interval scaled variables. The input data matrix of 2138 respondents with 15 variables is shown in Table IV. This could be explained as 412 customers strongly agreed that they 858
International Journal of Computer Theory and Engineering, Vol. 5, No. 6, December 2013
remaining other variables are statistically significant as they all have probabilities > 0.10.
iterations were performed until there was no significant change in the position of cluster centers. This condition is called as convergence and as a result of it, finally refined and stable cluster centers, as illustrated in Fig. 4, was achieved.
Fig. 3. Initial clusters distribution as chosen randomly.
Fig. 4. Final clusters distribution as computed by SPSS.
IV. STATISTICAL SIMULATION TESTS There are many statistical tests which are normally used to perform the clustering process. In statistics, quite often a very important tool called Analysis of Variance (ANOVA) is employed for various analysis and data processing including clustering and data mining. ANOVA test gives suitable inference while splitting and merging the clusters dynamically. The stability of the clusters can be checked through splitting the sample and repeating the cluster analysis. Typically an ANOVA consists of various statistical models and their related procedures, in which variance is observed in a particular random variable. The variance is divided into different components which can be attributed to different sources of variation in random variable. The ANOVA is invariably used in comparing more than one means or centroids. In its simplest form ANOVA provides a statistical test of whether or not the means or centroids of several groups of random variables are all equal or not. The ANOVA statistics applied on data collected for marketing segmentations is listed in Table VI. It was very clear from that statistic test that which of the 15 chosen variables were significantly different across the 4 final clusters obtained by k-means clustering as shown in Table VI. The last column indicates that the variables 2, 7, 8, 10, 11, 12 and 13 are insignificant at the confidence level of 0.10 since all the probabilities of these variables are < 0.10. The 859
Variable
TABLE VI: ANOVA ANALYSIS Cluster MS Error MS F-Statistic
P-value
VAR-1 VAR-2 VAR-3 VAR-4 VAR-5 VAR-6 VAR-7 VAR-8 VAR-9 VAR-10 VAR-11 VAR-12 VAR-13 VAR-14 VAR-15
3.050 3.072 2.572 1.633 2.505 1.705 9.650 8.550 1.300 5.556 2.738 4.083 7.255 1.622 2.850
0.114 0.071 0.234 0.201 0.238 0.365 0.000 0.000 0.567 0.002 0.082 0.054 0.001 0.480 0.163
1.315 1.083 1.630 0.943 1.605 1.505 0.390 0.681 1.865 0.730 1.020 1.293 0.799 1.880 1.465
2.318 2.835 1.577 1.730 1.560 1.133 24.704 12.550 0.696 7.539 2.683 3.156 9.081 0.862 1.944
The Table V shows the difference between initial and final centers. It can be observed that there is a difference of 0.8 in the coefficients between the cluster-3 solution of initial stage and final stage for variable 2. The highest difference is 1.6, between initial stage and final stage of cluster-1 of variable 3. Cluster formation is spatially quite different for initial and final stages as illustrated in Fig. 3 and Fig. 4. For market segmentation problem, Table IV gives the outputs of k-means clustering for the k = 4 (chosen value) for stable and refined final cluster centers. Subsequently null hypothesis is tested by using ANOVA method as illustrated by Table VI. This can be explained further as cluster-1 is described by the mean value of 1.80 for Var1. Similarly the mean value is 2.60 for Var2 and 3.40 for Var3 and so on. In the same way cluster-2 is described by the mean of 3.13 for Var1, 3.50 for Var2 and 2.50 for Var3 and so on. The 15 variables were taken into consideration and tried to interpret the significance of the clusters formed thereof. The graphical illustration of ANOVA analysis is depicted in Fig. 5 for chosen statistical values of cluster mean, mean square error, F-statistics and P-value.
Fig. 5. Statistical distribution analysis of clusters.
For example, for cluster-1, the mean of 1.80 for Var1 interprets that people prefer email. Similarly, a mean of 3.40 for Var3 indicates that the peoples are careful while spending.
International Journal of Computer Theory and Engineering, Vol. 5, No. 6, December 2013
The mean of 2.60 for Var2 says that the quality products come always at higher price. For these same variables, cluster-2 shows that people prefer conventional letters to e-mail which is indicated by the mean of 3.13 for Var1. The people who do not prefer high price for good quality is shown by the mean of 3.50 for Var2 and tend to be neutral about care in spending with mean of 2.50 for Var3. Similarly, the variables for cluster-3 and cluster-4 can be compared. For the given market segmentation problem, 4 clusters were analyzed for various consideration. Cluster-1 indicated that the variables which were included in this cluster namely, variable1es 1, 2, 5, 12, 13, 14 not like variables 4, 6, 9, 11, 15 and not sure of variable 7. The derived inference from this was thus exhibiting many traditional values, except that they had adopted to email use. They had also begun to spend more liberally and were probably in the transition process of few other factors like acceptance of women as decision makers and more use of credit cards as convenience. Cluster-2 indicated that the variables found in the clusters, namely, 1, 5, 8, 9, 15 were not in the same statistical characteristics as compared to variables 3, 4, 6, 7, 10, 11, 12, 13, 14. They believed in negotiations or were aggressive buyers. It could be concluded that, it was a group which liked to use credit cards, spent more freely, believed in women power, believed in economics rather than politics and felt quality products could be worth purchasing. Also, they seemed to have taste of modern life style and were fashion oriented. Cluster-4 gave out an analysis that the variables 2, 4, 5, 7, 10 belong to this cluster, had opposite statistical characteristics to the variable 1, 3, 6, 8, 11, 12, 13 and were neutral in comparison to variables 14, 15. It was concluded that, this group was optimistic, free spending and a good target for TV advertising, particularly consumer durables items and entertainment. But they need not to get necessarily influenced by brands. They wanted value for money, in case if they understood that the item was worth, they would tend to buy the same.
further illustrations of using cluster method for market segmentation for forecasting. Computing based system developed was an intelligent and it automatically presented results to the mangers to infer for quick and fast decision making process. The simulation tests were also computed for cluster brands and other characteristics of the cluster representing a particular class of people. The future work will involve more trials and automation of the market forecasting and planning ACKNOWLEDGMENT The authors feel deeply indebted and thankful to all who opined for technical knowhow and helped in collection of market data. Authors also feel thankful to all customers who volunteered for feedback and transactional information. Authors feel thankful to their family members for constant support and motivation. REFERENCES [1]
[2]
[3]
[4]
[5]
[6] [7]
[8]
[9]
[10]
V. CONCLUSION AND DISCUSSIONS In summary, the cluster analysis of the chosen sample of respondents explained a lot about the possible segments which existed in the target customer population. Once the number of clusters was identified, a k-means clustering algorithm, which is a non-hierarchical method, was used. For computing k-means clustering, the initial cluster centers were chosen and then final stable cluster centers were computed by continuing number of iterations until means had stopped further changing with next iterations. This convergent condition was also achieved by setting a threshold value for change in the mean. The final cluster centers contained the mean values for each variable in each cluster. Also, this was interpreted in multi-dimensional projections related to market forecasting and planning. To check the stability of the clusters, the sample data was first split into two parts and was checked that whether similar stable and distinct clusters emerged from both the sub-samples. These analyses at the end provided 860
[11]
[12]
[13]
[14]
[15]
[16]
I. S. Dhillon and D. M. Modha, “Concept decompositions for large sparse text data using clustering,” Machine Learning, vol. 42, issue 1, pp. 143-175, 2001. T. Kanungo, D. M. Mount, N. S. Netanyahu, C. D. Piatko, R. Silverman, and A. Y. Wu, “An efficient K-means clustering algorithm,” IEEE Trans. Pattern Analysis and Machine Intelligence, vol. 24, pp. 881-892, 2002. MacKay and David, “An Example Inference Task: Clustering,” Information Theory, Inference and Learning Algorithms, Cambridge University Press, pp. 284-292, 2003. M. Inaba, N. Katoh, and H. Imai, “Applications of weighted Voronoi diagrams and randomization to variance-based k-clustering,” in Proc.10th ACM Symposium on Computational Geometry, 1994, pp. 332-339. D. Aloise, A. Deshpande, P. Hansen, and P. Popat, “NP-hard Euclidean sum-of-squares clustering,” Machine Learning, vol. 75, pp. 245-249, 2009. S. Dasgupta and Y. Freund, “Random Trees for Vector Quantization,” IEEE Trans. on Information Theory, vol. 55, pp. 3229-3242, 2009. M. Mahajan, P. Nimbhorkar, and K. Varadarajan, “The Planar K-Means Problem is NP-Hard,” LNCS, Springer, vol. 5431, pp. 274-285, 2009. A. Vattani, “K-means exponential iterations even in the plane,” Discrete and Computational Geometry, vol. 45, no. 4, pp. 596-616, 2011. C. Elkan, “Using the triangle inequality to accelerate K-means,” in Proc. the 12th International Conference on Machine Learning (ICML), 2003. H. Zha, C. Ding, M. Gu, X. He, and H. D. Simon, “Spectral Relaxation for K-means Clustering,” Neural Information Processing Systems, Vancouver, Canada, vol.14, pp. 1057-1064, 2001. C. Ding and X.-F. He, “K-means Clustering via Principal Component Analysis,” in Proc. Int'l Conf. Machine Learning (ICML), 2004, pp. 225-232. P.-N. Tan, V. Kumar, and M. Steinbach, Introduction to Data Mining, Pearson Educatio Inc. and Dorling Kindersley (India) Pvt. Ltd., New Delhi and Chennai Micro Print Pvt. Ltd., India, 2006. D. D. S. Garla and G. Chakraborty, “Comparison of Probabilistic-D and k-Means Clustering in Segment Profiles for B2B Markets,” SAS Global Forum 2011, Management, SAS Institute Inc., USA. H.-B. Wang, D. Huo, J. Huang, Y.-Q. Xu, L.-X. Yan, W. Sun, X.-L. Li, and Jr. A. R. Sanchez, “An approach for improving K-means algorithm on market segmentation,” in Proc. International Conference on Systme Science and Engineering (ICSSE), IEEE Xplore, 2010. H. Hruschka and M. Natter, “Comparing performance of feedforward neural nets and K-means for cluster-based market segmentation,” European Journal of Operational Research, Elsvier Science, vol. 114, pp. 346-353, 1999. P. Ahmadi, “Pharmaceutical Market Segmentation Using GAK-means,” European Journal of Economics, Finance and Administrative Sciences, issue 22, 2010.
International Journal of Computer Theory and Engineering, Vol. 5, No. 6, December 2013 Kishana R. Kashwan received the degrees of M. Tech. in Electronics Design and Technology and Ph.D. in Electronics and Communication Engineering from Tezpur University (a central university of India), Tezpur, India, in 2002 and 2007 respectively. Presently he is a professor and Dean of Post Graduate Studies in the department of Electronics and Engineering (Post Graduate Studies), Sona College of Technology (An Autonomous Institution Affiliated to Anna University), TPT Road, Salem–636005, Tamil Nadu, India. He has published extensively at international and national level and has travelled to many countries. His research areas are VLSI Design, Communication Systems, Circuits and Systems and SoC / PSoC. He is also director of the Centre of Excellence in VLSI Design and Embedded SoC at Sona College of Technology. He is a member of Academic Council, Research Committee and Board of Studies of Electronics and Communication Engineering at Sona College of Technology. He has successfully guided many scholars for their master’s and doctoral theses. Kashwan has completed many funded research projects. Currently,
861
he is working on a few funded projects from Government of India. Dr. Kashwan is a member of IEEE, IASTED and Senior Member of IACSIT. He is a life member of ISTE and Member of IE (India).
C. M. Velu received his M. E in CSE from Sathyabama University. He is currently pursuing his doctoral program under the faculty of Information and Communication Engineering registered at Anna University Chennai, India. He has visited UAE as a Computer faculty. He served as faculty of CSE for more than two and half decades. He has published many research papers in international and national journals. His areas of interest are Data Warehousing and Data Mining, Artificial Intelligence, Artificial Neural Networks, Digital Image Processing and Pattern Recognition.