predicting corporate bankruptcy and financial distress has become a ... purposes of bankruptcy prediction, going concern status and financial distress prediction,.
ijcrb.webs.com
APRIL 2012
INTERDISCIPLINARY JOURNAL OF CONTEMPORARY RESEARCH IN BUSINESS
VOL 3, NO 12
DATA MINING TECHNIQUES AND PREDICTING CORPORATE FINANCIAL DISTRESS Mahmoud Mousavi Shiri1, Mohammad Taghi Amini2, Mohammad Boland Raftar3 1, 2, 3
Department of Economics and Social Science, Payame Noor University,PO BOX 19395-4697 Tehran, I.R. of Iran
Abstract Financial distress is the most notable distress for companies. During the last four decades predicting corporate bankruptcy and financial distress has become a significant concern for the various stakeholders in firms. Data mining tools become important in finance and accounting. Their classification and prediction abilities enable them to be used for the purposes of bankruptcy prediction, going concern status and financial distress prediction, management fraud detection, credit risk estimation, and corporate performance prediction. This paper reviews four techniques: Support Vector Machines, Artificial Neural Networks, kNearest Neighbor and Naïve Bayesian Classifier for predicting financial distress. Key words: Predicting corporate financial distress- Support Vector Machines- Artificial Neural Networks- k-Nearest Neighbor- Naïve Bayesian Classifier 1. Introduction Nowadays, with the globalization of the world economy, competition has become one of the basic mechanisms of market. Business organization with management deficiency and lack of innovation may fail to win in the competitive environment full of uncertainty. Consequently, an enterprise might encounter various crises such as marketing crisis, human resource crisis, crediting crisis, innovation crisis, and so on, which may finally lead to financial distress and even bankruptcy (Sun & Li, 2009). Financial distress is the most synthetic and notable distress for companies. With the gradually perfection of stock market mechanisms and bankruptcy laws, financial distress not only makes the company suffer great economic loss but also directly affect its survival and development. Besides, when many companies run into financial distress in the same period, it is possible to result in a new financial crisis in capital market. So how to help companies effectively predict financial distress has become a hot research topic in both academic and practical world (Sun & Li, 2008). Considering the increasing number of financially distressed companies, which would lead to more bankrupt companies, the need to predict the financial future of companies becomes more important. Therefore, financial distress prediction models have become important decision aids for organizations’ stakeholders, including auditors, creditors and shareholders. Since the criterion variable is categorical, bankrupt or non-bankrupt, the problem is one of classification. Thus, discriminant analysis, Logit and Probit models have been typically used for this purpose. However, the validity and effectiveness of these conventional statistical methods depend largely on some restrictive assumptions such as the linearity, normality, independence among predictor variables and a pre-existing functional form relating the criterion variable and predictor variables. These traditional methods work best only when all or most statistical assumptions are apt (Zhang et al., 1999). Recent studies on data mining techniques show that these methods are powerful tools for pattern recognition and pattern classification, due to their nonlinear nonparametric adaptivelearning properties. In the present study four well known classification methods, derived from the field of data mining, are argued for predicting of financial distress. The employed methods are COPY RIGHT © 2012 Institute of Interdisciplinary Business Research
61
ijcrb.webs.com
INTERDISCIPLINARY JOURNAL OF CONTEMPORARY RESEARCH IN BUSINESS
APRIL 2012
VOL 3, NO 12
Support Vector Machines (SVM), Artificial Neural Networks (ANN), k-Nearest Neighbor (KNN) and Naïve Bayesian Classifier (NBC). 2. Literature Review Bankruptcy/financial distress prediction has become a critical accounting and finance research area since 1960s. The history of bankruptcy/financial distress prediction models may be divided into two main periods. During the first, which goes from the late 1960’s to the late 1980’s, research relied largely on discriminant analysis and logistic regression as methods of building the most accurate models. Early studies of bankruptcy prediction used statistical techniques. Beaver (1966), one of the first researchers to study bankruptcy prediction, carried out three different univariate analyses- profile analysis, dichotomous classification test and likelihood ratio analysis- in order to examine the predictive power and utility of each variable. Altman (1968) followed Beaver and began to use multiple discriminant analysis (MDA) to identify companies into known categories. He developed a bankruptcy prediction model called Z-score to classify healthy and bankrupt firms and concluded that bankruptcy could be explained quite completely by a combination of five financial ratios. After Altman, Sinkey (1975) used MDA and Meyer & Pifer (1970) used Multivariate Regression Analysis (MRA) successfully. Ohlson (1980) was the first who applied logistic regression (Logit) model for predicting bankruptcy, and Zmijewski (1984) used Probit model to predict financial distress. Although these statistical methods showed good accuracy, they suffered from major drawbacks and the real input output variables dependency. Therefore, it gradually became clear that other methods should be studied and used to create bankruptcy/financial distress models. The second period begins in the late 1980’s, when many authors, in attempts to overcome the limitations described above, undertook research to assess the ability of non-parametric methods to accurately predict the risk of bankruptcy or the risk of financial failure. During this period non-linear techniques such as Artificial Neural Networks (ANN), Support Vector Machines (SVM), k-Nearest Neighbor (KNN) and Naïve Bayesian Classifier (NBC) emerged in this field of research and demonstrated their frequent ability to outperform most existing techniques. The first attempt to use ANN to predict bankruptcy was made by Odom and Sharda (1990). Zhang et al. (1999) compared ANN model’s performance with a Logit model. The ANN significantly outperformed the Logit regression model. In the late 1990s, SVM was introduced to cope with the classification problems. Fan and Palaniswami (2000) applied SVM to select the financial distress predictors. Following them Häardle, Moro, & Schäafer (2003) used SVM for bankruptcy prediction and concluded SVM were capable of extracting useful information from financial statements. Recent studies in Artificial Intelligence (AI) approach, such as ANN (Tsai, 2008) (Ravisankar & Ravi 2010), SVM (Lin et al. 2011, and Min & Lee 2005), KNN (Park & Han 2002 , and Bian & Mazlack, 2003) and Bayesian network models (Sarkar & Sriram 2001, and Sun & Shenoy 2007) have also been successfully applied to bankruptcy/financial distress prediction. 3. Support Vector Machines Support vector machines (SVM) are supervised learning methods used for classification. SVMs are used for classifying sets of samples into two or more disjoint classes, which are separated by a hyperplane defined in a suitable space (Mucherino et al., 2009). Since SVM was introduced from statistical learning theory by Vapnik, a number of studies have been announced concerning its theory and applications. Compared with most other learning techniques, SVM lead to increase performance in pattern recognition, regression estimation,
COPY RIGHT © 2012 Institute of Interdisciplinary Business Research
62
ijcrb.webs.com
APRIL 2012
INTERDISCIPLINARY JOURNAL OF CONTEMPORARY RESEARCH IN BUSINESS
VOL 3, NO 12
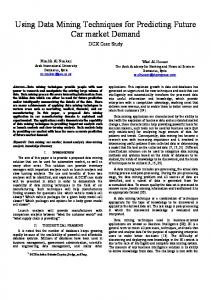
and so on; financial time-series forecasting, marketing, estimating manufacturing yields, text categorization, face detection using image, hand written digit recognition and medical diagnosis. SVM produces a binary classifier, the so-called optimal separating hyperplanes, through extremely non-linear mapping the input vectors into the high-dimensional feature space. It constructs linear model to estimate the decision function using non-linear class boundaries based on support vectors. If the data is linearly separated, SVM trains linear machines for an optimal hyperplane that separates the data without error and into the maximum distance between the hyperplane and the closest training points. The training points that are closest to the optimal separating hyperplane are called support vectors. All other training examples are irrelevant for determining the binary class boundaries. In general cases where the data is not linearly separated, SVM uses non-linear machines to find a hyperplane that minimize the number of errors for the training set (Shin et al., 2005).
Fig. 1. The separating hyperplane Figure 1 illustrates the principle of the separation with the maximum margin for a linear SVM in a separable and a non-separable case. The margin is the gap between the opposite classes of observations. In the linearly separable case (the left panel) the margin
. The separating rule here is linear:
Here w is a vector of weights that define the slope of the separating hyperplane and b is a scalar called the threshold. In a linearly perfectly separable case no observations can be located inside the margin gap, i.e. all observations must satisfy the constraints (1) (2) In a linearly non-separable case (Figure 1, right panel) a so called slack variable is introduced to account for misclassifications. It is proportional to the distance from a misclassified observation to the boundary of its class and modifies constraints (1) and (2) in such a way that they still hold for all observations :
COPY RIGHT © 2012 Institute of Interdisciplinary Business Research
63
ijcrb.webs.com
APRIL 2012
INTERDISCIPLINARY JOURNAL OF CONTEMPORARY RESEARCH IN BUSINESS
VOL 3, NO 12
(3) (4) The observations marked with bold crosses and zeros in Figure 1 are called support vectors because only they describe or “support” the separating hyperplane. (Lacerda & Moro, 2008) 4. Artificial Neural Networks An artificial neural network (ANN), often just called a neural network, is a mathematical model based on biological neural networks, in other words, is an emulation of biological neural system. ANNs can be used as data mining techniques for classification. They are developed and organized in such a way that they are able to learn and generalize from data and experience. In general, ANNs are used for modeling functions having an unknown mathematical expression. They consist in a number of independent and simple processors: the neurons. The network is formed by neurons, which are connected and usually organized in layers. All these neuron properties are represented mathematically by real numbers. Each link or connection between neurons has an associated weight, which determines the effect of the incoming input on the activation level of the neuron (Mucherino et al., 2009). Like in any statistical model, the parameters (arc weights) of a neural network model need to be estimated before the network can be used for prediction purposes. The process of determining these weights is called training. The training phase is a critical part in the use of neural networks. For classification problems, the network training is a supervised one in that the desired or target response of the network for each input pattern is always known a priori (Zhang et al.,1999). The most frequently used algorithm for training process is the Back Propagation Algorithm (BPA). BPA first calculates the difference between the expected output value and the observed output value (called error) in the output layer and then distributes the error back to the network with a weight. The next step is to adjust the weight to reduce the error. The same process is repeated for all cases, called an epoch. After several epochs training, the learning error will reduce to a minimum level and the training process ends. The most popular ANN algorithm in the financial distress prediction domain is the multilayer perceptron (MLP) (Hu & Ansell 2005). MLP is the kind of ANNs that has the neurons organized in layers, one input layer, one or multiple hidden layers and one output layer. Figure 2 shows an example of a multilayer perceptron. A network having n neurons in the input layer and m neurons in the output layer can be used for describing a function having n independent variables and m dependent variables (Mucherino et al., 2009).
Fig. 2. Multilayer perceptron general scheme.
COPY RIGHT © 2012 Institute of Interdisciplinary Business Research
64
ijcrb.webs.com
INTERDISCIPLINARY JOURNAL OF CONTEMPORARY RESEARCH IN BUSINESS
APRIL 2012
VOL 3, NO 12
5. k-Nearest Neighbor The k-nearest neighbor (KNN) method uses the well-known principle of equals with equals easily associate. It tries to classify an unknown sample based on the known classification of its neighbors. Suppose that a set of samples with known classification is available, the so-called training set. Intuitively, each sample should be classified similarly to its surrounding samples. Therefore, if the classification of a sample is unknown, then it could be predicted by considering the classification of its nearest neighbor samples. Given an unknown sample and a training set, all the distances between the unknown sample and all the samples in the training set can be computed. The distance with the smallest value corresponds to the sample in the training set closest to the unknown sample. Therefore, the unknown sample may be classified based on the classification of this nearest neighbor. However, in general, this classification rule can be weak, because it is based on one known sample only. It can be accurate if the unknown sample is surrounded by several known samples having the same classification. Instead, if the surrounding samples have different classifications, then the accuracy of the classification may decrease. In order to increase the level of accuracy, then, all the surrounding samples should be considered and the unknown sample should then be classified accordingly. In general, the classification rule based on this idea simply assigns to any unclassified sample the class containing most of its k nearest neighbors. This is the reason why this data mining technique is referred to as the KNN (k-nearest neighbors). If only one sample in the training set is used for the classification, then the 1-NN rule is applied. Figure 3 shows the KNN decision rule for k = 1 and k = 4 for a set of samples divided into 2 classes. In Figure 3(a), an unknown sample is classified by using only one known sample; in Figure 3(b) more than one known sample is used. In the last case, the parameter k is set to 4, so that the closest four samples are considered for classifying the unknown one. Three of them belong to the same class, whereas only one belongs to the other class. In both cases, the unknown sample is classified as belonging to the class on the left.
Fig. 3. (a) The 1-NN decision rule: the point? Is assigned to the class on the left; (b) the KNN decision rule, with k = 4: the point? Is assigned to the class on the left as well. The distance function plays a crucial role in the success of the classification. Indeed, the most desirable distance function is the one for which a smaller distance among samples implies a greater likelihood for samples to belong to the same class. The choice of this function may not be trivial. Another important factor is the choice of the value for the parameter k. This is the main parameter of the method, since it represents the number of nearest neighbors considered for classifying an unknown sample. Usually it is fixed beforehand, but selecting an appropriate value for k may not be trivial. If k is too large, classes with a great number of classified samples can overwhelm small ones and the results will be biased. On the other hand, if k is too small, the advantage of using many samples in the training set is not exploited (Mucherino et al., 2009).
COPY RIGHT © 2012 Institute of Interdisciplinary Business Research
65
ijcrb.webs.com
APRIL 2012
INTERDISCIPLINARY JOURNAL OF CONTEMPORARY RESEARCH IN BUSINESS
VOL 3, NO 12
6. Naïve Bayesian Classifier
A Naive Bayesian Classifier (NBC) is well known in the machine learning community (Stibor, 2010). It is one kind of Bayesian classifier, which is now recognized as a simple and effective probability classification method (Jie & Bo, 2011), and works based on applying Bayes' theorem with strong (naive) independence assumptions. The NBC is particularly suited when the dimensionality of the inputs is high. Despite its simplicity, Naive Bayes can often outperform more sophisticated classification methods (Hill, & Lewicki, 2007). In simple terms, a NBC assumes that the presence (or absence) of a particular feature of a class is unrelated to the presence (or absence) of any other feature, given the class variable. Given feature variables F1, F2,…, Fn and a class variable C. The Bayes’ theorem states (5) Assuming that each feature
is conditionally independent of every other feature
for
one obtains (6)
The denominator serves as a scaling factor and can be omitted in the final classification rule (Stibor, 2010). (7)
COPY RIGHT © 2012 Institute of Interdisciplinary Business Research
=
| C= c)
66
ijcrb.webs.com
INTERDISCIPLINARY JOURNAL OF CONTEMPORARY RESEARCH IN BUSINESS
APRIL 2012
VOL 3, NO 12
References 1. Altman, E.I. (1968) "Financial ratios, discriminant analysis and the prediction of corporate bankruptcy", The Journal of Finance, 23(4): 589–609. 2. Beaver, W.H. (1966) "Financial Ratios as Predictors of Failure", Journal of Accounting Research, 4: 71-111. 3. Bian, H. & Mazlack, L. (2003) "Fuzzy-rough nearest-neighbor classification approach", 22nd International Conference of the North American Fuzzy Information Processing Society (NAFIPS 2003). 4. Fan, A. & Palaniswami, M. (2000) "A new approach to corporate loan default prediction from financial statements", Proceedings of the computational finance/forecasting financial markets conference (CF/FFM-2000), London, UK. 5. Lacerda, A. I. & Moro, R. A. (2008) "Analysis of the predictors of default for Portuguese firms", Estudos e Documentos de Trabalho, Working Paper. 6. Lin, F., Yeh, C.C. & Lee, M.Y. (2011) "The use of hybrid manifold learning and support vector machines in the prediction of business failure", Knowledge-Based Systems, 24(1): 95-101. 7. Häardle, W., Moro, R. & Schäafer, D. (2003) "Predicting corporate bankruptcy with support vector machines", Working Slide, Humboldt University and the German Institute for Economic. 8. Hill, T., Lewicki, P. (2007). STATISTICS: Methods and Applications. StatSoft, Tulsa, OK. 9. Hu, Y-C. & Ansell, J. (2006) "Developing Financial Distress Prediction Models: A Study of US, Europe and Japan Retail Performance", Management School and Economics, University of Edinburgh. Scotland. 10. Jie, L., Bo, S. (2011) "Naive Bayesian classifier based on genetic simulated annealing algorithm", Procedia Engineering, 23: 504 – 509. 11. Meyer, A.P. & Pifer, H.W. (1970) "Prediction of bank failures", The Journal of Finance, 25(4): 853-868. 12. Min, J.H. & Lee, Y.C. (2005) "Bankruptcy prediction using support vector machine with optimal choice of kernel function parameters", Expert Systems with Applications, 28(4): 603-614. 13. Mucherino, A., Papajorgji, P.J. & Pardalos, P.M. (2009) "Data mining in agriculture", New York: Springer. 14. Neves, J. C. & Vieira, A. (2006) "Improving bankruptcy prediction with hidden layer learning vector quantization", European Accounting Review, 15(2): 253–271. 15. Odom, M. & Sharda, R. (1990) "A neural networks model for bankruptcy prediction", Proceedings of the IEEE International Conference on Neural Network, 2: 163–168. 16. Ohlson, J.A. (1980) "Financial ratios and the probabilistic prediction of bankruptcy", Journal of Accounting Research, 18(1): 109–131. 17. Park, C.S. & Han, I. (2002) "A case-based reasoning with the feature weights derived by analytic hierarchy process for bankruptcy prediction", Expert Systems with Applications, 23(3): 255-264.
COPY RIGHT © 2012 Institute of Interdisciplinary Business Research
67
ijcrb.webs.com
INTERDISCIPLINARY JOURNAL OF CONTEMPORARY RESEARCH IN BUSINESS
APRIL 2012
VOL 3, NO 12
18. Ravisankar, P. & Ravi, V. (2010) "Financial distress prediction in banks using Group Method of Data Handling neural network", counter propagation neural network and fuzzy ARTMAP. Knowledge-Based Systems, 23(8): 823-831. 19. Sarkar, S. & Sriram, R.S. (2001) "Bayesian models for early warning of bank failures" Management Science, 47(11): 1457-1475. 20. Shin, K., Lee, T.S. & Kim, H. (2005) "An application of support vector machines in bankruptcy prediction model", Expert Systems with Applications, 28: 127-135. 21. Sinkey, J.F. (1975) "A multivariate statistical analysis of the characteristics of problem banks", Journal of Finance, 30: 21-36. 22. Stibor, T. (2010) "A Study of Detecting Computer Viruses in Real-Infected Files in the nGram Representation with Machine Learning Methods", 23rd international conference on Industrial engineering and other applications of applied intelligent systems, Volume Part I, 509-519. 23. Sun, L. & Shenoy P.P. (2007) "Using Bayesian networks for bankruptcy prediction: Some methodological issues", European Journal of Operational Research, 2007. 180(2): 738-753. 24. Sun, J., Li, H. (2008). "Listed companies’ financial distress prediction based on weighted majority voting combination of multiple classifiers." Expert Systems with Applications 35: 818–827. 25. Sun, J., Li, H. (2009) "Financial distress prediction based on serial combination of
multiple classifiers" Expert Systems with Applications 36: 8659–8666. 26. Tsai, C.F. (2008) "Financial decision support using neural networks and support vector machines", Expert Systems, 25(4): 380-393. 27. Zhang, G., Hu, M.Y., Patuwo, B.E. & Indro, D.C. (1999) " Artificial neural networks in bankruptcy prediction: General framework and cross-validation analysis" European Journal of Operational Research 116: 16-32. 28. Zmijewski, M.E. (1984) "Methodological issues related to the estimated of financial distress prediction models", Journal of Accounting Research, 22(1): 59–82.
COPY RIGHT © 2012 Institute of Interdisciplinary Business Research
68