This paper deals with the presentation of the benefits of using Data Mining techniques ... and accurately. In the field of the noninvasive diagnosis techniques,.
International Journal of Biological and Medical Sciences Volume 1 Number 2
Data Mining Techniques in Computer-Aided Diagnosis: Non-Invasive Cancer Detection Florin Gorunescu
information and scientific knowledge. Data mining can potentially help all physicians in a variety of ways, by helping interpret complex diagnostic tests, by combining information from multiple sources (sample movies, images, clinical data, proteomics, scientific knowledge), by providing support for differential diagnosis and providing patient-specific prognosis. Finally, we have to mention a sensitive issue concerning the Data mining application in real-life problems. Essentially, Data mining gives information that would not be available otherwise. It must be properly interpreted to be useful. When the data collected involves individual people, there are many questions concerning privacy, legality and ethics.
Abstract—Diagnosis can be achieved by building a model of a certain organ under surveillance and comparing it with the real time physiological measurements taken from the patient. This paper deals with the presentation of the benefits of using Data Mining techniques in the computer-aided diagnosis (CAD), focusing on the cancer detection, in order to help doctors to make optimal decisions quickly and accurately. In the field of the noninvasive diagnosis techniques, the endoscopic ultrasound elastography (EUSE) is a recent elasticity imaging technique, allowing characterizing the difference between malignant and benign tumors. Digitalizing and summarizing the main EUSE sample movies features in a vector form concern with the use of the exploratory data analysis (EDA). Neural networks are then trained on the corresponding EUSE sample movies vector input in such a way that these intelligent systems are able to offer a very precise and objective diagnosis, discriminating between benign and malignant tumors. A concrete application of these Data Mining techniques illustrates the suitability and the reliability of this methodology in CAD.
II. ENDOSCOPIC ULTRASOUND ELASTOGRAPHY Palpation of the body is the classical method used by physicians to detect the presence of abnormalities that might indicate pathological lesions, usually because the mechanical properties of diseased tissue are typically different from those of the normal tissue that surrounds them. Palpation is, however, inherently limited to organs that are close to the skin surface. Recently developed methods of management in cancer diseases to replace palpation include a routine use of biopsy of the affected organ. However, biopsy is an invasive method, with inherent complications that may cause even the death of the patient. Consequently, the use of non-invasive alternatives is highly necessary, moreover since competitive computational technologies, which can be successfully employed towards this purpose, are currently available. Because the mechanical properties of normal and diseased tissues are of pathological relevance, the development of a direct measure of tissue elasticity would be very important for the characterization of lesions, in addition to the information already obtained by conventional imaging methods. Endoscopic ultrasonographic elastography (EUSE) is a recent elasticity imaging technique that reveals directly the physical properties of tissues. The method characterizes the difference of hardness between diseased tissue and normal tissue. This information can recently be obtained during realtime scanning, the results being shown in colour superimposed on the conventional grey-scale image. Therefore, in the images resulted after scanning, colours express the difference of elasticity between healthy and diseased tissue [1]. Technically speaking, EUSE was developed to analyze structures in real time, with the information being represented
Keywords—Endoscopic ultrasound elastography, exploratory data analysis, neural networks, non-invasive cancer detection. I. INTRODUCTION
T
HE last century has seen an exponential increase in the accuracy and sensitivity of diagnostic tests, from observing external symptoms and using increasingly sophisticated laboratory tests and complex imaging methods that permit detailed non-invasive internal examinations. This improved accuracy has inevitably resulted in an exponential increase in the patient data available to the physician. Establishing a medical diagnosis is fundamentally a process of finding evidence to distinguish a probable cause of the patient's key symptoms from all other possible causes of the symptom. The use of computer technology in medical decision support is now widespread and pervasive across a wide range of medical area, such as cancer research, gastroenterology, hart diseases etc. The Computer-Aided Diagnosis (CAD) is becoming an increasing important area for intelligent computer systems. There is a tremendous opportunity for Data mining methods to assist now the physician deal with this flood of patient Manuscript received September 18, 2007. F. Gorunescu, IEEE Computer Society, member, is with the University of Medicine and Pharmacy of Craiova, Chair of Mathematics, Biostatistics and Informatics, Craiova, 200349 Romania (phone: +40-251-435620; fax: +40251-593077; e-mail: fgorun@ rdslink.ro).
105
International Journal of Biological and Medical Sciences Volume 1 Number 2
In previous pilot studies [3], [4], [5], we tried to assess the EUSE characteristics of tumors using the dynamic image analysis performed by physicians, enhanced by a statistical analysis of the (hue) histogram corresponding to the (near) best image of each sample movie.
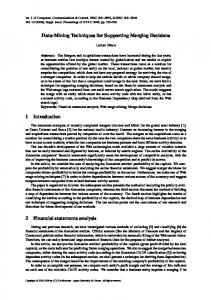
in transparent color sample movies. Basically, the EUSE is performed during the EUS examinations with one sample movie of 10 seconds, recorded on the hard disk drive embedded in the EUS sono-elastography module, used in conjunction with a linear endoscope, in order to minimize the variability and to increase the reliability of the image acquisition. Each acquired EUSE sample movie is subjected to a computer-enhanced dynamic analysis using a public domain Java-based image processing tool (developed at the National Institutes of Health, Bethesda, Maryland, USA [2]). Different elasticity values are marked with different (hue) colors (on a scale of 1 to 255) and the EUSE information is shown as color sample movie. Technically, a EUSE sample movie (dynamic image) consists in a sequence of 125 frames (static images). The system uses by default a rainbow colorcoded map red-green-blue (RGB), where hard tissue areas are marked with dark blue, medium hard tissue areas with cyan, intermediate tissue areas with green, medium soft tissue areas with yellow, and soft tissue areas with red. Moreover, the system provides the corresponding color histograms of each frame of the sample movie. Recall that in computer graphics and photography a (hue) color histogram is a representation of the distribution of colors in an image, derived by counting the number of pixels of each of a given set of color range in a typically two-dimensional (2D) color space. We illustrate a EUSE sample movie frame and its corresponding (hue) histogram in the case of a malignant tumor in Fig. 1.
III. DATA MINING APPROACH In order to solve the EUSE deficiency mentioned above, regarding the way in which the images are interpreted and, finally, leading to major consequences as concerns the given diagnosis, we propose the employment of both the exploratory data analysis of the EUSE digitalized sample movies and the neural networks that will be trained to understand how to classify tumors as benign or malignant, based on the analysis of previously digitalized images. Firstly, in order to apply the neural network methodology to differentiate between the sample movies, characterizing either benign or malignant tumors, we firstly need to digitalize them. Since the corresponding EUSE sample movie (dynamic image) consists in a sequence of 125 frames (static images) displaying 255 colors, then, using the public domain Javabased image processing tool, a number of 125 (hue) histograms are obtained, providing the distributions of (hues) colors in each frame. Thus, from mathematical point of view, to each patient corresponds a 125×255 matrix (aij), each row representing a certain frame of the sample movie and each column representing a pixel color. Secondly, departing from the corresponding database that contains the digitalized forms of the scanned images of different tumoral tissues, displayed as sample movies, together with the corresponding diagnosis that was established without any doubt by doctors, the artificial neural networks are trained to learn to associate a certain color pattern to the corresponding diagnosis (benign/malignant). The power of this novel methodology of detecting the cancer in a noninvasive way comes to life when the digitalized sample movie of a new (non-diagnosed) patient is presented. In this case, the neural network gives the output that corresponds to a taught pattern that is least different from the given pattern. Using this novel neural network approach, the physicians will combine the opportunity given by the neural networks approach and their expertise to successfully predict the malignancy of a given tumor. IV. EXPLORATORY DATA ANALYSIS Summarizing, to each patient corresponds a 10 seconds EUSE sample movie, converted into a 125×255 matrix, representing the distribution of colors, corresponding to the tumor elasticity. By analyzing the distribution of colors, it is possible to detect between benign and malignant tumors. So far, the EUSE image analysis has been performed using the human perception of color hues (enhanced by statistical tools) only. The goal of the exploratory data analysis (EDA), used in this context, is to perform a database filtering in order to provide to the neural network neat and appropriate inputs for training and testing. Unfortunately, due to technical features of the image acquisition, most of the EUSE sample movies contain a
Fig. 1 EUSE sample movie frame with corresponding histogram
Further on, these images are analysed by doctors in order to establish if an existing tumor is either malignant or benign. Unfortunately, this methodology exhibits a major disadvantage due to the subjective means in which the human factor may analyze a large range of color nuances, based on which an objective decision regarding the type of the tumor is to be taken. More than often, there are significant differences in the perception of close nuances, this fact resulting in individual decisions that are different from one doctor to another.
106
International Journal of Biological and Medical Sciences Volume 1 Number 2
VI. NEURAL NETWORKS
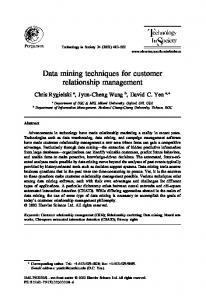
certain number of black and white frames, which represent outliers of the database, making difficult the decision process. Such frames are recognized by using a brushing technique to highlight in the matrix plot all data points that belong to this category. Concretely, such a black and white frame is characterized by a very few number of different values, since the frame does not contain color hues, but a grey scale only. Accordingly, the corresponding histogram contains extreme values (outliers) equaling either zero or very large values (for hues of black and white). In such circumstances, these frames (rows in the corresponding matrix) have been deleted. Below a comparison between Black & White and colored frames is displayed.
During the classification process concerning the tumors types, we have used only the multi-layer perceptron (MLP) model with back propagation as training algorithm. In order to optimize the diagnosis process, we have run the NN software by choosing different settings of the model, concerning the number of input variables in the network (inputs) and the number of hidden units in the network (hidden), representing the NN model complexity. In order to evaluate the classification efficiency, the most important metric has been computed: the performance of the network. Basically, the NN performance measure indicates the proportion of cases which are correctly classified. For more details concerning the use of NN, see [6]. Since the database contains a pretty small number of cases, as testing method the 10-fold cross-validation has been used. Accordingly, the classification accuracy is computed 10 times, each time leaving out one of the sub-samples from the computations and using that sub-sample as a test sample for cross-validation, so that each sub-sample is used 9 times in the learning sample and just once as the test sample. In order to assess the robustness of this method, we have run the application 30 times and considered the standard deviation of the accuracy as a robustness measure. The main results are displayed in Table I.
Fig. 2 Black & White vs. color frame
Secondly, since the natural input of NN’s is represented by vectors (strings), we need a way of summarizing the matrix corresponding to a EUSE sample movie in a vector pattern. Since aij represents the frequency of the (hue) color j in the i125 1 th frame, then a j = a represents the mean i =1 ij 125 frequency of the (hue) color j in the sample movie. Consequently, the vector (a1, a2,…, a255) represents an average (hue) histogram summarizing the information provided by a EUSE sample movie. More work has to be done in the future to reduce the database dimensionality (i.e. the dimension of the input vector).
TABLE I NEURAL NETWORK RESULTS No. hidden layers
∑
30
Average accuracy (%)
Standard deviation (%)
98.76
1.35
The corresponding synthetic architecture of the NN model is displayed in Fig. 3 below.
V. MATERIAL A number of 64 individuals were examined by EUSE during a 6-month period at the Department of Gastrointestinal Surgery, Gentofte University Hospital, Hellerup, Denmark and the Endoscopy Laboratory Department of Gastroenterology, University of Medicine and Pharmacy of Craiova, Romania. Cancer patients with various primary tumor locations staged by EUS were also included in the group. The medical examination has been performed by two experienced EUS examiners in a typical clinical setting with previous knowledge of the patient’s underlying disease. EUS, EUS-FNA and EUSE of the tumors were performed during the same EUS examination with a Hitachi 8500 US system with an embedded SonoElastography module (Hitachi Medical Systems Europe Holding AG, Zug, Switzerland), used in conjunction with a EG 3830 Pentax linear endoscope (Pentax, Hamburg, Germany).
Fig. 3 NN architecture
Both the high diagnosis accuracy and the small corresponding standard deviation depicted in Table 1 show the suitability and the reliability of this methodology in the noninvasive cancer detection. VII. CONCLUSION The methodology developed in this paper, based on processing the EUSE digitalized sample movies of tumors by Data Mining techniques, enables the exploration and the analysis by automatic means of large quantities of data, in
107
International Journal of Biological and Medical Sciences Volume 1 Number 2
order to obtain an optimal prediction of cancer, by using a noninvasive methodology. Accordingly, the purpose of this paper is to demonstrate the suitability, robustness and ability of the NN model in the computer-aided diagnosis area, seen as an objective and reliable classifier of tumors dynamic images, previously processed by specific Data mining techniques. ACKNOWLEDGMENT The EUSE sample movies were obtained from the Department of Gastrointestinal Surgery, Gentofte University Hospital, Hellerup, Denmark and the Endoscopy Laboratory Department of Gastroenterology, University of Medicine and Pharmacy of Craiova, Romania. Thanks go to Prof. Peter Vilmann, Denmark, and Assoc. Prof. Adrian Saftoiu, Romania, for providing the data and the necessary medical support. The author’s activity was supported through the research grant No. 159/2006, entitled "Role of endoscopic ultrasound elastography as compared with molecular techniques for the assessment of the patients with pancreatic cancer", financed by the Romanian Ministry of Education and Research and the National Authority for Scientific Research (MEdC & ANCS). REFERENCES [1]
[2] [3]
[4]
[5]
[6]
M. Giovannini, L. Hookey, E. Bories et al., “Endoscopic ultrasound elastography: the first step towards virtual biopsy? Preliminary results in 49 patients,” Endoscopy, vol. 38, pp. 344-348, 2006. W. Rasband, “ImageJ: image processing and analysis in JAVA”, National Institutes of Health (Available: http://rsb.info.nih.gov/ij/). A. Saftoiu., P. Vilmann, H. Hassan, and F. Gorunescu, “Analysis of endoscopic ultrasound elastography used for characterization and differentiation of benign and malignant lymph nodes”, Ultraschall in der Medizin (European Journal of Ultrasound), vol 27, no. 6, pp. 535-542, 2006. A. Saftoiu, C. Popescu, S. Cazacu, D. Dumitrescu, C.V. Georgescu, M. Popescu, T. Ciurea, and F. Gorunescu, “Power Doppler Endoscopic Ultrasound for the Differential Diagnosis between Pancreatic Cancer and Pseudotumoral Chronic Pancreatitis”, Journal of Ultrasound in Medicine, vol. 25, no. 3, pp. 363-372, 2006. A. Saftoiu, P. Vilmann, T. Ciurea, G.L. Popescu, A. Iordache, H. Hassan, F. Gorunescu, S. Iordache, “Dynamic analysis of endoscopic ultrasound (EUS) elastography used for the differentiation of benign and malignant lymph nodes”, Gastrointestinal Endoscopy, vol. 66, no. 2, pp. 291-300, 2007. S. Haykin, Neural Networks. Prentice Hall International, 1999.
108