Sep 2, 2003 - Natraj Iyer. Yagnanarayanan Kalyanaraman .... words, we cannot discard a model from the candidate list only because some attributes do not ...
Proceedings of ASME DETC’ 03 23rd Computers and Information in Engineering (CIE) Conference September 2-6, 2003, Chicago, Illinois
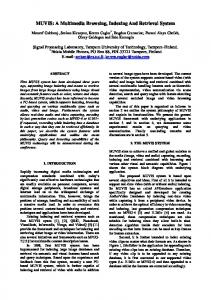
Put Paper Number Here A RECONFIGURABLE 3D ENGINEERING SHAPE SEARCH SYSTEM PART II: DATABASE INDEXING, RETRIEVAL AND CLUSTERING Kuiyang Lou Subramaniam Jayanti Natraj Iyer Yagnanarayanan Kalyanaraman Sunil Prabhakar * Karthik Ramani Center for Information Systems in Engineering (CISE) School of Mechanical Engineering * Department of Computer Sciences Purdue University, West Lafayette IN 47907-2024, USA ABSTRACT The paper introduces database and related techniques for a reconfigurable, intelligent 3D engineering shape search system, which retrieves similar 3D models based on their shape content. Feature vectors, which are numeric “fingerprints” of 3D models, and skeletal graphs, which are the “minimal representations of the major shape” of a 3D model, represent the shape content. The Euclidean distance of the feature vectors, as well as the distance between skeletal graphs, provides indirect measures of shape similarity between the 3D models. Critical database issues regarding 3D shape search systems are discussed: (a) Database indexing, (b) Semantic Gap, (c) Subjectivity of similarity, and (d) Database clustering. An R-tree based multidimensional index is used to speed up the feature-vector based search operation, while a decision treebased approach is used for efficiently indexing/searching skeletal graphs. Interactions between users and the search system, such as relevance feedback and feature vector reconfiguration are used to bridge the semantic gap and to customize the system for different users. Database clustering of the R-tree index is compared with that generated by a selforganizing map (SOM). Synthetic databases and real 3D model databases were employed to investigate the efficiency of the multidimensional index and the effectiveness of relevance feedback. 1. INTRODUCTION Content-based search system uses characteristic properties extracted from objects to represent their content. It searches objects based on their overall similarity. Normal search systems retrieve objects by some specific attributes of the objects; and
each attribute in a query can be used independently to filter-out some data records from the candidate list. However, in contentbased systems, only the overall similarity is used to filter data records. Content–based 3D model search is still an ongoing research area, although content-based image retrieval systems [1] have been studied for several years. Generally, two types of content-based retrieval systems can be used for 3D model retrieval: Keyword-based systems (KBS) and Feature-based systems (FBS). KBS uses a set of descriptive words to describe 3D models; retrieval is based on matching these keywords. Although this method has strong expressive capacity, it is difficult to automate because users have to manually assign keywords they think are suitable to represent the objects. Users with different backgrounds may submit very different queries for the same model and a single word often has different meaning to different users. Furthermore, although keywords are good at qualitatively describing an object, they are not able to do so quantitatively. The relationship between two words is very difficult to quantify. On the other hand, FBS uses low-level features to represent complex 3D models instead of keywords. Feature vectors, which serve as numeric “fingerprints” for the models, are obtained through a process called “feature extraction” [2-3]. Using the elements in feature vectors as coordinates, models are further represented as points in “feature space”. The spatial relationships among these points are used to quantify the degree of similarity between models. Search for 3D models from a database translates to searching in feature space, as discussed in the later sections of the paper.
1
Copyright © 2003 by ASME
FBS is an objective approach, since all the features are intrinsic values that are computed by the system objectively. The feature-extraction algorithms determine the representation of the models in the database; users do not bias these representations. Thus, the system has a neutral version of features for all users. It is easy to automate, since all of the information is objective. It is more accurate compared to KBS, and allows quantification of the degree of similarity. Our system uses a feature-based retrieval approach for searching 3D engineering parts. To search for similar parts, a user submits the query using a rough 3D model. The representation of this query model is automatically extracted and compared with those stored in the database. The system orders the models by the differences and presents the most similar models to a user as search results. In the accompanying paper [4], we summarize the various approaches taken by past researchers, and describe our approach to the problem. The system architecture and feature extraction is also elaborated. Feature vectors are extracted from the normalized, voxelized and skeletonized representations of 3D models. Figure 1 shows the various features extracted from the 3D models and stored in our system.
created as a result of mapping complex 3D engineering models into low-level feature vectors. Feature vectors can also be viewed as points in a hyperspace (also called feature space), such that each point (represented as dots in the figure) in the feature space corresponds to one of the 3D models. Points close together in the feature space are regarded as ‘similar’. Circles enclosing the dots represent clusters of similar models.
Original 3D Model
Normalized model
Geometric Parameters
Principal Moments
Voxel model
Moment Invariants
Skeletal model
Graph Information
Adjacency Matrix
Figure 1 Feature vectors extracted from 3D models This paper focuses on the issue of searching a database of engineering parts, effectively and efficiently. The critical issues considered here are: (a) Database indexing, (b) Semantic Gap, (c) Subjectivity of similarity, and (d) Database clustering. Database Indexing is a technique for speeding up search operations in databases. Since the representation of a 3D model has large dimensionality, common indexing techniques such as B+ trees are not suitable for this application. Although use of a multidimensional index for efficient database searches has been researched in image database systems, there has been limited work done on the performance of a high-dimensional index in 3D model retrieval systems. Semantic gap refers to the difference between the systemperceived and user-perceived similarities of 3D shapes. The user-perceived similarity is based on visual perception of human beings. The system-perceived similarity is based on the low-level features representing 3D shape. Because of the semantic gap, a user may not regard models identified as similar by the system as similar. This has resulted in a challenging problem of mapping between low-level features and high-level 3D models. Figure 2 explains the semantic gap
Figure 2 Illustration of Feature extraction, Semantic Gap and Database Clustering Subjectivity of similarity definition pertains to the subjectivity of human visual perception. Different users may have different similarity criteria depending on the application and prior knowledge. A predefined similarity measure is not sufficient for different users. Database Clustering is useful in providing a natural, easy to browse user interface (See section on User Interface in [4]). Clusters of similar parts can also be used in conjunction with an R-tree to improve the indexing ability. The paper is structured as follows. Section 2 is devoted to database indexing and search techniques. Section 3 deals with the semantic gap, subjectivity of similarity of 3D models and relevance feedback. Sections 4 and 5 explain the experiments and results. Finally, Section 6 concludes the paper. 2. DATABASE INDEXING AND SEARCH 2.1 Similarity measure A similarity measure is a function to quantify the similarity between two models. It takes the feature vectors of the query model and that of a model in the database and outputs a real number that reflects the degree of similarity between the two
2
Copyright © 2003 by ASME
models. It is preferable that similarity measures satisfy the metric axioms [5] as follows. Let S be a set of objects, a metric on S is a function d: S × S → ℜ , which satisfies three conditions, i.e., Eqs. (1)-(3), for all x, y, z ∈ S . d ( x, x ) = 0 (1) d ( x, y ) = 0 ⇒ x = y (2) d ( x , y ) + d ( x, z ) ≥ d ( y , z ) (3) d ( x, y ) ≥ 0 (4) d ( x, y ) = d ( y , x ) (5) If a similarity measure satisfies metric axioms, then it can be seen that: (a) The similarity has the constancy of self-similarity. A similarity measure always evaluates the degree of similarity of two identical models as zero. (b) If the similarity measure cannot tell the difference between two models, then the two models are identical. This further implies the quality of feature elements; and (c) It has the triangle inequality that can derive other two important properties as shown in Eqs. (4) and (5). Equation (4) shows that the similarity measure is non-negative. Together with axiom (1), it states that a model is most similar to itself. Equation (5) states the symmetry of the similarity measure. We use the Euclidean distance between points in feature space to indirectly represent the similarity measure. Clearly, this similarity measure is a metric. 2.2 Indexing by Feature Similarity Using index structures to speed up searching is a critical issue for 3D shape search systems. The logarithmic query time of B+ tree is in part responsible for the success of relational databases [6]. However, the B+ tree index is basically a onedimensional index structure, which orders the data records by one attribute at a time. This one-dimensional index structure is not sufficient for 3D shape search systems. The fundamental problem is that the feature vectors representing 3D models are complex data types. Searching is usually based on overall similarity (similarity query) rather than the similarity of individual attributes (attribute query). We have to use all the attributes simultaneously to determine the similarity. In other words, we cannot discard a model from the candidate list only because some attributes do not match the query model. Thus, in order to search similar 3D models efficiently, we need an index structure with properties such that: (1) It is a multidimensional index. The multidimensional index arranges the models using all the feature elements, and (2) It groups similar models and puts them in the same node or contiguous index nodes. This grouping can reduce the disk I/O time during search operations. R-tree based multidimensional indexes [7] has been extensively studied for content-based image retrieval. In such an index, points in feature space are clustered in groups and a
group is represented by a bounding rectangle/hyper-rectangle containing the points. The bounding hyper-rectangle is a tight bounding box that is represented by the coordinates of its vertices. To answer a query, the query point is compared with the bounding box in order to prune the sub-tree rooted at this hyper-rectangle. Therefore, the R-tree index satisfies the requirements of the similarity index listed above. Figure 3 illustrates the R-tree structure. The leaf nodes contain pointers to 3D models. The search starts at the root and is directed by internal node to the leaf node. The tree structure is similar to a B+ tree; however, the criterion to arrange the records is totally different from that of B+ trees. In Section 5, we investigate the efficiency and grouping abilities of the R-tree index for a content-based 3D search system.
Index File
Internal Data Entries
Leaf Data Entry
Data Record
Data Record
Leaf Data Entry
Data Record
... ...
Leaf Data Entry
Data Record
Data Record
Data Record
Data File
Figure 3 Tree structure of multidimensional index 2.3 Indexing by Skeletal-Graph similarity Apart from the similarities between feature vectors, we also investigate similarity based on skeletal graphs. The skeletal graph representation obtained from the server is utilized for determining similarities between corresponding 3D models. As described in the accompanying paper, we convert the skeletons of 3D models into undirected entity-graphs and store them in the database. A query model is also converted into a skeletal graph and this graph is compared with graphs of all the models in the database. The system then retrieves models based on graph similarity. The goal of our search system is to retrieve all models that are ‘similar’ and not only those that match exactly with the query model. In graph similarity search, this translates to finding models whose skeletons have isomorphism as well as subgraph isomorphism with the query model. Traditional exact approaches [8-10] for graph comparison lead to an NPcomplete problem. It is infeasible to efficiently find a solution except for small graphs (typically 30-50 nodes). Therefore, large graphs have to be preprocessed before comparison [9]. Since the skeletonization of 3D models produces graphs of very small size, we are able to considerably reduce indexing and search time for a large number of parts. More than 70 % of
3
Copyright © 2003 by ASME
the 150 models in our database have skeletons with 8 entities or less. We incorporated domain knowledge into our graph data structure, thereby enriching the graph structure and enhancing search capabilities. The entities in a graph were classified into two topological types: edges and loops. Loops in the skeletal graph indicate holes in the original model while edges represent solid portions in the 3D model. Classifying edges into straight and curved edges, thereby representing straight and curved portions in the solid model, can further enrich the graph structure. Additional geometric properties such as geometric curve equations and relative sizes of entities can also be incorporated. The adjacency matrix is formulated to capture the structural properties of the skeleton, such as loop-loop, edgeloop connections, etc. This representation reflects the topology and the high-level geometry of the skeletons. In order to detect graph /subgraph isomorphism we utilize a decision-tree based approach developed by Messmer and Bunke [9]. This algorithm is a modification of the subgraph detection algorithm developed by Ullman [8], which uses a backtracking approach with refinement to prune the search space. Ullman’s algorithm is treated as a benchmark to compare new isomorphism detection algorithms. Messmer and Bunke modified this algorithm to make it suitable for database searching. The algorithm indexes all the graphs in a database in the form of a decision tree using the various permutations of the adjacency matrix. Although, the space requirements for this system are exponential in the sizes of the graphs, the search time is sub-polynomial in the number of query graph nodes. Moreover, the search time does not depend on the size of the database, but only on the size of the largest skeletal graph. The small sizes of our skeletal graphs prove to be inexpensive in terms of indexing time and space requirements for this algorithm.
However, this measure does not take into account the relative sizes of the skeletal entities in determining similarity. The idea is illustrated in Fig. 4; Model 1 and Model 2 will be detected to be isomorphic and the similarity will be predicted as 100%. Likewise, the similarity between Model 1 and Model 3 will be predicted as 66%, although Model 1 is more similar to Model 3 than Model 2. This is due to the fact that the skeletal graphs for the first two models (shown below) are structurally isomorphic. Additional heuristics such as relative sizes, parametric equations and local properties of the entities can be used to arrive at more accurate similarity measures that better distinguish models that are slightly dissimilar. This argument brings us to the issue of hierarchical similarity in our system. We can develop the system to give the user a control on the level of graph comparison. If the user desires, matching may stop at a higher level or continue to a lower level using local properties. However, in this study we have restricted our approach to a higher level of graph matching. Results of isomorphism detection are presented in Section 5.1.2. 3. RELEVANCE FEEDBACK 3.1 Semantic Gap The system-perceived similarity is defined with low-level feature vectors in the database. However, a user cannot envision a 3D model at such a low level. The user-perceived similarity is defined by human visual perception. The difference between the system-perceived similarity and the user-perceived similarity is termed as the “Semantic gap of similarity” [11] as explained earlier. The ideal similarity measure needs to map a 3D model to a unique feature vector, similar models to similar feature vectors, and dissimilar models to dissimilar feature vectors. However, the semantic gap poses an extreme difficulty to exactly represent 3D models with feature vectors. Therefore, some similar models can be mapped to very dissimilar feature vectors and dissimilar models can be mapped to similar feature vectors. Although psychologists have researched the area for almost 70 years, it is still difficult to quantitatively simulate the visual perception of humans [12]. Effectiveness of 3D shape search systems is greatly affected by the semantic gap.
Figure 4 Skeletons for similar models Our system uses a rudimentary similarity measure (Eq. 6), which is defined as ratio of the number of entities that match between two graphs (say, GA and GB) to the size of the larger of the two graphs. # of Matching Entities Similarity(GA , GB ) = x100 (6) Max( GA , GB )
Figure 5 Search result I to show semantic gap from a database of 150 models
4
Copyright © 2003 by ASME
Figure 5 is a search result obtained using second order moment invariants as the feature vector. From the users viewpoint it is obvious that the search engine retrieved some significantly dissimilar models. However, after we checked the feature vectors of all models, we found that these seven models indeed had the largest similarity to the query model. In other words, the search engine successfully identified the feature vectors that were most similar to the query vector, based on the system-perceived similarity. However, because of the semantic gap, the system could not guarantee that system-perceived similarities are the same as user-perceived similarities. 3.2 Subjectivity of Similarity Definitions Besides the semantic gap, the subjectivity of similarity definition is another factor that greatly influences the effectiveness of 3D shape search systems. As described in Section 1, we have extracted a set of feature elements to represent 3D models. However, different users may value these features differently. In other words, the similarity search of 3D models is subjective. Using predefined universal similarity measures cannot reflect preferences of different similarity views. If the system is configured differently than the user’s similarity definition, it is impossible that the retrieval system will get satisfactory results. Our system uses the interface between users and the system to reconfigure and customize the system for different users. Our system is initially tuned to a general (default) similarity definition. The reconfiguration is implemented on two levels. On a higher level, a user is allowed to choose the feature elements to be used in similarity computations. In other words, weights of the feature elements are either included or discarded. For simplicity, we grouped the feature elements into groups and users can choose groups of feature elements for comparison. Our system currently has five groups: geometric parameters, moment invariants, principal moments, skeletal entities, and eigenvalues of the skeletal graph (see section on User Interface in [4]). In the rest of this paper, we mainly use the second order moment invariants. At a lower level, the weight of each feature element can be reconfigured to reflect user’s similarity definition. The higher-level reconfiguration is coarse and is done before searching. The lower-level reconfiguration is a fine-tuning, which is done by using relevance feedback after presenting the search results to users. Relevance feedback [13-14] is described in more detail in the following section. 3.3 Query Reinterpretation and Reconfiguration The semantic gap and subjectivity of similarity make it difficult to correctly retrieve similar models for a user. Relevance feedback is used to train the system to reconfigure its similarity definition to reflect user’s preference so as to bridge the “semantic gap of similarity” (see Fig. 6). This reconfiguration is applied on the low-level feature vectors. However, it is impossible for a user to directly adjust the weights of low-level feature elements. The method to
circumvent this problem is to present search results graphically to a user, ask the user to evaluate the search results, and give feedback to the system. The system, in turn, identifies patterns in the user’s feedback and adjusts the weights accordingly. Thus a user just deals with the high-level models instead of low-level features. The procedure of relevance feedback is illustrated in Fig. 6 above. It consists of the following steps: (a) Database query: When the system retrieves some models based on the query example, it will order them by similarity measure of feature vectors and presents them to the user. (b) Relevance Feedback: Users classify them into relevant and irrelevant groups and inform the system. (c) Query reinterpretation and reconfiguration: The system, in turn, reconfigures itself to reflect the user’s preference, reinterpret user’s intention and does the search again. (d) Repeat Query: This process iterates until either the user is satisfied or the system cannot improve the results further. Query Vector Database Query No
Relevance Feedback Yes
Query Reinterpretation Query Reconfiguration Repeat Query (new query & database) End
Figure 6 Procedure of relevance feedback We utilize user’s relevance feedback in two ways: query reinterpretation and weight reconfiguration. Query reinterpretation is done in order to update the query point. Our system is designed to learn from the relevance feedback and update the query to represent user’s query intention. After being presented the search results, the user is given an option to identify the relevant and irrelevant models. In query reinterpretation, the query neighborhood is moved to the centroid of the relevant models, as shown in Fig. 7. The left rectangle represents the original query and database. The “+” represent relevant models; the “-” represents irrelevant models and “o” represents undetermined models. The new query better represents the user’s search intention. The search based on the
5
Copyright © 2003 by ASME
new query can find some relevant models that were not identified by the previous one.
++++ --++++ ++++ - + - - ++++ - + - - +- -+ ----
++++ --++++ ++++ - + - - ++++ - + - - +- -+ ----
+: relevant models, -: irrelevant models, undetermined models a) Search with original query b) Search with updated query
Figure 7 Query reinterpretation using relevance feedback
Feature Element B
Weight reconfiguration [12] reassigns weights to feature vector elements. The weights reflect the importance of the elements to the user. By relevance feedback and reconfiguration, the database can be customized for different users. Figure 8 illustrates the weight reassignments using two feature elements. It can be seen that the user has assigned more importance to feature element A than B; because the relevant models have closer values for feature element A. Therefore, the system adjusts the weights and assigns higher weights for element A than B. With these adjusted weights, the search system recomputes the similarity and presents the new search results to the user. Figure 8b shows that the models with similar values of feature element A stay closer. Thus, the search system will retrieve them as similar models. In our system, the weights are stored in the user profile independent of the database. It is located one layer above the database. Thus the database is neutral to all users and the server needs to keep just a single copy of the database. The user profile is used to customize the database to reflect user’s preferences. We are also investigating the use of Artificial Intelligence techniques such as Neural Networks to learn from the relevance feedback and combine the distance in each element to arrive at an overall similarity measure. This is more complicated but it allows a nonlinear combination of distances in each dimension.
oooo oooo + ++ ++++ ++ +++ -----Q - - - ++ -+ + + ++ + ++++ o o oooo
+: relevant models
o
--
- - - -- - +
oooo o ooo ++ ++++ ++ +++
Q
++ + + + ++ ++++ o o oooo
4. EXPERIMENTS We designed and implemented experiments to test our approaches to deal with challenges for 3D shape search systems, i.e. subjectivity of shape similarity, semantic gap and efficiency. The tests were conducted on a DELL Pentium 2.66 GHz PC with 1.0 GB RAM. The whole system was implemented in Java. We tested the ability of the multidimensional index to cluster similar models with a real 3D model database, while the efficiency of search operations was tested using both synthetic and real datasets. The database of the real 3D models currently consists of about 150 models. Although our real database is being expanded, the size is still relatively small as compared to typical design repositories. The sizes of synthetic datasets vary from 50 to 1,000,000 data records. The effects of database size, dimensionality of feature vector, and node volume to the efficiency of the search system were studied with the synthetic datasets. The synthetic database was created using a random number generator. The utility of relevance feedback to enable a customizable similarity definition and bridge the semantic gap was tested with the real 3D database. Both mechanisms for relevance feedback described in Section 3 were implemented. 5. RESULTS AND DISCUSSION 5.1 Database Indexing Figure 9 shows the tree structure of the index with 40 models. This is only a sample index structure to illustrate the multidimensional index structure and its clustering abilities. Moment invariants were used as the feature vector. The index organizes the models into 14 nodes and 3 levels. For the complete real 3D database of 150 models, the index has 62 nodes and 4 levels. For a synthetic database with 1,000,000 records, the R-tree has 386,829 nodes and 11 levels. An ideal tree-based index retrieves the corresponding model by traversing each level only once. For an ideal treebased index, the height of this balanced tree determines the cost of search operation. However, the multidimensional index based on R-tree does not have this property. Because the R-tree represents the nodes in hyper-rectangles and there are overlaps among the hyper-rectangles, more than one node on each level has to be visited while searching.
7 -
Page 7 1
-
36 29 27 17
Feature element A -: irrelevant models o: undetermined models
a) Before weight reconfiguration
Numbers are pointers child pages
Page 0
o
b) After weight reconfiguration
Figure 8 Weight reconfiguration using relevance feedback
7 8
2
24 22 14 6 26
9 12
3 4 19 23 35
8 13
Page 8 3 5 6 10
2 1 20 32 38
18 28 15 25 33
13 10 11 12
Page 13 4 11
21 0 30
5 9 39
34 17 16 31
Numbers are pointer to models
Figure 9 An R-tree index structure for 40 3D models
6
Copyright © 2003 by ASME
visited is about 0.00125. In other words, for every 800 nodes, there is only one loaded in temporary memory for similarity computation. In all the above tests, the longest time for a similarity query is less than 1 second. It can be seen from the figures that the required visiting increases when the database size, dimensionality of record, and the node volume increase. 2000 Dim 3 Dim 5 Dim 9 Dim 20
Number of Visited Nodes
1800
Figure 10 Models clustered in the nodes of R-tree The efficiency of the R-tree index is determined by the pruning ability. The search basically proceeds through all the nodes at a level and prunes the nodes based on some criterion. In [15], there is a detailed description about pruning the nodes using MinDist and MinMax of the node to a query model. The pruning ability is in turn determined by the distribution of similarity models. If similar models are grouped in the same node or similar nodes, the R-tree has better pruning ability. Figure 10 illustrates the contents of three nodes in this tree. It can be seen that the index nodes grouped similar models to some extent. However, since the grouping of similar models in the R-tree depends on the sequence of insertion, similar models are not always grouped in the same node. In other words, Rtree is not optimized for clustering.
1400 1200 1000 800 600 400 200 0 0
200000
400000
600000
800000
1000000
Number of Records
Figure 11 Numbers of visited nodes v.s. dimensionality and database size
Ratio of all index nodes to Visited Nodes
900 Dim 3 Dim 5 Dim 9 Dim 20
800 700 600 500 400 300 200 100 0 0
200000
400000
600000
800000
1000000
Number of Records
Figure 12 Ratios of visited nodes at different dimensionality and database size 1200
Number of Visited Nodes
5.1.1 Efficiency of the multidimensional index The primary indicators of the search efficiency are the number of visited nodes and ratio of visited nodes during a search operation. The visited nodes are loaded into the temporary memory (RAM) from the database during search operations. The query model is compared with the models in the retrieved node to determine the search direction or to compute similarity. The ratio of visited nodes is the ratio of the total number of nodes to the number of visited nodes. Since disk I/O is the bottleneck for current computer systems, the number of nodes visited directly translates to the number of disk I/O operations, which directly impacts overall performance. The ratio of visited nodes indicates the improvement that R-tree achieves compared to an exhaustive search. Figures 11 and 12 show the required visiting and ratio of visited nodes in synthetic data sets with different sizes and dimensionality, respectively, when the node volume is 5. Dimensionality is the number of feature elements that describe a 3D model. Figures 13 and 14 illustrate the required visiting and the ratio of visited nodes at different node volumes and database sizes when the dimensionality is 5. It is seen from these figures that the multidimensional index prunes a large number of nodes, especially at lower dimensionalities and node volumes. In the case where the dimensionality of records is 3 and node volume is 5, the ratio of
1600
Node volume 10 Node volume 20 Node volume 60 Node volume 100
1000 800 600 400 200 0 0
200000
400000
600000
800000
1000000
Number of Records
Figure 13 Numbers of Visited nodes with different database size and node volumes (dimensionality = 5)
7
Copyright © 2003 by ASME
Ratio of DB nodes to Visited Nodes
160
Node volume 10 Node volume 20 Node volume 60 Node volume 100
140 120 100 80 60 40 20 0 0
200000
400000
600000
800000
(b) Figure 15(a) and (b) Two Graph matching results using skeletal graphs
1000000
Number of Records
Figure 14 Ratio of visiting nodes with different database size and node volumes We also performed tests with real databases of 40 and 150 models, respectively. Each node in the index contains the information of at most 5 models. The average number of visited nodes, for 1000 queries, was 3.62 for the tree of 40 models and 6.01 for that of 150 models. This number is close to the height of the R-tree, which is the optimal visiting number for treebased indexing structures. Nevertheless, we expect the efficiency to degrade with an increase in database size, node volume and dimensionality of data records.
5.2 Relevance Feedback Results 5.2.1 Query Reconstruction Figures 16 (a) and (b) are the models retrieved by the search system before and after query reconstruction based on relevance feedback. The top-left model is the query model. The feature vector used in 5.2.1 and 5.2.2 is second order moment invariants. It can be seen that the similarity is recomputed and more number of similar models are retrieved after relevance feedback.
5.1.2 Skeletal Graph Index For indexing the skeletal graphs in our database, we have utilized the decision-tree based algorithm developed by Messmer and Bunke. We populated our database with skeleton graphs of 150 models. Figures 15 (a) and (b) show results for two queries on the database, respectively. The search results are presented with the rank and similarity values for each retrieved model. Although, the system retrieves all the relevant models in the database, it also retrieves irrelevant parts, since we do not have any filtering mechanism to reduce the search space. Enriching the skeletal graph structure with more information such as local properties (volume, parametric equations and moments) and classification of edges into straight and curved will increase the precision of our system. Noise during skeletonization also leads to similar models having different skeletons, resulting in different graphs. Including a smoothing operation before graph generation and a fuzziness factor in the graph matching process can avoid these problems.
(a)
(b) Figure 16 Search results (a) before, and (b) after query reconstruction (Top-left model is the query model)
(a)
5.2.2 Weight reconfiguration Figures 17 (a) and (b) are the results before and after weight reconfiguration for a query model. It can be seen that more number of similar models are retrieved after weight reconfiguration.
8
Copyright © 2003 by ASME
(a)
(b) Figure 17 Search results (a) before weight reconfiguration (b) after weight reconfiguration 5.3 Database Clustering In order to enable a user to quickly search a model, our system is designed to provide an easy to browse hierarchical Cluster Map Interface as described earlier. This interface will use unsupervised clustering algorithms to form hierarchical similarity-based clusters. Traditionally, there are three major types of clustering algorithms: 1) Hierarchical 2) K-means clustering and 3) Self-Organizing Maps (SOMs). We have used SOMs for forming the cluster maps because they: 1) are amenable to visualization, 2) allow easy interpretation, 3) allow dynamic updating, and 4) are simple to implement. A selforganizing map (SOM) is a clustering algorithm based on a competitive learning approach [16-17]. It consists of a number of interconnected computational units called neurons, which are laid in either a hexagonal or rectangular topology. As new instances of 3D models are presented to the network, the positions of neurons are updated such that similar neurons move closer while dissimilar neurons move away from each other. Also, similar models are grouped in neighboring neurons, and dissimilar models are indexed in far away neurons. The SOM has properties of both vector quantization and vector projection algorithms. This allows projection of data in higher dimensions to lower dimensions, typically two dimensions (2D). In this research, self-organizing maps were studied for clustering 3D engineering parts based on the second-order moment invariants. The architecture of the SOM consists of 64 nodes in an 8 x 8 hexagonal topology, while training was continued until 800 iterations. Although R-trees are capable of forming clusters, which appear as data pages in the R-tree index, they are not optimized for clustering. Recall from our discussion on R-trees in Section 5.1 that Page 4 and Page 10 in the R-tree separate some very similar models (clamps). Figure 18 illustrates two clusters that were generated by the Self-Organizing Map (SOM). It can be seen that these models are grouped in the same node (Node 51)
by the SOM. Likewise, the models grouped by the SOM in Node 64 are similar. Due to space constraints we are unable to present all the results from the two methods for comparison. In the future, we will use data clustering algorithms to group similar models into clusters prior to insertion in the R-tree. This will improve the performance of the multidimensional index. We will also explore methods to cluster models based on the skeletal graph representations.
Figure 18 Models clustered in nodes of the SOM 6. CONCLUSION AND FUTURE WORK The paper has introduced the database and related techniques to support a 3D engineering shape search system. An R-tree based multidimensional indexing technique was used to speed up the content-based 3D shape retrieval effectively. The efficiency of this index was investigated for both synthetic and real databases. The results on synthetic database showed the scalability of the system. To improve the similarity indexing ability of the R-tree, we investigated the use of clustering algorithms to pre-classify the models. Preliminary results show that the clustering algorithms perform better than the R-tree in grouping similar models. Two relevance feedback mechanisms, namely, query reconstruction and weight reconfiguration, were used to improve the effectiveness of the search system. It was shown that relevance feedback indeed reduces the “semantic gap”. Search performance was improved after query reconstruction and weight reconfiguration. Skeletal graphs, which capture topological properties of 3D models, were used for searching 3D models utilizing graphmatching algorithms. Parts retrieved from various queries were ranked based on a similarity measure developed in the study. Results show the feasibility of using skeletal graphs for 3D engineering shape search. To the best of our knowledge, this paper is the first to demonstrate the feasibility of using skeletal graphs for 3D shape search. The system performance will be tested against other available approaches in the 3D shape search domain. ACKNOWLEGEMENTS Initial funding for this project came from the 21st Century Research and Technology Fund award from the state of Indiana. We also acknowledge the support from Innovation Realization Lab at Purdue University and the University Faculty Scholar Award from Purdue University for Professor Karthik Ramani, which seeded this project.
9
Copyright © 2003 by ASME
REFERENCES [1] Ashley, J., Barber, R., Flickner, M.D., Hafner, J.L., Lee, D., Niblack, W., and Petkovic, D., 1995, “Automatic and Semiautomatic Methods for Image Annotation and Retrieval in Query by Image Content (QBIC),” Proceedings of SPIE - The International Society for Optical Engineering, Vol. 2420, WA, USA, pp. 24-35 [2] Cohen, D.K, “Feature Extraction and Pattern Analysis of Three-Dimensional Objects”, Master Thesis, Thayer School of Engineering, Dartmouth College [3] Mehrotra, R., and Gary, J.E., 1993, “Feature-based retrieval of Similar Shapes,” IEEE 9th International Conference on Data Engineering Proceedings, Los Alamitos, CA, USA, pp.108-115 [4] Iyer, N., Kalyanaraman, Y., Lou, K., Jayanti, S., and Ramani, K., “A Reconfigurable 3D Engineering Shape Search System Part I: Shape Representation”, ASME DETC 2003, Submitted along with this paper. [5] Santini, S., and Jain, R., 1999, “Similarity Measures,” IEEE Transactions on Pattern Analysis and Machine Intelligence, Vol.21, No.9, pp.871-880. [6] Hellerstein, J.M., Koutsoupias, E., Papadimitriou, C.H., 1997, “On the Analysis of Indexing Schemes,” SIGMODSIGART Symposim on Principles of Database Systems, pp 249-256 [7] Guttman, R-trees: a dynamic index structure for spatial searching, Proceedings of the SIGMOD Conference, Boston, MA, June 1984, pages 47-57. [8] Ullman, J.R., 1976, “An algorithm for subgraph isomorphism”, Journal of the Association for Computing Machinery Vol. 23, pp. 31-42 [9] Messmer, B., and Bunke, H., 1995, “Subgraph isomorphism in polynomial time”, Technical Report TRIAM-95-003 [10] Ambler, A. P., Barrow, H. G., Brown, C. M., Burstall, R. M., and Popplestone, R. J., 1973, “A versatile computercontrolled assembly system”, In Proceedings of International Joint Conference on Artificial Intelligence, pp. 298-307 [11] Brocker, L. Bogen, M. Cremers, A B. 2001, “Bridging the Semantic Gap in Content-based Image Retrieval Systems,” Proceedings of SPIE, v 4519, p 54-62 [12] Santini, S., 2001, Exploratory Image Databases: ContentBased Retrieval, Academic Presses. [13] Efthimiadis, E.N., 2000, “Interactive Query Expansion: A User-based Evaluation in a Relevance Feedback Environment,” Journal of the American Society for Information Science, Vol. 51 No. 11, pp.989-1003 [14 Schettini, R., Ciocca, G., and Gagliardi, I., 1999, “Content-based Color Image Retrieval with Relevance Feedback,” IEEE International Conference on Image Processing, Vol. 3, pp.75-79. [15] Roussopoulos, N., Kelley, S., and Vincent, F., 1995, “Nearest neighbor Queries,” SIGMOD Conference, pp7179.
[16] Kohonen, T., 1995, “Self-Organizing Maps”, Springer Series in Information Sciences, Springer Verlag, Berlin [17] Vesanto, J., 2000, “Using SOM in data-mining”, Licentiate’s thesis, Helsinki University of Technology, Espoo, Finland, April 17th
10
Copyright © 2003 by ASME