Defining and Validating Metrics for UML Statechart Diagrams Marcela Genero, David Miranda and Mario Piattini ALARCOS Research Group Department of Computer Science University of Castilla - La Mancha Paseo de la Universidad, 4 13071 - Ciudad Real – SPAIN
[email protected], {marcela.genero, mario.piattini}@uclm.es
Abstract Maintainability is an increasingly relevant quality aspect in the development of object oriented software systems (OOSS). It is generally accepted that OOSS maintainability is highly dependent on the decisions made early in the development life cycle. Conceptual modelling is an important task of this early development. So that the maintainability of conceptual models have a great influence on the maintainability of the OOSS which is finally implemented. For assessing the conceptual models maintainability it is useful to have quantitative and objective measurement instruments. Conceptual modelling focus on either static aspects or dynamics aspects of the OOSS. Using the Unified Modelling Language (UML) static aspects at conceptual level are mainly represented in structural diagrams such as class diagrams, whilst dynamic aspects are represented in behavioural diagrams such as statechart diagrams, activity diagrams, sequence diagrams and collaboration diagrams. There exists several works related to metrics for structural diagrams such as class diagrams. However, behavioural diagrams have been little studied This fact leaded us to define measures for UML statechart diagrams. The main goal of this paper is to show how we defined those measures in a methodological way, in order to guarantee their validity. We used the DISTANCE framework, based on measurement theory, to define and theoretically validate the measures. In order to gather empirical evidence that the proposed measures could be early maintainability indicators of UML statechart diagrams, we carried out a controlled experiment. The aim of the experiment was to investigate the relationship between the complexity of UML statechart diagrams and their understandability (one maintainability subcharacteristic). Keywords. Object Oriented Software Systems maintainability, UML behavioural diagrams, UML statechart diagrams, complexity metrics, theoretical validation, empirical validation
1. Introduction Nowadays, maintainability has become one of the most pressing challenge facing OOSS development organisations. It is generally accepted within the OOSS development field that the maintainability of OOSS is highly dependent on decisions made early in the development
life cycle. Conceptual modelling is an important task of this early development. Most of the approaches towards OOSS development (OMT, Catalysis, Rational Unified Process, OPEN, etc.), have considered conceptual modelling as a relevant task. Therefore, the maintainability of conceptual models has a significant impact on the maintainability of OOSS, which is ultimately implemented. In the development of OOSS the conceptual models represent not only the structure of the OOSS but also their behaviour. Modelling OOSS with UML [23] the static aspects at conceptual level are mainly represented in structural diagrams such as class diagrams, whilst dynamic aspects are represented in behavioural diagrams such as statechart diagrams, activity diagrams, sequence diagrams and collaboration diagrams. For assessing quality aspects of such diagrams it is useful to have quantitative and objective measurement instruments, avoiding thus bias in the quality evaluation process. There exists several works related to metrics for structural diagrams such as class diagrams [6] [12] [16] [18] [21] [22]. However, there is little reference to metrics for behavioural diagrams such as statechart diagrams in existing literature. One of the first approaches towards the definition for behavioural diagrams can be found in 0, where metrics are applied to statechart diagrams developed with Object Modelling Technique (OMT) [29]. Yacoub et al. [35] propose dynamic metrics for Real-Time Object Modeling (ROOM) [32]. In [27] complexity measures for event-driven object-oriented conceptual models are defined. These proposals of metrics have not gone beyond the definition step. In our knowledge, there is no published works related to their theoretical an empirical validation. Therefore, and as was pointed out in [7] [8] [9] [27] the definition of metrics for diagrams that capture dynamics aspects of OOSS it is an interesting topic for future investigation. This fact motivated us to define metrics for behavioural diagrams, starting with metrics for measuring one critical internal quality attribute such as the complexity of UML statechart diagrams. Even though our goal is to centre on OOIS maintainability, it is an external quality characteristic that can only be evaluated once a product is finished or nearly finished. So that we centre our work on measuring an internal quality characteristic, the complexity of UML statechart diagrams, and ascertaining trough experimentation if there exist any correlation between those metrics and their understandability (a subcharacteristic of maintainability). We consider that evaluating (and if it is neccesary improving) the complexity of UML statechart
we can contribute to the understandability of UML statechart diagrams and therefore to the understandability of OOSS. The definition of metrics must be done in a methodological way to assure the reliability of the proposed metrics. According some suggestions provided in [4] and [11] about “how to define valid measures” we have followed a process consisting of three main tasks: measure definition, theoretical validation and empirical validation. For the definition and the theoretical validation of the measures we follow the DISTANCE framework [26][28], which assures the theoretical validity of the defined measures, i.e., that they measure the attribute they intend to measure. By means of the usage of the DISTANCE framework we can also assure that the proposed metrics are characterised by the ratio scale type, which as Zuse [36] pointed out it is a main concern when defining metrics for software artifacts. But theoretical validation it is not enough, empirical validation is critical for the success of any measurement activity [1] [15] [20] [30], because by means of empirical validation we can demonstrate with real evidence that the measures we proposed serve the purpose they were defined for and that they could be fruitful in practice. In this paper we show an experiment we carried out in order to evaluate if there is empirical evidence that UML statechart diagram complexity metrics are related to UML statechart diagram understandability. This paper is organised in the following way: Section 2 presents a proposal of measures for the complexity of UML statechart diagrams. The theoretical validation of the proposed metrics is carried out in section 3. A controlled experiment, for empirically validating the proposed metrics, is presented in section 4. Finally, the last section shows the conclusions and some lines which are still open for further investigation.
2. A proposal of measures for UML statechart diagrams The complexity of a statechart diagram is determined by the different elements that compose it, such as states, transitions, activities, etc. It is not advisable to define a single measure for the complexity of UML statechart diagrams, since a single measure of complexity cannot capture all possible aspects or viewpoints of complexity [14] instead several measures are needed, each one focusing on a different statechart diagram elements.
Table 1 outlines the set of metrics we propose to measure the complexity of UML statechart diagrams: Metric Name NUMBER OF ENTRY ACTIONS (NEntryA) NUMBER OF EXIT ACTIONS (NExitA) NUMBER OF ACTIVITIES (NA) NUMBER OF STATES (NS)
NUMBER OF TRANSITIONS (NT)
Metric definition The total number of entry actions, i.e. the actions performed each time a state is entered. The total number of exit actions, i.e. the actions performed each time a state is left. The total number of activities (do/activity) in the statechart diagram. The total number of simple states, considering also the simple states within the composites states. The total number of transitions, considering common transitions (the source and the target states are different), the initial and final transitions, self-transitions (the source and the target state is the same), internal transitions (transitions inside a state that responds to an event but without leaving the state)
Table 1. Metrics for UML statechart diagram complexity.
A relevant property is that the proposed metrics are simple and ease to automate, which are, as Fenton and Neil [16] remark in a recent paper related to the future of software metrics, desirables properties for software metrics.
3. Theoretical validation of the proposed metrics Firstly, in this section we will introduce the DISTANCE framework [26] [28] and later we will use this framework to theoretically validate the metrics proposed below.
3.1 DISTANCE framework The DISTANCE framework provides constructive procedures
for modelling software
attributes and defining the corresponding measures. The different steps of the procedure are inserted into a process model for software measurement that (i) details the required inputs, underlying assumptions and expected results, for each task (ii) prescribes the order of execution, providing for iterative feedback cycles, and (iii) embeds the measurement procedures into a typical goal-oriented measurement approach such as, for instance, GQM [2] [3]. In this section we summarise the procedures for attribute definition and measure construction for ease of reference. The framework is called DISTANCE as it builds upon the concepts of distance and dissimilarity (i.e., a non-physical or conceptual distance). Software attributes are modelled as
conceptual distances between the software entities they characterise and other software entities that serve as reference points or norms for measurement. These distances are then measured by functions that are called “metrics” in mathematics. These are functions that satisfy the metric axioms, i.e. a set of axioms that are necessary and sufficient to define measures of distance [28]. The measurement theoretic interpretation of the concept of dissimilarity is built into the framework.
This ensures that the theoretical validity of the measures obtained with
DISTANCE can be formally proven within the framework of measurement theory. A key feature of DISTANCE is that the constructive attribute modelling and measure definition procedures as presented in the process model, hide the complexity of the underlying measurement theoretic constructs from the user. Poels and Dedene take full advantage of the intuitiveness and flexibility of the distance concept to arrive at a measure construction framework that is transparent with respect to measurement theory and that is generic, i.e. not limited to the measurement of a specific software attribute. The distance-based measure construction process consists of five steps (see table 2). The process is triggered by a request to find or build a measurement instrument for a software attribute attr that characterises the software entities in a set P. There might for instance be a request that expresses the need for a measure of some complexity aspect of a statechart diagram. Table 2 summarises the required inputs and expected results of the five steps explained above . Step Find a measurement abstraction Model distances between measurement abstractions Quantify distances between measurement abstractions Find a reference abstraction Define the software measure
Inputs The attribute of interest attr A set of software entities P
Outputs A set of software entities M (to be used as measurement abstractions) A function abs: P → M
M
A set of elementary transformation types Te
M, Te
A metric δ: M × M → ℜ
Attr, P, M
A function ref: P → M (to return a reference abstraction for attr) A function µ: P → ℜ
P, abs, δ, ref
Table 2. Required inputs and expected results.
From a measurement theory point of view, the distance-based software measure construction process results in the definition of an attribute as a segmentally additive proximity structure and
in the definition of a measure as a metric with additive segments [33]. According to the uniqueness theorem associated with the representation theorem for segmentally additive proximity structures the resulting measures are characterised by the ratio scale type. For further details on the measurement theoretical principles underlying the approach we refer to [26] [28]. Before proceeding to the distance-based definition of the metrics for the UML statechart diagrams in the next section, we wish to clarify why we emphasise the theoretical validation of the proposed measures. In our opinion, the validity of the measurement instruments used for the variables of an empirical study is a key factor in the overall study validity. On the one hand, the theoretical validity of the complexity measures is used to claim their construct validity of the empirical studies carried out using those measures On the other hand, knowledge of the scale type of the measures is useful for choosing the appropriate statistical techniques to analyse the data obtained in the studies carried out for the empirical validation of the measures.
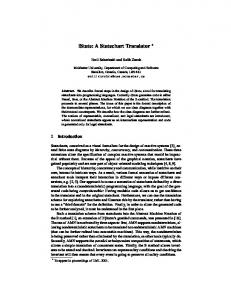
3.2. A distance-based definition of complexity measures for statechart diagrams In this section the distance-based definition of a particular measure NS (number of states) is elaborated in detail. We will follow each of the steps for measure construction proposed in the DISTANCE framework. In order to exemplify the process we will use the statechart diagrams shown in figure 1. Adjusting T
ST A
adjustment
switch on
ST B
T=T s eected
T selected
adjustment
T selected
Idle
Adjusting T
switch on
switch off
Idle
T>=T selected
T=T selected T>T selected
T