[ ~lli
illll
inli.1 I l l [ | 1
ililln i l l t l i iiLi I
Vol. 6, No. 4 t December 2002 pp. 379-387
Environmentat Engineering
}
]
Degradation of Propionate and Its Precursors: The Role of Nutrient Supplementation By Saroch Boonyakitsombut*, Moon I1 Kim**, Young Ho Ahn***, and Richard E. Speece****
Abstract The role of nutrient supplementation on anaerobic degradation of propionate and its precursors was investigated in this study. Substmtes used in this study were propionate, VFAs (from dog food-simulated primary sludge), and glucose. For propionate degradation, a pH-Stat system was used. Degradation of VFAs from dog food degradation was investigated by using a batch reactor while glucose degradation was investigated by using a semi-continuous fed system. Degradation of propionate and glucose were performed under mesophilic temperatures, while degradation of VFAs from dog food degradation was performed under both mesopbitic and thermophilic temperatures. The results demonstrated that nutrient supplemenlation played an important role in degradation of all substrates tested. For propionate degradation, addition of iron, cobalt, and nickel (10, 1, 1 mg/1, respectively) and/or yeast extract (100 rag/l) were found to enhance the propionate utilization rate by about double that of the control. For glucose, yeast extract addition caused higher gas production and lower effluent COD. For the degradation of VFAs produced from dog food degradation, daily calcium addition to a thermophilic batch-fed CSTR showed a higher gas production (75%) vs. the control. Keywords: mesophitic, nutrients, propionate, propionate utilization rate(PUR), thermophilic, volatile fatty acids(VFAs)
1. Introduction Poor effluent quality is often one of the most hnportant disadvantages of anaerobic treatment. In many cases, propionate has been responsible for a major portion of COD in the effluent. For example, Boeing (1997) investigated anaerobic degradation of carbohydrate wastewater under different loading rates. When the organic loading rate increased from 1.4 to 2.0 g/l-d, effluent propionate concentration was increased from 200 mg/1 to 2400 mg/l within 12 days. van Lier et al. (1996) found that propionate was the main VFA in the effluent of a thermophilic upflow staged sludge bed reactor treating either a sucrose-VFA mixture or VFAs as the sole substmte. It is possible that, in the degradation of complex substrates, fermentative bacteria deplete macro/micronutrients during subsWate oxidation and there thus is a subsequent lack of nuWients required by the syntrophic propionate degradation consortium, which then results in elevated propi-
onate concentrations in the effluent. If that is so, addition of that nutrient(s) should provide improved reactor performance. On the other hand, nutrients may be adequately present in terms of total concentration, but not adequate in terms of bioavailablity. Espinosa et al. (t995) studied the effect of trace metals supplementation on the anaerobic degradation of VFAs in molasses stillage. They found that the addition of Fe (100 mgh), Ni (15 rag/t), Co (10 mg/1), and Mo (0.2 mg/1) to the influent si~aificantty reduced the levels of propionic acid (5290 to 250 rag/l) and acetic acid (1100 to 160 rag/l). Azbar (1999) experienced high concentrations of acetate and propionate in the effluent o f a CSTR fed with dried milk and baby formula. When calcium (100 mg/1) and magnesium (100 rag/l) were added to the reactor as a slug dose, propionate and acetate concentrations reduced significantly, from 3000 to below 250 mg/l for propionate, and from 6500 to less than 250 mg/l for acetate. In both cases, nutrient supplementation seemed to enhance acetate degradation, which may have played a role in reduc-
*Assistant Professor,Dept. of Environmental Engineering, King Mongkuts Universityof Technology,Thonburi, Bankok, Thailand (E-mail:
[email protected]) **Post-Doc, Dept. of Civil and EnvironmentalEngineering, Vanderbilt University,Nashville, TN. USA (E-mail:moonil.kim@vanderbiltedu) ***Member,AssociateProfessor,Dept. of Civil Engineering, YeungnamUniversity,Kyungsan, South Korea (E-mail:
[email protected]) ****Professor,Dept. of Civil and EnvironmentalEngineering, VanderbiRUniversity,Nashville, TN. USA (E-mail:
[email protected]) The manuscript for this paper was submitted for review on June 5, 2002. Vol. 6, No. 4 / December2002
- 379 -
]
Saroch Boonvakitsombut et al,
pH Probe AC/DC(16ch)COnverte[r Computer
MagneticStirrer
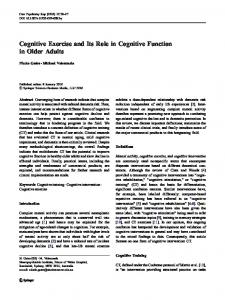
SupplementalHPr Fig. 1. SchematicDiagramof pH-Stat System
ing the threshold level for propionate. It could be that calcium and magnesium may also have played a direct role in stimulating propionate degradation. Chronically elevated propionate concentrations in the effluent o f anaerobic reactors are commonly reported. Until now, nutrient requirements for direct stimulation ofpropionate degradation have not been investigated. Thus, the objectives o f this study were to investigate the role of nutrient supplementation on degradation o f a) propionate, b) glucose, and c) VFAs from dog food degradation.
Table 1, VanderbiltMedia Chemical
rag/1 as ion.
NaHCO~
6540 mg/l HCO~-
NILC1
400 mg/l NIt4§
(NH~)~I-IPO~
22 mg/l Nt-~ 58 mg/l PO4 3-
(NaPO~)~
8.5 mg/l PO3
Na2S. 9H, O
4 mg/l S~
KC1
209 mg/1K-
CaCI2 921t20
14.1 mg/1 Ca2+
MgSO4 " 7H20
40 mg/1 Mg~+ i58 rag/1 SO4;
FeCI? - 4H20
5.8 rag/1 Fe~+
COC12 96H20
2.5 rag/1 Co2-
NiC12 96H20
0.13 mg/1 Niz§
ZnCI~
0.25 mg/1 Zn2+
ALCI3 - 6H;O
0.05 mg/1 A1j-
H3BOj
0.09 rng/I B3+
CuC1, - 2H,_O
0.19 mg/l Cu~+
KI
115 mg/l K~ 3.75 mg/t I
MnC12 "4H20
0.15 mg/t Mnz+
Na2MoO~ ' 2H20
0.20 mg/l Mo~r
NazSeO,~
0.21 mg/1 Se6+
NH4VO~
0.22 mg/[ Vs~
Na2WO~ ' 2H20
0.28 mg/1 V~~
2, Materials a n d M e t h o d s
2.1 Nutrient Requirements for Anaerobic Degradation of Propionate with pH-Stat System The nutrient requirement for high rate propionate degradation was conducted at mesophilic temperature (35~ with a pH-Stat system. The schematic o f the pH-Stat system is shown in Fig. 1. First, the anaerobic granules (Smuckers Jelly, Inc.) were homogenized in a blender and mixed with Vanderbilt Media (Table 1), resulting in a biotaass concentration o f 8000 mg/1. 150 ml o f this mixed liquor was added to each reactor o f the pH-Stat system. The pH in each reactor was controlled at 7.0 and the propionate concentration in each reactor was maintained at approximately 3000 mg/l COD. This concentration had been demonstrated to not result in any substrate toxicity to the biomass and yet support near maximum specific utilization rates. The pH in the reactor was monitored by a pH probe and data were sent to a computer. When the pH in the reactor increased to 7.1
- 380 -
KSCE Journal of Civil Engineering
Degradation of Propionate and Its Precursors:The Role of Nutrient Supplementation due to propionate consumption, a propionic acid stock solution (20%) was pumped into the reactor (under computer control) until the pH was below 7.0 and then the pump stopped. Tile main reactor had a liquid volume o f 150 ml and the HRT was controlled at 15 days with Vanderbilt Media. (Note the alkalinity was 14000mg/l NaHCO3.) Nutrients were added manually once a day. The concentrations of nutrients spiked to the respective reactors are shown in the Results section. The kind of nutrients added into each reactor and their effects are also reported in the Results section. The rate ofpropionate utilization was monitored daily.
2.2 Nutrient Addition Impact on Performance of CSTR Fed with Glucose Two hundred ml of mixed liquor t~om a batch-fed CSTR treating glucose was transferred to each o f 4 bottles as the inocula. The mixed liquor had a chronically elevated propionate threshold concentration of about 3000 mg/1 COD which had persisted for weeks. Then, each reactor was capped with a rubber stopper after the reactor headspace had been flushed with a gas mixture of nitrogen and carbon dioxide (80:20). The reactors were incubated at 35~ Subsequently 200 mg of glucose (10 ml o f glucose solution
Table 2. Types and Concentrations of Nutrients Added to Each Reactor Reactor
Nutrient added (concentration in reactor, mg/l)
1 (Control)
None
2 (Yeast extract)
Yeast extract (100)
3 (Ca)
CaCI2 (100)
4 (Fe,Ni,Co, Mo)
FeCI2(10), CoCl~ (1), NiCI2 (1), MoO4 (1)
mixed with Vanderbik Media at a concentration of 20,000 mg/1 COD) was fed daiIy into each reactor after 10 ml of mixed liquor had been removed. The HRT and OLR were controlled at 20 days and 1 g/l-d, respectively. Gas production and reactor pH were monitored daily. COD was analyzed as needed. The type and concentrations of the nutrients added to each reactor are shown in Table 2.
2.3 Nutrient Addition Impact on Degradation of Chronically Elevated VFA Concentrations from Mesophilic and Therrnophitic Reactors Treating Dog Food At the time that the nutrient requirement for degradation o f elevated propionate thresholds was being studied, 4 different mesophilic reactor configurations and 4 different thermophilic reactor configurations fed with dog food had chronicaliy high VFA threshold concentrations in the effluent for weeks. The types o f reactor configuration, operating parameters, and threshold effluent VFA concentrations are shown in Table 3. It can be seen that the main VFAs were acetate, propionate, and butyrate. Three hundred ml o f mixed liquor from each of the 8 reactor configurations containing chronically elevated threshold VFA concentrations were divided equally into 10 serum bottles (150 ml. each). This resulted in a total of 80 assay bottles for this study. After that, the headspace of each bottle was flushed with a gas mixture o f nitrogen:carbon dioxide (80 : 20). Then, all bottles were capped with robber stoppers, nutrients were added into each bottle. The assay bottles from mesophilic reactors were incubated at 35~ while the assay bottles seeded with thermophilic mixed liquor were incubated at 55~ Details of nutrients added into each bottle are shown in Table 4. The concentrations used are shown in Table 5, Mixing was provided by hand shaking once per day. Gas production was monitored daily.
Table 3. Characteristics of Mixed Liquor from Dog Food Reactors for Nutrient Supplementation Study Type of Reactor
Concentration (mg/t as VFA)
Operating Parameters Feed (a)
HRT (day)
Acetate
Propionate
i-Butyrate
n-Butyrate
Dog Food 4%
20
1980
1150
450
170
520
70
290
Mesophilic (35~C) *Batch-fed CSTR *Cont.-fed CSTR
Dog Food 4%
20
1880
*Two-phase C STR
Dog Food 4%
20
1730
760
110
590
*ABR
Dog Food 4%
20
750
450
30
30
*Batch-fed CSTR
Dog Food 4%
20
4170
920
210
270
*Cont.-fed CSTR
Dog Food 4%
20
3820
910
130
640
*Two-phase CSTR
Dog Food 4%
20
1620
1000
190
1340
*ABR
Dog Food 4%
20
2340
830
120
1050
Thermopkilic (55~C)
(a) Supplemented with 6 g/l NaHCO~ Vol. 6, No. 4/December 2002
- 381 -
Saroch BoonyakTtsombut et at.
Table 4. Type of Nutrient Supplemented to Each Reactor (total of 80 reactors) Reactor number Nutrient Added
Thermophilic
Mesophilic Batch-Fed
Cent-fed
Two-Phase
ABR
Batch-Fed
Cent-Fed
Two Phase
ABR
Control
1
11
21
31
41
51
61
71
Yeast Extract
2
12
22
32
42
52
62
72
Ca
3
13
23
33
43
53
63
73
P+Mo
4
14
24
34
44
54
64
74
Fe
5
15
25
35
45
55
65
75
Co
6
16
26
36
46
56
66
76
Ni
7
17
27
37
47
57
67
77
Fe, Ni, Co
8
18
28
38
48
58
68
78
All
9
19
29
39
49
59
69
79
All (daily)
10
20
30
40
50
60
70
80
column packed with a 0.3% Carbowax 20 M/0.1 H3PO4, 60/80 Carbopack C (Supelco, Inc.). The column temperarare was 140~ and the injector/detector temperature was 200~ Nitrogen was the carder gas with a flow rate of 50 ml/min. Data integration was accomplished using a Varian 4270 integrator. Samples were prepared by centrifuging (Beckman Instruments, model GP) at 4000 rpm for 15 minutes and then filtering through 0.45-gm filter paper (Micron Separations, Inc.). The filtered sample was acidified with i0 % H3PO4 to lower the pH below 3. Gas production was measured by a water displacement method. VSS analysis followed Standard Methods (ALPHA et at., 1992). pH was measured with a pH meter (Model 107, Fisher Scientific, Co.) and pH probe (E-05992, Cole Parmer Instrument Co.).
Table 5. Concentrations of Nutrient Supplemented to Each Reactor Reactor
Nutrient added (concentration in reactor, mg/lJ
1 (Control)
None
2 (Yeast Extract)
Yeast Extract (100)
3 (Ca)
CaC12 (100)
4 (P+Mo)
(NH,02HPO4 (100), NaMoO4 (1)
5 (Fe)
FeC12(10)
6 (Co)
COC12(1)
7 ~i)
yic]~ (t)
8 (Fe,Ni,Co)
FeCtz (10), CoCk, (1), NiCI2(1)
9 (All)
Yeast Extract (1 DO),CaCtz (100), (NI-h)2HPO4 (100), MoO4 (I), FeC12(10), CoC12 (1), NiCh (1)
3. Results These assays were batch operated with no further feeding of dog food after Day 1. The experiment was divided into 2 periods. In the first period (Day 1 to Day 37), nutrients for each reactor were added only on Day 3, except the bottles labeled with "All (Daily)", which indicates nutrients were added every day since Day 3. in the second period (Day 38 to Day50), nutrients for every reactor were added every day.
3.1 Nutrient Requirements for Anaerobic Degradation of Propionate with pH-Stat System The effect o f nutrient addition on the propionate utilization rate (PUR) is shown in Figs. 2a through 2d. Nutrients supplemented to each reactor were spiked directly to the reactor once a day. The concentration of specific nutrients spiked into various reactors were as follow: 9 1 mg/l o f reactor per day for Molybdate 9 10, 1 and 1 mg/l of reactor per day for iron, nickel, and cobalt, respectively 9 100 rag/1 of reactor per day for yeast extract.
2.4 Analytical Methods The COD was analyzed using the closed-reflux, spectrephotometer method as described in Standard Methods (APHA et al., 1992). The samples were filtered by GF/C filter paper (or equivalent). VFA concentrations were analyzed by using a gas chromatograph (Shimadzu C_K2-14A) equipped with a frame ionization detector and a 1.7 m glass
Fig. 3 shows the 5-day average PUR of various reactors supplemented with different nutrients. The data for an aver-
382
KSCE Journal of Civil Engineering
Degradation of Propionate and Its Precursors:The Role of Nutrient Supplementaiion 6.O
96,
No Ms ~l~ltion
I Ms addibon
8.0 | I
Fe, Ni, Co addition
NO Fe, Ni. Co addison
7 ~176 4.0
s.C, 1
.4.A_ LO
:~ 1~
20
3o
.~c
=~o
6O
70
c
80
lO
t/
9-O-Fe Ni Co -I--Cc~ltrol i 2G
3o
Pays (a) Me
10o
--:/"
9.0 8.0
addit~n
9.0
~9
Fr Ni, Co, Ms, Yeast Extract
No Fe, Ni, Co, Ms,
7.6
>fL
60
i
30
66
80
7.0 m
5o
(b) Fe. Ni, Co Yeast ~
No yeast exkact addr
6o
)!
- 7
5,O $.0 -
-
r 3.6
. . . . . . .
2.0
2,0
tO
i.d
0,0
oI --,,~ Y=,