hydrocortisone, testosterone, cycloheximide, concanavalin. A, demecolcine, cytochalasin B) were added at the concentrations given below to the perfusate or to ...
Vol. 5, No. 10
MOLECULAR AND CELLULAR BIOLOGY, OCt. 1985, p. 2623-2632
0270-7306/85/102623-10$02.00/0 Copyright © 1985, American Society for Microbiology
Dependence of Liver-Specific Transcription
on
Tissue Organization
DAVID F. CLAYTON, ALLAN L. HARRELSON, AND J. E. DARNELL, JR.*
The Rockefeller University, New York, New York 10021 Received 8 April 1985/Accepted 3 July 1985
When the liver is disaggregated and hepatocytes are cultured as a cellular monolayer for 24 h, a sharp decline (80 to 99% decrease) in the transcription of most liver-specific mRNAs, but not common mRNAs, occurs (Clayton and Darnell, Mol. Cell. Biol. 2:1552-1561, 1983). A wide variety of culture conditions involving various hormones and substrates and cocultivation with other cells failed to sustain high rates of liver-specific mRNA synthesis in cultured hepatocytes, although they continued to synthesize common mRNAs at normal or elevated rates. In contrast, when slices of intact mouse liver tissue were placed in culture, the transcription of liver-specific genes was maintained at high levels (20 to 100% of normal liver). Furthermore, we found that cells in the liver could be disengaged and immediately reengaged in a tissue-like structure by perfusing the liver with EDTA followed by serum-containing culture medium. Slices of reengaged liver continued to transcribe tissue-specific mRNA sequences at significantly higher rates after 24 h in culture than did individual cells isolated by EDTA perfusion followed by culturing as a monolayer. Therefore we conclude that a mature tissue structure plays an important role in the maintenance of maximum tissue-specific transcription in liver cells.
The liver offers many advantages in the study of cell differentiation. A single cell type, the hepatocyte, constitutes over 90% of the mass of the organ (13), which in adult mammals accounts for 1% or more of total body weight (9). The liver from a single 30-g mouse, for example, contains more than 108 hepatocytes (4). Furthermore, unlike many other differentiated tissues, the architecture of the liver is uniform throughout the organ: hepatocytes, linked by tight junctions and contacting an extracellular matrix, are arranged in plates separated by sinusoids (frequently fenestrated capillaries) that are lined by rather scarce endothelial cells (19). This architecture in the adult reflects a continuation of the interaction of endodermal and mesodermal components that begins with-tissue induction (16, 26). Finally, more cell-specific protein products (intracellular enzymes and secreted proteins) are known for hepatocytes than perhaps any other cell type (20), and the molecular basis for cell-specific gene control is now a central issue in developmental biology. To study liver-specific gene control we have selected cDNAs that are complementary to a series of mRNAs present in liver, but not in brain and cultured cells (8). With this material it was shown that transcriptional activation underlies the production of most liver-specific mRNAs. This conclusion was reached by comparing liver with other tissues (8, 36) and by examining the liver from about 14 days of gestation to adulthood (36). Also, cells regenerating liver were found to continue high rates of liver-specific mnRNA synthesis (11), implying that liver-specific gene control is not tightly linked to control of the cell cycle and replication. Evidence of specific signals or mechanisms which coordinate the transcription of liver-specific genes in the adult organ has come from experiments with primary cultures of hepatocytes (4). When the liver was disaggregated and the hepatocytes were cultured as a cellular monolayer for 24 h, a sharp decrease was observed in the transcription of most liver-specific mRNA sequences, but not of mRNAs common to all cells. The cells do continue to make liver-specific RNAs, but at a greatly reduced rate. Thus something critical for the maximum rate of transcription for most liver-specific *
genes must be lost when hepatocytes are dispersed and cultured. This critical element was presumed to involve either tissue organization (cell contacts, shape, or structure) or soluble components of the humoral environment (nutrients or hormones and other factors). In this paper, we examine further the decrease of tissuespecific transcription that occurs in hepatocytes when they are cultured as cell monolayers. Various alterations in the culture medium do not sustain specific transcription at high rates. However, when hepatocytes are cultured as slices of tissue where cell contact and cell architecture are maintained, tissue-specific transcription is maintained at a high rate (20 to 100% of the maximal rate). The cells in slices continue the high rate of liver-specific RNA synthesis in culture medium lacking added hormones or serum. Thus tissue organization, and not nutritional conditions, appears to be most important in maintaining a high rate of liverspecific transcription for the 24-h period examined. Another separate line of research, examination of liverspecific products in hepatoma cell lines (reviewed in reference 45), has also provided evidence for mechanisms of coordinate control of liver-specific genes. In the accompanying paper (5) we compare liver-specific mRNA production in various hepatoma cell lines, and from the results of these two sets of experiments we conclude that liver-specific transcription can be activated to a low level of expression that continues in isolated cells, but a high level of transcription requires that hepatocytes be organized in mature, intact tissue. MATERIALS AND METHODS Preparation of primary hepatocyte cultures. Hepatocytes were isolated from C57/B6 mouse livers by perfusion with EDTA followed by collagenase (Worthington Diagnostics; class II) at 100 U/ml (4). Hepatocytes were released when EDTA was omitted from the first perfusion step, but with lower viability and yield (about 40% viability of 7 x i07 cells). Where appropriate (see below), other constituents (insulin, hydrocortisone, testosterone, cycloheximide, concanavalin A, demecolcine, cytochalasin B) were added at the concentrations given below to the perfusate or to the initial cell suspension. Cells were plated in the appropriate culture
Corresponding author. 2623
2624
CLAYTON ET AL.
MOL. CELL. BIOL. TABLE 1. Recombinant cDNA-containing plasmids in these experiments
Function
Liver Functions
Common Functions and Controls
Abbreviationa
Encoded product
1 2 3 4 5 6 9 10 Al
Major urinary protein Unknown
a-1-Antitrypsin Unknown Unknown Transferrin or related Unknown Unknown Serum albumin
p
(Plasmid vector)
Ac aT bT B tR 28S
P-Actin a-Tubulin P-Tubulin Unknown tRNA-arginine 28S rRNA
Source
Mouse Mouse Mouse Mouse Mouse Mouse Mouse Mouse Mouse
Plasmid designation plivS-1 plivS-2 plivS-3 plivS-4 plivS-5 plivS-6 plivS-9 plivS-10 pmalb2
Donor or reference
Derman et al. (8) Derman et al. (8) Derman et al. (8) Derman et al. (8) Derman et al. (8) Derman et al. (8) Derman et al. (8) Derman et al. (8) Kioussis et al. (22)
pBR322
Chicken Human Rat Chinese hamster Xenopus laevis Mouse
pAl pCHO-B pyH48
Cleveland et al. (6) P. A. Sharp N. Cowan Harpold et al. (15) D. Brown N. Arnheim
a These abbreviations are used in the keys to the figures and tables. The encoded products of plivS-3 (alpha-1-antitrypsin) and plivS-6 (transferrin) have recently been identified (manuscripts in preparation).
medium on 150-mm (Falcon) or 100-mm (Nunc) plastic tissue culture dishes or (as indicated below) on bacterial petri dishes covered with biomatrix substrate (10, 38) that were prepared and provided by L. Reid and D. Jefferson. Cells were routinely plated at a density of 6 x 10⁴/cm2, although density could be varied between 2 x 10⁴ and 16 x 104 cells per cm2 (33) with a minimal effect on the transcriptional profile. Cells were maintained in humidified incubators (5% CO2 in air) or under a humidified atmosphere of 5% CO2 in 02 at 37°C. Attached cells were rinsed and given fresh medium after 2 h in culture. For suspension cultures, hepatocytes were placed in Erlenmeyer flasks on a rotary shaker (50 to 100 rpm) at 37°C under an atmosphere of 5% C02-95% 02Hepatocytes were released from the liver without using collagenase by retrograde perfusion (4), typically for 1 h with HEH, which contained the following (per liter): 400 mg of KCl, 60 mg of KH2PO4, 8,000 mg of NaCl, 90 mg of Na2HPO4 * 7H20, 1,000 mg of dextrose, 17 mg of phenol red, 10 mM EDTA, and 5 mM HEPES (N-2-hydroxyethylpiperazine-N'-2-ethanesulfonic acid) (pH 7.3). The flow rate was maintained at 7 ml/min with a peristaltic pump, the temperature was maintained at 37°C, and a mixture of 95% 02 and 5% CO2 was bubbled slowly through the perfusate reservoir. After dispersion and centrifugation, the cells from one liver were suspended in the perfusing solution (12 ml) followed by the addition of 13.7 ml of isoosmotic Percoll (Pharmacia Fine Chemicals; made by adding 1 part of 1.5 M NaCl to 9 parts of Percoll), to result in a solution density of 1.07 g/ml. The suspension was centrifuged at room temperature for 30 min (1,500 x g) to yield a pellet of approximately 3 x 10⁷ cells (>95% viable by trypan blue exclusion). Fetal liver cells were liberated by incubating minced fetal livers in the collagenase solution used to isolate hepatocytes (above) at 37°C for about 1 h with several changes. Cell culture media and additives. For basal culture conditions, cells were cultured in Dulbecco minimal essential medium with insulin (Iletin I; Eli Lilly & Co.) and hydrocortisone sodium succinate (Solu-Cortef; The Upjohn Co.) added at 10 mg/liter each, heat-inactivated fetal bovine serum (Sterile Systems) added to 10%, and gentamicin (Schering Corp.) added to 50 mg/liter. Non-heat-inactivated serum had no different effect on the visible appearance of cultures or on transcription. Other alterations of the basal
medium included the addition of the following: horse serum (Sterile Systems) at 10%, testosterone (Sigma Chemical Co.) at 10-6 to 10-7 M, epidermal growth factor (Sigma) at 2 mg/liter, glucagon (Sigma) at 10 mg/liter, all-trans retinoic acid (Eastman Chemical Products, Inc.) at 10-7 M, dimethyl sulfoxide (Sigma) at 1.5%, dibutyryl cyclic AMP (Sigma) at 10-' to 10-3 M, sodium butyrate at 5 mM, cycloheximide (Sigma) at 22 mg/liter, concanavalin A (Calbiochem) at 25 mg/liter, CaC12 at 6 mM, A23187 (Calbiochem) at 1 mg/liter with dimethyl sulfoxide at 1.5%, sodium orthovanadate at 10 ,uM, cytochalasin B (Sigma) at 2 x 10⁻⁵ M plus 0.5% dimethyl sulfoxide, and demecolcine (Sigma) at 1 ,uM. The hormonally defined medium of Enat et al. (10) was provided by L. Reid and D. Jefferson and contains the following: RPMI medium with penicillin (100 U/ml), 100 streptomycin (jxg/ml, insulin (265 mU/ml), glucagon (10 ,ug/ml), epidermal growth factor (50 ,ug/ml), prolactin (2 mU/ml), human growth hormone (10 ,uU/ml), linoleic acid (5 p.g/ml with delipidated bovine serum albumin [BSA], 1 ,ug/ml), copper (10-7 M), selenium (3 x 10⁻¹⁰ M), and zinc (5 x 10-11 M). Argininefree ornithine-supplemented basal medium of Leffert et al. (27) and Williams D medium were obtained from GIBCO Laboratories and were supplemented with insulin, hydrocortisone, and serum as described above for basal medium. Hepatocytes were infected with adenovirus 5 by addition to the medium of 5,000 particles per cell after 36 h in culture (this resulted in cell death about 2 days later, and transcription of the ElA gene was robust by 6 h postinfection). Liver extract was prepared by polytron homogenization in the cold of adult mouse livers in Dulbecco minimal essential medium and clarification by centrifugation (5 min at 1,000 x g); supernatants were prepared from a total of six livers in three installments over 24 h and added immediately to the culture medium (36 ml) of 3 x 10⁷ hepatocytes (about one-third of one liver). For most long-term cultures the medium was changed every 1 or 2 days, except in experiments with arginine-free medium when the medium was not changed after initial cell attachment and rinsing (27). Coculture of hepatocytes with other cell types. Rat liver epithelial cells were provided by C. Guguen-Guillouzo and cocultured with mouse hepatocytes as described previously (14). Bovine aortic endothelial cells were provided by, E.
2625 TISSUE ORGANIZATION AND LIVER-SPECIFIC TRANSCRIPTION from of autoradiographs analysis 2. Densitometric TABLE transcription experiments Jaffe and seeded at a 1:1 ratio onto attached hepatocytes VOL. 5, 1985
after 2 h in culture. Mouse liver nonparenchymal cells were centrifuged at a high speed (500 x g for 10 min) from the supernatant after freshly dissociated hepatocytes had been pelleted at low speed, yielding about 3 x 10⁷ nonparenchymal cells from one mouse liver; 1 to 10 times as many nonparenchymal cells were plated along with fresh hepatocytes. Liver slice preparation and culture. Livers to be sliced were first perfused with about 20 ml of Dulbecco modified essential medium or basal culture medium (see above). Liver lobes were arranged flat side down on the chopping platform of the Mcllwain Tissue Chopper (Brinkmann Instruments, Inc.) and were cut twice at right angles. Although a slicing thickness of 0.325 mm was usually used, thickness could be varied between 0.150 and 0.450 mm with negligible effect on specific gene transcription in incubated slices. Reengaged livers (described below) were cut at a thickness of 0.450 mm, although the resulting fragments were approximately 0.200 mm in diameter. Newly prepared slices were separated from one another by pipetting in basal medium and were washed in several changes of basal medium before culturing began. Slices from one liver or the equivalent were placed in two 500-ml Erlenmeyer flasks with 70 to 100 ml each. A constant stream of the humidified gas mixture (5% CO2 in 02) was introduced into the flasks throughout the culture period. The rotary shaking rate was adjusted (usually 70 to 80 rpm) so the slices spread evenly or formed a slowly revolving ring at the bottom of the flask (clumping in the middle and washing up on the side were avoided). The medium was changed first at 2 h and typically every 4 to 8 h thereafter by gravity sedimentation in the culture flasks and aspiration of the supernatant.
Recombinant plasmids. The plasmids used in these experiments are described in Table 1. Plasmids were grown in Escuherichia coli strains, harvested, and purified as described previously (28). Isolation of nuclei. Nuclei were isolated for transcription rate analysis by Dounce homogenization or pelleting through a sucrose cushion (4). Nuclei were typically isolated from washed slices by Dounce homogenization in reticulocyte standard buffer with 0.2% Triton X-100 (4). Preparation of nascent-labeled nuclear RNA. Isolated nuclei were washed in an ice-cold buffer of 20 mM Tris (pH 8.1 at room temperature), 20% glycerol, 140 mM KCI, 5 mM MgCl2, 1 mM MnCI,, and 14 mM 2-mercaptoethanol. The nuclei were suspended and incubated for 12 min at 30°C in 1 to 3 volumes of the same buffer (pH 7.9), but with the addition of [ax-32P]UTP (New England Nuclear Corp.; 007H) to 1 mCi/ml, phosphocreatine to 10 mM, and creatine kinase to 100 ,ug/ml. Nuclei were lysed by diluting the reaction (typically 0.3 to 1.0 ml) with 1.5 ml of 0.5 M NaCl-0.01 M Tris [pH 7.4]-0.05 M MgCl2-0.002 M CaCl, and pipetting. RNase-free DNase (200 to 400 U; Worthington Diagnostics) was added, and the reaction was held at room temperature with pipetting for about 1 min. Sodium dodecyl sulfate (to 1.5%) and EDTA (to 30 mM) were added, and the reaction was diluted by the addition of 4.5 ml of 10 mM EDTA-10 mM Tris (pH 8.4)-0.5% sodium dodecyl sulfate. After extraction with phenol-chloroform-isoamyl alcohol (24:24:1) and chloroform, RNA was precipitated twice from a large volume (6 to 8 ml) at -20°C with yeast tRNA carrier (10 ,g/ml), 0.2 M NaCl, and 2.5 volumes of ethanol. Incorporated radioactivity was measured by scintillation counting after spotting samples on DE81 paper and washing several times (5 min each), first in a solution of dibasic
Absolute densitya Probe
1 2 3 4 5 6 9 Al Ac aT tR p
Maximum error
High input. low exposure
Low input. high exposure
Low input, low exposure x 4.73
Avg
21.3 18.8 13.2 2.0 1.7 1.1 2.6 11.7 5.4 1.6 23.6
21.5 19.8 13.5 1.8 1.8 1.1 2.4 10.4 5.3 1.5 23.6
24.0 21.2 14.2 1.9
22.3 19.9 13.6 1.9
4.5 6.5 4.4 5.0
2.5 10.5 4.8 1.3 24.9
4.0 11 21 30 10
0
0
2.4 9.5 3.8 0.9 27.4 0
(+ %)
a The densities of dots on autoradiographs were determined by optical scanning and integration; units are in a linear scale, defined by the densitometer. The numerical values for the low-input, low-exposure combination (Fig. 1A) were multiplied by 4.73 to give numbers comparable to the high-input, low-exposure or low-input, high-exposure combinations. Signals for plivS-5 and -6 were not detectable with this combination. Many of the signals from the high-input, high-exposure combination (Fig. 1D) were too dark for densitometric measurement. Maximum error is the largest deviation from the mean of the three measurements, expressed as a percentage of the mean.
sodium phosphate (50 g/liter) and sodium pyrophosphate (8.9 g/liter), then in dibasic sodium phosphate (50 g/liter) alone, and then briefly once each in distilled water and 95% ethanol. Incorporation of approximately 1.0 (± 0.5) cpm per nucleus was usually achieved with nuclei from mouse liver and slice cultures, and two to three times as much incorporation was achieved with nuclei from monolayers after 24 h of culture. Hybridization of nuclear RNA to plasmid DNA. Recombinant plasmid DNAs (Table 2) were applied to nitrocellulose filters in 5-,ug dots and baked (22, 43). A dot of plasmid vector DNA (pBR322) was always included as a measure of nonspecific hybridization. Replicate filters were prehybridized for 2 h at 65°C in a solution containing 2 x TESS [50 mM N-tris(hydroxymethyl)methyl-2-aminoethanesulfonic acid, 300 mM NaCI, 10 mM EDTA, and 0.2% sodium dodecyl sulfate (pH 7.4)] plus 1 mg of yeast tRNA per ml, 0.2% Ficoll, 0.2% polyvinyl-pyrrolidone, and 1.0% sodium pyrophosphate. Labeled nuclear RNA was suspended in a buffer containing 2x TESS plus 0.1 mg of tRNA per ml, 0.02% Ficoll, 0.02% polyvinylpyrrolidone, and 0.1%, sodium pyrophosphate. Samples to be compared were brought to the same concentration of radioactivity by adjusting solution volumes, and 1 to 2 ml of each solution was applied to a prehybridized replicate filter. A 1,000- or 2,000-fold dilution was used for measuring 28S rRNA in a separate hybridization. Filters were hybridized under Paraffin oil at 65°C with rotary shaking for 35 to 40 h. Filters were washed in 2 x SSC (1x SSC is 0.15 M NaCI plus 0.015 M sodium citrate) at 65°C and treated for 1 h at 37°C with pancreatic RNase (0.4 ,ug/ml) and Ti RNase (10 U/ml) followed by proteinase K (50 ,ug/ml in 150 mM NaCl-1 mM EDTA-1 mM Tris [pH 7.4]-1% sodium dodecyl sulfate) for 1 h at 370C, with rinses (in 2x SSC) after each treatment. Autoradiography and densitometry. Washed hybridization filters were exposed to preflashed (25) Kodak XAR-5 film at -70°C with intensifying screens. After development, signal intensity was measured with a Helena Quick-Scan Jr. densitometer. In the course of numerous experiments, the
CLAYTON ET AL.
2626
lx exposure
B
I
C
0 40 80._ * *-. 5 2 6 3 9 4 Al
.
5x exposure
A X6 40 *.
MOL. CELL. BIOL.
0
p Ac
aT R 28S
D
'-..
_I;
;4 *4
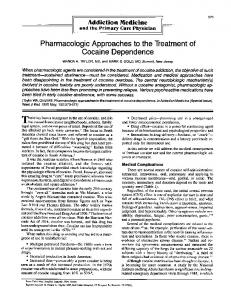
FIG. 1. Linearity of transcription assay for variations in RNA input and autoradiographic exposure time. Plasmid DNAs were dotted on nitrocellulose filters and hybridized to nascent-labeled RNA from fresh mouse liver nuclei prepared by tissue slicing and Dounce homogenization (Materials and Methods). Autoradiographs of the filters after hybridization and washing are shown. Two hybridizations were performed with different inputs of the same labeled RNA sample, and two exposures of the filters to preflashed X-ray film were taken to result in the four images shown. Panels: (A and C) 2.5 x 10⁶ cpm of labeled nuclear RNA was hybridized to the filter; (B and D) 11.8 x 101 cpm of labeled nuclear RNA (equivalent to that isolated from two-thirds of one liver) was hybridized to the filter. The 1x exposure (A and B) was for 3.8 h, and the 5x (4.73) exposure (C and D) was for 18 h. The key shows the arrangement of plasmid DNA dots on the filters. (Table 2 gives quantitation of these autoradiographic signals.)
relative transcription rate of RNA complementary to CHO-B was consistently the same in different preparations of hepatocyte nuclei from tissues or cultured cells (unpublished observations), and we have found the signal for CHO-B to be useful as an internal standard of hybridization. To compare quantitations of hybridizations using different inputs of radioactivity, and to correct for any small variations in hybridization conditions or specific activity of labeled RNAs, quantitative data from densitometric analysis (Tables 4 and 7) were normalized to set the CHO-B signal equivalent in all samples. RESULTS Quantitative assay of specific mRNA transcription rates. To measure the rate of transcription of specific genes in different populations of cells, we isolated nuclei from the cells and allowed already initiated RNA chains to be elongated in the presence of [32P]UTP. Under the conditions used, the amount of labeled UTP incorporated into RNA is proportional to the number of polymerases active on each primary transcription unit at the time of nuclear isolation (7). Equal amounts of radiolabeled RNA from the different samples of nuclei were hybridized to cloned DNA samples (see Table 1) deposited as dots of DNA on nitrocellulose (21). The DNA
samples included some that are complementary to liverspecific mRNAs and others that are complementary to mRNAs that are common to many cell types. The amount of hybridization was assayed by autoradiography of RNaseresistant hybrids followed by densitometric scanning. The relative transcriptional activity of each liver-specific gene could thus be compared, both between different samples and to the relatively constant transcription of the common genes. To determine the quantitative accuracy of this dot-hybrid autoradiographic technique, the experiment shown in Fig. 1 and Table 2 was conducted. The quantitative accuracy of this assay is dependent upon two factors. First, plasmid DNA probes should be in sufficient excess to their complementary RNAs so that the amount of each RNA hybridized will be directly proportional to its concentration in the hybridization solution. Second, the density of the autoradiographic image on film should be in direct proportion to the product of exposure time and radioactive signal intensity. The experiment shown in Fig. 1 and Table 2 shows that both of these conditions are met for the procedures we have used. Two amounts of nascent-labeled mouse nuclear RNA were hybridized to filters containing plasmids representing the full range of signal intensities encountered in these experiments. Decreasing the amount of RNA normally used in the hybridization reaction by a factor of about 5 (4.73) resulted in an equivalent decrease in signal intensity for all of the plasmids A
* *
1
2 6 bT 28S 3 9 B R 4 10 p E2
* C
1 * * B~~~~~J
5 Al Ac
***, 0
*
it
4W
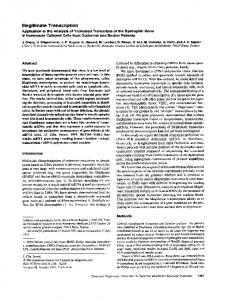
FIG. 2. Transcription rate analysis of liver slice cultures compared with normal liver and monolayer cultures. Autoradiographs of plasmid DNA-containing filters prepared and hybridized as in Fig. 1. Equal counts of nascent-labeled nuclear RNA from mouse liver (A), mouse liver slices cultured in basal medium (B), slices cultured in basal medium with no added hydrocortisone or insulin (C), and isolated hepatocytes cultured in basal medium (D) were hybridized to replicate filters. Liver slices and isolated hepatocytes were prepared as described in the text and cultured for 24 h under an atmosphere of 95% 0, and 5% CO2 with a total of five changes of culture medium each. The combined slices from three livers were split into three equal samples for B, C, and a third culture (not shown; described in footnote a of Table 5). The plasmid DNA probes used (Table 1) were arranged on the filters as indicated in the key at the upper right-hand corner. The probe for the E2 gene of adenovirus 5 was included for other reasons, but indicates the presence of a cross-reacting RNA in mouse liver cells that has been observed in other experiments (unpublished observations).
VOL. 5, 1985
TISSUE ORGANIZATION AND LIVER-SPECIFIC TRANSCRIPTION
(Table 2). Thus, the hybridization signal varied linearly with the input of a single preparation of RNA. When the exposure time of the filter from the hybridization reaction with lower input (Fig. 1C) was increased by about fivefold, the autoradiographic image was indistinguishable from that obtained with the approximately fivefoldhigher input of RNA and short exposure (Fig. 1B). The weakest signal that could be read with confidence at the lowest exposure (Fig. 1A) was about 1/20 of the strongest; since the strongest signal increased proportionately with a 5-fold increase in exposure time (Fig. 1C), we were able to obtain a linear measure of signal intensities over a range of at least 100-fold. The only significant departures from linearity were observed with very weak hybridization signals in very short exposures (for example, probes 5 and 6 in the low input-short exposure combination gave no detectable autoradiographic signal; Table 2). For densitometric analysis of very low signals, therefore, we always used exposures in which the signal for pBR322, representing the background of nonspecific hybridization, was detectable. As shown in Table 2, errors of +4 to 11% were estimated in measurements of moderately to intensely transcribed genes (plivS-1 through -4 and -9, albumin) and errors of +30% for genes giving weak transcriptional signals (actin, a-tubulin). Loss of liver-specific transcription in isolated hepatocytes. Starting from the previous observation that liver-specific gene transcription in hepatocytes declines during the first 24 h of primary culture (4), we first sought culture conditions which would halt or reverse this decline. Freshly isolated cells were cultured under many different conditions, including the routine culture conditions (10% fetal bovine serum in
A
1 2 3 4
.6*
._
0. .1 ~
B
*
5 p 6 Ac 9 aT Al R 28S
_
*
C
..
Mu
..
*
#...
*
,.
*
*0 0
FIG. 3. Transcription in stationary versus shaking slice cultures. Autoradiographs of filters hybridized with nascent-labeled nuclear RNA from mouse liver (A), shaking cultures of slices (B), slices cultured on a stationary platform (C), and isolated cultured hepatocytes (D) are shown. (B) One-half of the slice preparation from two livers
legend placed
was
cultured in basal medium
as
described in the
to
Fig.
on
stacks of sterilized Whatmann 3mm filter papers in four
2.
(C) The other half of the slice preparation
was
150-mm tissue culture dishes, with basal culture medium added until it
just reached the top piece of
incubators under 5%
CO2-95%
air.
paper;
dishes
were
cultured
in
A
1 5 Al Ac
2 6 RA,BT 3 9 p B
..
10
B Ft
2627
R 28S
*A
._
i
s
'e'-
C
_
S0
D
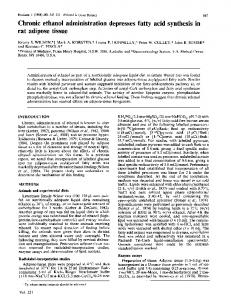
FIG. 4. Transcription in hepatocytes dispersed with EDTA versus collagenase. Autoradiographs are shown of filters hybridized with equal amounts of radiolabeled nuclear RNA isolated from mouse liver (A), from hepatocytes dispersed with EDTA alone followed by 2 h of culture (B) and 24 h of culture (C), and from hepatocytes dispersed by the conventional collagenase perfusion technique followed by 24 h of culture (D).
Dulbecco minimal essential medium plus insulin and hydrocortisone, with the cells plated on tissue culture plastic). Typically after 24 h of culture, specific gene transcription rates were compared in nuclei from the various cultures and in normal livers. Changes in culture conditions (see Materials and Methods) included alterations in the basal medium, the amount and type of serum and hormones added, cell density, exposure to oxygen, the addition of physiological and nonphysiological inducers and drugs, the inclusion of other cell types in the cultures, and the plating of cells on protein-coated dishes (biomatrix) (10). Culture times were varied from 1 to 10 days, and the response of fetal liver cells was measured. Culture conditions with different reported effects on cell replication were also examined (10). The experimental result was inevitably the same: dispersed cells cultured in monolayers or in suspension showed greatly decreased rates of liver-specific transcription (Fig. 2D, 3D, and 4D). Indeed, isolated cells exposed to any of the culture conditions described in Materials and Methods had similar transcription profiles for the panel of tissue-specific mRNAs. Preparation and culture of liver slices. If tissue-specific transcription in the liver depends somehow on normal tissue organization, then transcription might be maintained in vitro if tissue organization could be maintained in vitro. To that end, we explored the use of conventional tissue-slicing techniques (1, 30) as a way to prepare tissue for culture. Livers to be sliced were first perfused with tissue culture medium to wash out blood and to insure quick exposure of all of the cells in the tissue to the culture medium. With a Mcllwain tissue chopper, livers were then cut into columns 0.325 by 0.325 by 2 to 3 mm. The columns were therefore approximately 10 to 15 cells in diameter, or about half the size of the classic liver lobule (19). In most experiments the slices were placed in Erlenmeyer flasks that were flushed
2628
CLAYTON ET AL.
MOL. CELL. BIOL.
TABLE 3. Macromolecular synthesis in liver slice culturesa Protein
RNA Time (h)
2 26 50
cpm
mg
cpm/mg
1,452 1,713 1,030
1.8 1.6 1.7
807 1,070 635
mg
cpm/mg
%
100 113,300 2.0 133 63,800 1.4 79 68,220 1.9
56,650 45,570 35,900
100 80 63
%
cpm
a Mouse liver slices were divided into six equal samples for culturing. At the times indicated, medium in individual cultures was replaced for 30 min with medium containing 10 ,uCi of either [35Sjmethionine or [3H]uridine per ml as described previously (4). The slices were then washed and quick-frozen in phosphate-buffered saline. After thawing, they were dispersed in a polytron tissue homogenizer and assayed for incorporated label and protein content as described previously (4). In contrast to these slice cultures, monolayer cultures have been found to increase protein synthesis by six fold and RNA synthesis by threefold between 2 and 48 h in culture (4).
with 95% 02-5% CO2 and gently shaken. For comparison, monolayers were also cultured under 95%02Measurements of total macromolecular synthesis (Table 3) indicated that, unlike monolayer cultures (4), slice cultures maintain low total rates of RNA and protein synthesis which decline after 24 h. Furthermore, the slices gradually become fragmented in shaking cultures, so that after 24 h or so they may no longer maintain normal tissue structure or biochemical function and probably contain many dead or dying cells. Maintenance of liver-specific transcription in slices. Since slice cultures could be maintained for 24 h with moderately active total protein and RNA synthesis, we have been able to compare the transcription rate of liver-specific and common mRNA sequences in nuclei from fresh liver with those from cells maintained in slices or in monolayer cultures for equivalent times. Autoradiographs from two such experiments are shown in Fig. 2 and 3, and the quantitation of the autoradiographic signals is given in Tables 4 and 5. A major general point can be made from these two experiments (and from a number of similar experiments not shown): liverspecific RNA transcription was maintained at a much higher rate in liver slices than in monolayers cultured under the same conditions. The rate of liver-specific transcription in TABLE 4. Densitometric quantitation of transcription rate
analysis Probe
1 2 3 4
5 6 9 10 Al Ac bT CHO-B
Slice, culture
82 36 124 46 260 500 500 286 22 197 150 100
Relative densitya (%) Slice, no added Slice, no hormones serum
57 27 88 35 169 361 361 172 19 234 151 100
68 28 100 41 200 408 430 271 23 158 148 100
Monolayer Molae
3 1 1 12 27 87 27 4
0.2 187 150 100
a Data from Fig. 2 were analyzed by densitometric scanning, along with data from a parallel experiment in which a sample of the same slice preparation was cultured in basal culture medium lacking serum. Signal for pBR322 on each filter was subtracted, and the different hybridization inputs were normalized by using the CHO-B signal as an internal standard (see Materials and Methods). Data for each transcription unit in the various cultures are presented in the table as percentages of the signal measured in fresh mouse liver (100%) for that transcription unit.
nuclei from slices usually averaged from 20 to 50% of that in liver nuclei for most genes and was approximately 5- to 20-fold higher than that in dispersed cells cultured in monolayers. In contast, transcription of common mRNA sequences (actin, oa- and ,B-tubulin, CHO-B) was similar in slices, dispersed cultures, and fresh liver. Although most liver-specific genes responded in a similar qualitative fashion to the different culture conditions, quantitative variations in response among the different genes and in different experiments were observed. For example, transcription of RNAs complementary to plivS-5, -6, and -9 actually appeared to increase in cultured liver slices compared with fresh liver in the first experiment (Fig. 2, Table 4). This effect was not observed in the second experiment (Fig. 3, Table 5). Apparent quantitative variations from experiment to experiment undoubtedly resulted in part from variations in the transcriptional profiles of the different fresh mouse livers used as controls in each experiment. Other variations may have arisen from subtle differences in the preparation and handling of the slices themselves. For example, slices cultured on a stationary platform (Fig. 3C) transcribed liver-specific genes at about twice the rate of slices suspended in shaking cultures (Fig. 3B, Table 5). We also found that genes with the highest transcription rates in the normal liver (albumin, plivS-1, -2, and -3) appeared to decline the most in transcription in the monolayer cultures: typically, by 20- to perhaps more than 100-fold. Genes in this group were also more likely to show some decrease in transcription in cultured slices. The transcriptional signals for other liver-specific mRNA sequences (detected by plivS-4, -5, -9, and -10) typically declined by factors of 3 to 10 in monolayer cultures. The quantitative significance of the low residual signals measured in monolayer cultures is unclear, because although they are usually greater than the background hybridization to plasmid vector DNA alone, their statistical reliability is low. Also, without exploration of their source, for example, by hybridization of nascent RNA to a series of segments across a gene to demonstrate equimolar hybridization in each segment, it remains conceivable that the low signals are due to some type of cross-hybridization (39). The only liver-specific RNA whose rate of synthesis was usually maintained at a normal or high rate in both slices and dispersed cultured cells is that complementary to plivS-6 (whose sequence is very similar to that of a rat transferrin cDNA; Citron, Grayson, Inouye, and Darnell, unpublished TABLE 5. Densitometric quantitation of data in Fig. 3 Relative densitya (%) Probe
1 2 3 4 5 6 9 Al Ac aT tR
28S
Shaking 7 8 30 60 41 27 23 13
28 106 33 112
Stationary
Monolayer
20 18
1 3 4 23 24 45 8 2 46 112 64 119
45
63 95 65 42 25 53 135 24 48
a Values for each transcription unit in the cultured tissue and cells are expressed as percentages of the signal measured in fresh sliced liver (100%).
2629 TISSUE ORGANIZATION AND LIVER-SPECIFIC TRANSCRIPTION TABLE 7. Transcription in reengaged liver slice cultures compared with fresh sliced liver, normal slice cultures, and results). A high level of transferrin mRNA transcription monolayer cultures compared with other tissue-specific mRNAs has also been seen in cultured rat hepatoma cells (5). Relative densitya (%)
VOL. 5, 1985
A final observation concerning the data in Fig. 2 and Table 4 is that alterations in the culture medium had minimal effect on tissue-specific transcription in slices. Omission of supplemental insulin and hydrocortisone from the culture medium (Fig. 2C, Table 4) resulted in only a slight decrease in liver-specific transcription. Omission of serum from the medium resulted in a 50% decrease in total RNA synthesis, but had little or no effect on the relative pattern of tissuespecific transcription (Table 4). Is lost function in monolayers due to cell damage? One possible explanation for loss of liver-specific transcriptional function in collagenase-dispersed cells is that the cells have been damaged somehow by the various proteolytic activities in the enzyme preparation. Therefore, a method for hepatocyte isolation was sought that did not employ proteolytic enzymes. Rat hepatocytes can be released from their normal tissue contacts by perfusion of the liver with EDTA (3). Similarly, we found that perfusion of mouse livers for 1 h with 2 to 10 mM EDTA in HEPES-buffered Hanks salts, followed by gentle teasing of the liver, resulted in the release of single cells (30 to 50% viable) from a large acellular mass, presumably the undigested reticular network and capsule. Viable cells were centrifuged through a Percoll cushion, and the cells (>95% viable) were plated and cultured as usual. Two hours after isolation, the nuclei of these cells were still active in transcription of most liver-specific genes (Fig. 4B), just as were cells isolated with collagenase (4). Just as with collagenase-dispersed cells, RNA complementary to plivS-1 (major urinary protein) was greatly decreased in EDTA-dispersed cells already after 2 h, and the transcription of actin was stimulated. After 24 h in culture on plastic culture dishes, the EDTA-dispersed cells (Fig. 4C) showed the same specific transcriptional decline as cells isolated with collagenase (Fig. 4D), suggesting that the action of collagenase was not the direct cause of the decline of tissue-specific transcription. Can tissue structure be reconstituted? If disaggregated liver cells could reform a tissue structure in which tissue-specific transcription was now active, an experimental approach to discovering the cell or tissue components required for maximum tissue-specific transcription would be available. Although dispersed liver cells will form aggregates in suspension culture (17, 29), we have not found such aggregates to be stable or viable over the 24-h period required to observe
TABLE 6. Cell release
assay
of reengagementa
Perfusate and treatment
No. of cells released
HEH for 60 min and tease DMEM for 60 min and tease HEH for 60 min and slice HEH for 60 min, followed by BCM for 50 min and slice
100 2 80 20
X
106
%
Viable
34 0 24