Liaosha Song*, Tom Paronish, Vikas Agrawal, Brittany Hupp, Shikha ..... Sageman, B. B., A. E. Murphy, J. P. Werne, C. A. Ver Straeten, D. J. Hollander, and T. W. ...
URTeC: 2667397
Depositional Environment and Impact on Pore Structure and Gas Storage Potential of Middle Devonian Organic Rich Shale, Northeastern West Virginia, Appalachian Basin Liaosha Song*, Tom Paronish, Vikas Agrawal, Brittany Hupp, Shikha Sharma, Timothy Carr; Department of Geology and Geography, West Virginia University, Morgantown, WV, USA Copyright 2017, Unconventional Resources Technology Conference (URTeC) DOI 10.15530/urtec-2017-2667397 This paper was prepared for presentation at the Unconventional Resources Technology Conference held in Austin, Texas, USA, 24-26 July 2017. The URTeC Technical Program Committee accepted this presentation on the basis of information contained in an abstract submitted by the author(s). The contents of this paper have not been reviewed by URTeC and URTeC does not warrant the accuracy, reliability, or timeliness of any information herein. All information is the responsibility of, and, is subject to corrections by the author(s). Any person or entity that relies on any information obtained from this paper does so at their own risk. The information herein does not necessarily reflect any position of URTeC. Any reproduction, distribution, or storage of any part of this paper without the written consent of URTeC is prohibited.
Abstract Characterizing the pore structure of a shale-gas reservoir is significant for calculating the original gas in place and fluid-flow characteristics. To better understand the impact of organic matter accumulation, redox condition, and depositional environment on pore structure and storage capacity, integrated geological and petrophysical characterization of the Devonian organic-rich shale was conducted. Core samples from a newly drilled science well from the Marcellus Shale Energy and Environment Laboratory (MSEEL) project and other wells in the Appalachian basin were selected to undertake this research. X-ray fluorescence (XRF), X-ray diffraction (XRD), and pyrolysis were performed to understand variations in composition, mineralogy and total organic carbon (TOC). Samples were examined from an interval including the overlying Tully Limestone, organic-lean Mahantango Shale, organic-rich Marcellus Shale and top of the underlying Onondaga Limestone. We introduce the application of subcritical N2 adsorption to measure pore volume, pore-size distribution, and poresurface area, which are critical properties in characterization of the nano-scale pore regime of mudstone reservoirs. Results of the test are used to build models of the mudstone pore systems. With variations of TOC and mineralogy, changes in the characteristics of pore structure are observed. Middle Devonian shales have complex, heterogeneous pore size distributions as identified by subcritical N2 adsorption. XRD results suggest a high content of clay minerals (mainly illite) through both Mahantango and Marcellus shales. Hysteresis of N2 adsorption isotherm indicates slitshape pores between 2nm and 50nm, possibly formed by clay particles. Organic matter shows strong influence on pore volume and pore surface area (BET specific surface area), which strongly influences storage mechanisms of shale-gas reservoirs. Carbonate-rich intervals show very low pore volume especially micropore (pore width smaller than 2nm) volume, and surface area. The results of N2 adsorption are compared with NMR log to upgrade the evaluation. Introduction Micro- to mesoporous structures of unconventional reservoirs are challenging to characterize because of the extremely small pore sizes. Investigation of the micro- or mesoporous structures and their impact on flow properties requires experimental approaches, and sample preparation that will not affect the physical structure of samples while removing water, hydrocarbon, and other contaminants. To study shale pores more accurately, techniques such as gas adsorption and nuclear magnetic resonance (NMR), have been applied. The low-temperature nitrogen N2 adsorption method can offer micro-pore volume, meso-pore size distribution, and pore surface area. Understanding the limitations of the analyses is also important, since at the scale of micro- to meso-pores, the measurement techniques influence the result. In this paper, we review some of the sample preparation procedures to find an appropriate and repeatable measurement. The NMR T2 spectra of core samples can be used to calculate porosity and permeability,
URTeC 2667397
2
and characterize pore-throat structures of rock. Significant variations in pore structures can be expected within a formation due to lithologic variations resulting from depositional environment, sediment influx, and preservation.
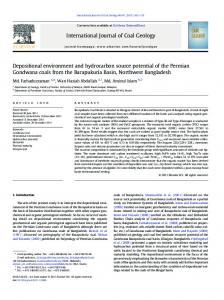
Figure 1: The Map shows the location of wells in West Virginia and Pennsylvania used in this paper, and the thermal maturity trend of the Marcellus Shale (modified after East et al., 2012).
In this research, shale samples were obtained from four wells penetrating Mahantango and Marcellus shale formations in West Virginia and Pennsylvania, covering a wide spectrum of thermal maturity (Figure 1). Total organic carbon content and mineralogy also vary significantly. Core samples from Marcellus Shale Energy and Environment Laboratory (MSEEL) project (MIP-3H well) were selected to run XRD, XRF, TOC and BET analyses and to compare to other wells. These techniques were used to characterize the pore-system characteristics of the Middle Devonian organic-rich shale in Appalachian basin, including the pore type, pore size, surface area, and pore volume. This research will help improves our understanding of the characteristics of the Marcellus and other organic-rich shale reservoirs and could further benefit evaluation of the storage capacity of shale-reservoirs. Method Source Rock Analysis (SRA) Approximately 60 - 100 mg of pulverized rock was accurately weighed into an SRA crucible and placed in the SRAAgilent autosampler, and held isothermally at 300°C for 3 minutes. During this isothermal heating, the free hydrocarbons are volatilized and detected by the FID detector where they are quantitatively detected and reported as milligrams (mg) of S1 per gram of rock. The free CO2 is simultaneously liberated and detected by the IR cell and reported as milligrams (mg) of S3 per gram of rock up to 400°C. After the isothermal period, the temperature is ramped at 25°C/minute to 600°C. Between 300°C and 600°C organic hydrocarbons are generated from the pyrolytic degradation of the kerogen in the rock. The hydrocarbons are detected by the FID, labeled as S2, and reported as milligrams (mg) of S2 per gram of rock. Residual carbon is also measured and is recorded as S4 peak. TOC is calculated by using the equation: %TOC =0.1× [0.082× (S1 + S2) + S4] (Espitalie et al., 1985). WFT Source Rock
URTeC 2667397
3
Standard 533 (P/N 810-141) was run after every five samples. The standard deviation of the analysis was 0.07%. SRA analysis was performed at the National Energy Technology Laboratory in Morgantown. X-ray Diffraction Geochemical Analysis Sixty-two samples collected as side-wall plugs from the MSEEL project were analyzed for x-ray diffraction (XRD) geochemical analysis to determine bulk mineralogy. These samples were ground in a steel grinding container for 510 minutes until powdered. Powder samples were pressed into chemplex pellets for loading of samples into the diffractometer. XRD analysis was performed using the PANalytical X’Pert Pro X-ray Diffractometer at West Virginia University Shared Research Facilities. Samples for this project were analyzed at 2θ angles between 5° and 75°, with a step time of ~75 seconds, leading to each sample being ran for approximately 13.5 minutes. X-rays were concentrated through a 20mm brass opening. The raw spectra were interpreted using the X’pert HighScore Plus Program to establish percentage of various mineral phases present. Bulk mineralogical interpretations were semiquantitatively determined using reference intensity ratios (RIR). Portable X-ray Fluorescence Geochemical Analysis X-ray fluorescence (XRF) was performed on the same 62 samples that were prepared for x-ray diffraction analysis. The chemplex pellets were analyzed using a Bruker portable x-ray fluorescence spectrometer Tracer III-SD provided by the Division of Plant and Soil Sciences at West Virginia University. Each sample was analyzed for 120 seconds. Runs were completed to acquire major and trace elemental concentrations reported as weight percent. All runs were calibrated using the Bruker Mudrock calibration. Low-pressure N2 adsorption (BET test) Low-pressure N2 adsorption were conducted on a Micromeritics ASAP-2020 instrument at -196⁰C (77K). About 1 gram of shale sample was crushed with mortar and pestle until the whole mass passes through a 60-mesh sieve to prevent potential sample biasing due to sieving. One sample from well CS1 is chosen to run the temperature test. About 5 gram of core sample was crushed and separated to 5 portions. Then samples were outgassed under highvacuum apparatus at 120⁰C for 24 hours to remove adsorbed water and volatile matter before analyses with N2. The relative pressure (P/P0) ranged from 0.009 to 0.990. Both adsorption and desorption data points were acquired. Adsorption branch of the isotherms were used to obtain information about micropores (12
20~40
3
Antrim Shale from WV and KY North America coal and shale Lower Cretaceous NE British columbia Jurassic, D-M, North British Columbia
BET SSA (m2/g)
0.01~7.9 N2: 2.5~19.5; CO2: 16.1~62.9
3.4~44.5 0.06~11.16
over night
Barnett New Albany Shale (D-M) New Albany Shale (D-M) Green River, Barnett Triassic Montney, Western Canada
> 4 days
North America
2.3~17.1
Haynesville
22.85~23.11
Eagle Ford, Barnett, Marcellus, Montney Mississippian Barnett Shale
14~39
60 14
24
100~270 6
4~20 N2: 0.2~2.4; CO2: 10.9~12.8
0.62~3.05
Another import factor for degassing is the temperature. Olson, 2012 summarized degassing temperature for 6 categories of materials (Table 2). Unfortunately, there isn’t a category for mudrock. While it still shed some light on the selection of temperature. Amorphous oxides (e.g. silica, alumina) are similar to numerous minerals in mudrock, and a temperature from 100°C to 200°C did not change the pore structure (Olson, 2012). To find the best temperature for this research, one sample was split into 5 portions and degassed under 5 different temperatures. Figure 2 shows the pore size distributions of this sample at these temperatures. The overall trends are the same over all the five tests. However, as temperature increases, we noticed an increase in pore volume. Samples degassing under 80⁰C and 120⁰C show almost the same pore size distribution (PSD), which agrees with another research on Barnett Shale (Adesida et al., 2011) and other research studies (Table 1). In the rest of this study, 120⁰C is used as the degas temperature. 2. Pore size distributions Isotherms are the direct result from low pressure N2 adsorption tests. Figure 3 shows the isotherms of the six samples from MIP-3H, all of which are type IV isotherm with H3 or H4 hysteresis loop. This shape of isotherm indicates that the shale samples are micro- to meso-porous materials, and this type of hysteresis loop often is observed with aggregates of plate-like particles forming slit-shaped pores. At high P/P0 section (P/P0 > 0.9), the
URTeC 2667397
5
isotherm shows a steep increase and no limit when P/P0 close to 1. This is attribute to the sample also has macro pores, and the steep increase is representative of macro pore filling (Sing et al., 1982). Table 2 Summary of outgassing conditions by material type (Olson, 2012)
Material Type Active pharmaceutical ingredients Activated carbon, zeolites, catalysts Magnesium Stearate Excipients, e.g. starches, celluloses, sugars, polymers Amorphous oxides, e.g. silica, alumina Metal oxide, e.g. titanium dioxide, zinc oxide, iron oxide, nickel oxide Ionic salts & crystalline nonmetals
Flow or Vacuum Either
Temp. (°C) 40 or ½ melting point
Duration (hr) ≥2
Vacuum
90 then 300
1 then ≥ 3
Vacuum Either
40 20o < Tg or ½ melting point
2 ≥2
Either
100 to 200
≥½
Flow
300
≥2
Either
300 or ½ melting point
≥2
The pore size distribution of the six samples from MIP-3H are calculated with BJH model (Figure 4). The variation in pore structure are mainly controlled by TOC and mineralogy (Figure 7). Tully Limestone and Onondaga Limestone show significantly less pores compared with the Marcellus Shale within the meso-pore zone (2~50nm), and very few pores below 20 nm. In the Marcellus Shale, the pore structure also varies. The Marcellus top sample has a spike at 7 nm and a bigger pore volume than upper Marcellus sample. The Marcellus top sample also has the highest clay content (Figure 7). Upper and middle Marcellus samples have similar PSD in 20nm to 50nm interval. The lower Marcellus sample, which has the highest TOC content, has the highest pore volume. 3. TOC, pore surface area, and pore volume The specific surface area (SSA) of the six samples ranges from 1.09 m2/g to 52.9 m2/g (Table 3). The BJH pore volume of samples range from 0.003052 cm3/g to 0.051914 cm3/g (Table 3). The micro pore volume and surface area are calculated by T-plot. The BET specific surface area and BJH pore volume indicate an overall positive correlation with TOC (Figure 5, 6). MIP-3H, G55 and A1 (listed as 1.36