Abstnzct-h most electronic instruments, the magnetic inter- ference generated by the power supply transformer induces noise in the measuring circuitry.
854
IEEE TRANSACTIONS ON INSTRUMENTATION AND MEASUREMENT, VOL. 42, NO. 4, AUGUST 1993
Design of Low-Leakage Power Supply Transformers for High-Precision Electronic Instruments S. Mehdi Miri, Member, IEEE, Feng Lu, and Bruce E. Randall, Member, IEEE,
Abstnzct-h most electronic instruments, the magnetic interference generated by the power supply transformer induces noise in the measuring circuitry. The existenceof this noise limits the overall precision of the instrument and significantly reduces its accuracy at low-level measurements. A very effective method for reducing the intensity of the noise signal is presented. The effectiveness of the proposed method, which is based on a low-leakage design of the power supply transformer, is demonstrated through testing of a prototype designed and built according to the design procedure given in this paper. Finite-element analysis is used to predict the magnetostatic performance of the transformer design prior to building a prototype. It is demonstrated that the hite-element analysis is an effective tool for saving time and resources in developing transformer prototypes.
I. INTRODUCTION
B
and bobbins available and costs no more than comparable power supply transformers commercially available. This paper describes the low-leakage design procedure used to design a power supply transformer for a multifunction high-precision electronic meter, and the finiteelement analysis of the design that was camed out to verify that the transformer design met the design specifications before building a prototype. A prototype was built, installed, and tested in the laboratory. The test results are discussed. A. Low-Leakage Design Considerations The objective of a low-leakage design is to maximize the percentage of the magnetic flux confined to the core. This objective can be achieved through maximization of
ECAUSE of size limitations, the power supply board in most electronic instruments is located in the proximity of very sensitive measuring circuitry. The magnetic 1) the effective permeability of the core, interference (MI) generated by the power supply trans2) the coupling between the primary and the secondary former induces noise in these circuits according to the windings, and Faraday’s law of induction. The strength of the noise sig3) the coupling between the windings and the core. nal depends on the design of the power supply transProper selection of the core material and the peak of former, it orientation, and its proximity to the measuring board. In high-precision instruments, the intensity of the the operating flux density allowed are crucial in achieving MI signal must be kept at very low levels. In our instru- objectives (a) and (c) above. Maximizing the bobbin T height, and thus the core window height, and minimizing ments, a leakage flux density of less than 0.3 x is required at the measuring board. A conventional trans- the interwinding and winding-core insulations are crucial former produces a leakage flux density in the range of 1.2 in achieving objectives (b) and (c). The use of a concenX 10-4-2 X T depending on the loading condition. tric design is necessary for achieving objective (b). An expensive way of attenuating the leakage flux densities has been to shield all sensitive circuits using sheets of a high-permeability material such as mumetal. B. The Low-Leakage Design Procedure We have established that the MI signals can be attenThe following iterative design procedure was used to uated very effectively by means of a low-leakage design produce a power supply transformer design which meets for the power supply transformer, without using heavy, the required specifications and generates very little magexpensive shielding material. A low-leakage design is po- netic interference. Since attention to details is key to the tentially more effective than shielding in weakening the success of the proposed design procedure, and since such MI signal because the 60 Hz magnetic field lines cannot a procedure has not been published before, the design be repelled by shielding. Shielding can only divert a por- procedure is discussed in some detail. tion of the field lines away from sensitive areas. The proI) Design Specijcations: In electronic instruments, it posed low-leakage design uses the standard laminations is often required to have two or more isolated power sources. This requires the power supply transformer to Manuscript received February 10, 1992; revised January 12, 1993. This have two or more secondary windings. The design prowork was supported in part by Process Systems, Inc. S. M. Miri and F. Lu are with the Department of Electrical Engineering, cedure given here assumes the requirement of one primary University of North Carolina at Charlotte, Charlotte, NC 28223. winding at V Iand two secondary windings each at V2volts B. E. Randall is with the Engineering Development Group, Process Syswhile delivering Z2 amperes at 60 Hz. The given procetems, Inc., Charlotte, NC 28224. dure can be easily modified to design for more than two IEEE Log Number 9209536. 0018-9456/93$03.00 0 1993 IEEE
855
MIRI et al.: DESIGN OF LOW-LEAKAGE POWER SUPPLY TRANSFORMERS
secondary windings. For simplicity -in discussing the design steps, we assume V , = 120 V, V, = 10 V and Z, = 0.5 A. 2) Selection of the Core Type: For a given design, the location and orientation of the power supply transformer determine the strength of the MI signal detected at the measuring circuitry. The location of the transformer is often dictated by other instrument design considerations. The optimum orientation is the one which minimizes the linkage of the transformer leakage fluxes with the sensitive measuring circuits. A shell-type core can be oriented to provide “free” shielding in two directions, positive and negative x directions in Fig. 1, along which the measuring circuits will be least affected by the transformer leakage fluxes. Therefore, a shell-type core is the most suitable choice for a low-leakage design which is to cost no more than the commercially available power supply transformers. 3) Core Material Selection: The core material used is an important design consideration influencing the core effective permeability (p), weight, efficiency, and cost. Figure 2 shows the B-H loops for typical core materials used in transformed design [l].To meet our design objectives, we should select a material having high p , high saturated flux density, B,, (to reduce size which is limited by the available space on the power supply board), and low cost. The transformer size limitation requires the use of a material with large B,, such as the material whose B-H loop is shown in Fig. 2 curve A, Fig. 2 curve B (M-6: grain-oriented silicon steel), or in Fig. 2 curve C. If the size limitation allows, a high-p material (Fig. 2 curve C) should be selected for a low-leakage design. However, if minimizing the cost is a major requirement, M-6 should be selected. Materials such as the ones characterized by curves A and C in Fig. 2 are about 60-75% and 20-25% more expensive that the M-6, respectively. In addition to being least expensive, M-6 is also the lightest among these three materials. It has a large B,,, and a high p. In our design, we selected M-6 for the core material mainly to reduce cost. Having selected the core material, we can use the peak of the operating flux density waveform to determine the effective p of the core from the p curves provided by the manufacturer. 4) Selection of the Lamination Type and Size: To select the lamination type and size in constructing a shelltype core, we 1) must determine the best orientation of the core and consider the space available on the power supply board, 2) should try to maximize the window height L (see Fig. l), and 3) must make sure standard bobbin sizes can be used. Most U.S.Manufacturers do not use the units of international system (SI). For practical reasons we will use the same units as those used by the manufacturers in out discussions. The following conversion factors are given here for the convenience of the readers who are more familiar with the SI Units: 1 in = 2.54 cm, 1 G = T, and 1 oersted = 79.577 A/m.
I
1
I
Fig. 1 . A shell-type transformer core.
resla
(49% Fe, 49% Co. 2% v)
2.2f
f 1
Si NI)
Fig. 2. Typical B-H loops for magnetic materials used for transformer cores.
The space available for the transformer on the power supply board in our case is, in inches, about 2 X 1.5 X 1. Among the standard lamination types and sizes available, the EE lamination made using two E laminations taken from 375-E1laminations is the most suitable choice for our design. This choice maximizes the window height within the available space. The resulting EE lamination (Fig. 3) has an overall dimension, in inches, of 1.875 X 1.375 with a height of L = 1.5. To reduce eddy-cumnt losses without significantly reducing the stacking factor, a lamination thickness of 0.014was chosen. 5) Selection of the Core Peak Flux Density: The maximum core flux density to be allowed is determined from the ac saturation and p curves provided by the manufacturers, and from finite-element analysis. Figure 4 shows the effective permeability curves as functions of the peak flux density, B,,, for samples of M-6. These curves are not to be taken as exact characterizations of the selected laminations; they are to be taken as only approximations. Our finite-element analysis has shown Bmaxto be a key parameter in influencing the leakage flux densities. A value of Bma, = 12 OOO G was selected based on the results obtained from finite-element analysis which is discussed later. From Fig. 4, we note that a value of 12 OOO G should result in high core permeabilities in both parallel and normal to the grain directions.
856
IEEE TRANSACTIONS ON INSTRUMENTATION AND MEASUREMENT. VOL. 42, NO. 4, AUGUST 1993
CORE:
D4.w Mamial: M6 Gauge 29
I 1 I I I
Fig. 3. The selected laminations.
I I
P
C~
fY
&=3/16" b1.5" P=3/16" Ha5/16" C=3K
parallel to rolling direction I I I
O@ perpendicular to rolling direction
lxld[ 1x10'
I
I
lxld 1x10⁵ Flux Density-Gauss
I I I I I
I
lxl$
t
08
I
I I I
Fig. 4. 60-Hz impedance permeability curves for M-6.
6) The Wire Size for the Secondary Windings: The design specifications require two isolated secondary windFig. 5. Solution domain for the FE analysis. ings each providing a maximum of 0.5 amperes at 10 V. The smallest wire size which can be safely used for the secondary windings is AWG-28. 7) Secondary Number of Turns: Using Faraday's law resistance is increased by a factor of 1.09 (read from a of induction given by (1) and the design specifications, resistance-temperaturechart [ 11). An estimate of R2 in (2) the secondary number of turns can be estimated is given by
E = 4.44jlvA,Bm. In (l), E is the winding's induced voltage in rms, f is the power frequency, N is the number of turns, A, is the core cross-sectionalarea, and B,, is the peak of the sinusoidal flux density in the core. To begin the iterative design process, we select two 375-E1 X 3/8 bobbins having the dimensions, in inches, of 0.39 x 0.39 x 0.735, one for each secondary winding. Further, to fill the bobbins with laminations, we design for a square core cross-sectional area. For the selected laminations, the manufacturer gives a stacking factor of 0.95, resulting in A, = 0.1336 in2. To calculate N2using (l), we first need to determine the secondary no load voltage &,
E2
V2
+ R2Z2
where V2 is the secondary rms voltage at the load current Z2, R2 is the secondary winding resistance, and the secondary winding leakage inductance has been neglected. The resistance per inch of AWG-28 at 20°C is 5.4425 in a. Assuming an operating temperature of 40°C, this
R2
=
1.09
X
5.4425
X
X
MLT
X
N2
(3)
where MLT is the mean length turn for the secondary winding. For the given bobbin and assuming the secondary winding will be wound over the primary occupying half of the total winding area available, the secondary MLTcan be estimated to be 3.2 in. Equation (3) now gives R2 = 0.019N2 0 , and (1) and (2) give N2 = 554 turns per secondary. We must now determine if there is enough window area available for the number of secondary turns calculated. For each winding, the available window area can be shown to be A,,, = 0.0695 in2. Using an empirical formula, the maximum number of AWG-28 turns which would fit in the area A,,, can be shown to be N,,, = 380. Therefore, the design value of N2 = 554 will not fit in the available winding area. To reduce the design value of N2,while maintaining BmaX at 12 OOO G, we will allow a larger core cross sectional area. We choose our next standard bobbin size to be the 375-E1 x 1/2 having the dimensions 0.39 x 0.515 X 0.735. Applying the design procedure again, we get N2 = 374 turns which is less than N,,,.
I
,
MIRI er al.: DESIGN OF LOW-LEAKAGE POWER SUPPLY TRANSFORMERS
857
t ~
12 k 8 9
E0
E0
6 6
3
4
t 5' 00
0
2
4
L
-
L
-
J
1
6
-
I
0
2
I
3
I
4
I
I
I
5
I
6
I
7
cm (3)
v, 20000
v)
3
cd
c3
15000
10000
5000
1
0 3
(C)
Fig. 6. (a) Core flux lines for the loaded case. (b) Leakage flux lines for the loaded case. (c) Core flux density for the loaded case.
8) Primary Number of Turns: On the primary side, we can have one winding per bobbin connected either in series or in parallel. To use large wire sizes and thus to reduce manufacturing costs, we choose the series arrangement. To determine the primary number of turns, NI,we first need to estimate the primary induced voltage E l . Assuming a primary winding voltage drop equal to that of the secondary and applying (l), we get N , = 1,569 turns
per bobbin. Applying an empirical formula, we determine the largest wire size filling the available area to be AWG-34. To determine if AWG-34 is a safe choice, we need to estimate the primary rated current N2
I1,latCd
=I , , +,2 - 12,1ated. Nl
(4)
, , , can be calculated using AmThe exciting current, I
IEEE TRANSACTIONS ON INSTRUMENTATION AND MEASUREMENT, VOL. 42, NO. 4, AUGUST 1993
858
pere’s law , NlZexc
= -
lP
3
(5)
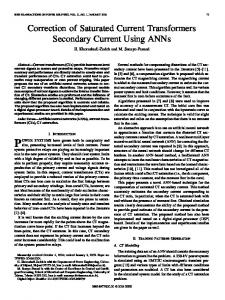
where pp and pp are the core permeabilities, and lp and 1, are the core mean lengths along the grain and normal to ~ B,,,. = the grain directions, respectively. F~~~ ~ i 4 at ~,-J-J-J and pn 4,000. F~~~ ~ i 3, ~lp 12 OCK) G, pp = 1.689 and 1, = 0.5. The exciting current can now be calculated from ( 5 ) and substituted in (4) to solve for the primary rated current. This gives Zexc = 5.2 mA and = 0.124 A. Thus AWG-34 can be used for the primary. This completes the design. 11. FINITE-ELEMENT ANALYSIS To obtain a measure of the leakage flux density at the measuring board prior to building a prototype, the finiteelement (FE) technique is used to analyze the transformer’s magnetostatic operation for maximum flux conditions. Because of the existing symmetry, only half of the solution domain, as shown in Fig. 5 , is considered in the analysis. Two cases are studied: 1) the loaded case, where one secondary is loaded to 0.5 A while the other is loaded to 0.1 A, and 2) the no-load case, where the primary is energized at 120 V and both secondaries are left open. The first case stimulates the field operating conditions, while the second case is the worst case for leakages. I) The Loaded Case: FE analysis requires the prior knowledge of the current densities in all windings. These current densities are estimated by
(6) where Jk is the current density, Nk is the number of turns, is the peak current, and Awk is the window area for winding k . In our case, Z2 = 0.5 &A, Z3 = 0.1 &A, and ZIis calculated from (4) and (5) to be 0.0767 & A . Figures 6(a)-(c) show the core flux lines, leakage flux lines, and the core flux density. The average leakage flux density in the shaded area of Fig. 5 , at the center of which the measuring board is located in the y-z plane, is calculated to be 0.492 G. This flux density has x and y components, but only the x component can induce a voltage in the measuring board circuitry. The average of the x component of the’flux density in the shaded region of Fig. 5 is calculated to be 0.103 G. This component of the leakage flux density can induce a voltage of 0.0018 mV in a loop area of one square inch on the measuring board. The core average flux density is calculated to be 10 080 gauss. The effect, on leakages, of having the primary wound over the secondary windings was also studied in this case. For the same operating conditions, the average leakage flux density in the same area was found to be about five times higher than before. Zk
2) The No-Load Case: The no-load primary current density was calculated from (5) and (6) and used in the FE program. The contour plots of the core and leakage flux lines and the surface plot of the core flux density are similar to those shown in Fig. 6 and, therefore, are not shown. The average Of the Of the flux density in the shaded area of Fig. 5 is calculated to 0.148 G. .This flux density can induce a voltage of 0.0025 mV in a loop area of one square inch on the measuring board. The core average flux density is calculated to be 12 168 gauss. 111. TESTING THE DESIGN PROTOTYPE
The desired improvement in the accuracy of our instrument required that the maximum leakage flux density at the measuring board, 1.2 in away from the transformer, along the direction normal to the board be less than 0.3 G. Thus, the leakage flux densities calculated above were acceptable, and it was decided that a prototype be built according to the design. A prototype was built and tested. An ac magnetic probe (a “search coil”) having a 1.25-in diameter head was used to measure the leakage flux densities around the transformer. The output of the probe was connected to an oscilloscope. The peak of the observed voltage waveform was used to calculate the maximum leakage flux density at a given location. The maximum leakage flux densities measured at the location of the measuring board are higher than the predicted values. However, these densities are well below the 0.3 G limit and are, on the average, about one-tenth of those generated by a conventional transformer. Most of the leakage was detected around the areas where the E laminations were butted together to form EE laminations. This, and the higher densities measured, are attributed partly to the resulting air gaps at these areas. Because the leakage flux density levels were acceptable, no attempt was made to minimize these air gaps. When shielding was used in conjunction with a conventional transformer, the leakage flux densities detected were comparable with those generated by the new design without shielding. This is only because of the air gaps in the new design. If the EE laminations of the new design were of different lengths, they could have been interleaved to reduce the air gaps at no extra cost. This, no doubt, would have made the low-leakage design magnetically superior to shielding.
A. Actual Measurements and FE Analysis Predictions To compare the predictions of the FE analysis program with the actual measurements, we need to estimate the effective length of the air gap and include it in the FE model of the transformer. This can be done using the measurement of the exciting current and the ampere’s law. For our prototype, the effective length of the air gap was estimated to be about 0.013 mm. This air gap was included in the FE model, and the two previous cases (loaded and no load) were analyzed again.
859
MIRI et al.: DESIGN OF LOW-LEAKAGE POWER SUPPLY TRANSFORMERS
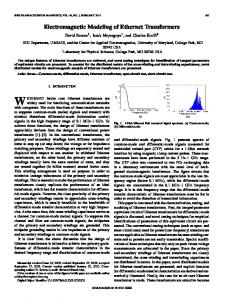
TABLE I FLUXDENSITY MEASUREMENTS AND FE ANALYSIS PREDICTIONS Loaded Case
FE Prediction (Gauss) Measured Value (Gauss)
No-Load Case
Leakage
Core
Leakage
Core
0.186 0.120
9,915 8,895
0.333 0.190
11,961 10,430
With the 2-D FE analysis used, it is not possible to closely correspond a calculated leakage flux density to a measured one. The FE program can only calculate the average flux density in the x-y plane shown in Fig. 5 ; this flux density has no component in the z direction. On the other hand, if the probe head is placed in the x-y plane, it would measure only the z component of the flux density, and no direct comparison could be made. We placed the probe head in the y-z plane, the plane in which the measuring board lies. In this case, the flux density measured is only that along the x direction in the y-z plane. To achieve the closest correspondence possible with a 2-D analysis, the FE program was used to calculate and average the x component of the flux density in the shaded region of Fig. 5 . The results of this comparison are given in Table I. A 3-D FE analysis would have provided for a more direct comparison. Assuming the core flux density to be constant along the z direction in Fig. 5 , the prediction of the 2-D FE analysis can be directly compared with the measured flux density in the core. To measure the core flux density, a few turns of wire were wound around one of the outer legs of the transformer core. The induced sinusoidal voltage was measured by a sensitive voltmeter. The FE program was used to calculate and average the core flux density. These results are also given in Table I. From Table I, we note that the FE analysis predictions for the core flux density are more accurate than those for the leakage flux density. A 3-D FE analysis would have been more accurate in predicting leakage flux densities. In general, one should expect FE analysis prediction errors to result from 1) error in estimating the current densities, 2) transformer modeling errors, 3) numerical errors, 4) comparing flux densities which do not accurately correspond, and 5 instrumentation errors. However, the FE analysis of the transformer magnetostatic operation is an effective tool for identifying important design param-
eters and eliminating designs which would not meet specifications. Some of our earlier designs, in which we allowed higher operating flux densities, were rejected by the FE analysis program for generating clearly unacceptable leakages. For instance, a B,,, of 15 OOO gauss resulted in a leakage flux density prediction of 0.741 gauss for the loaded case. The use of FE analysis saved us time and resources which would have been spent on developing nonworking prototypes. IV. CONCLUSIONS A procedure for designing low-leakage power supply transformers was discussed and applied to design a power supply transformer for a high-precision electronic instrument. A prototype was built and tested in the laboratory. The laboratory tests verified that the new transformer achieves its design objectives. The leakage flux densities for the low-leakage transformer, shown in Table I, are about one-tenth of those for a conventional transformer. As a result of using the low-leakage transformer, the overall precision of the instrument was enhanced, and its accuracy at low-level measurements was improved by about one order of magnitude. Because, with this design, there is no need to shield the sensitive circuitry with heavy, expensive shielding material, the overall weight and cost of the instrument are reduced. Finite-element analysis was used to predict the magnetostatic performance of the transformer designs. This proved to be an effective tool for identifying the important design parameters and eliminating bad designs. As a result, minimum time and resources were spent on developing a working prototype. ACKNOWLEDGMENTS We wish to thank Dr. R. F. Greene and Dr. K. Daneshvar, Professors of the Electrical Engineering Department, for their stimulating discussions which kept us thinking all the time.
REFERENCES [l] W. T. McLyman, Transformer and Inductor Design Handbook. New York: Marcel Dekker, 1978. [2] S. M. Miri, F. Lu, and M.Williams, “Design and analysis of a lowleakage power supply transformer for QUAD4 solid-state meter,” Dept. of Electrical Engineering, The University of North Carolina at Charlotte, Tech. Rep., Sept. 1991.