Chapter 26
Detailed Mapping of Landslide Susceptibility for Urban Planning Purposes in Carpathian and Subcarpathian Towns of Romania Bogdan Mihai, Ionut Sandric, Ionut Savulescu and Zenaida Chitu Faculty of Geography, University of Bucharest, Romania
[email protected], {sandricionut, savulescui, zenaidachitu}@yahoo.com
Abstract The Carpathian and Subcarpathian towns in Romania developed under different geographical and historical conditions. Their built-up areas cover mainly slopes and sometimes terraces and higher floodplains. Some towns are old (mainly since the 14–16th centuries) but there are also newer settlements (since the 19th and even the last century). Mass movements and mainly landslides, are active morphodynamic features of the built-up areas. Since the liberalization of the immobiliary market they became important for the urban planning projects as well as for local people and the immobiliary sector. The paper we propose compares the cartographic results obtained within two case studies, featuring middle size and small towns, with two different geomorphic conditions: Predeal, a traditional mountain resort and Orsova, an entirely new rebuilt town, upstream from the Iron Gates Dam, on the Danube River in Banat Mountains. The maps were created using two different methods for landslide susceptibility assessment: probabilistic (Dempster-Shafer) and multidimensional analysis (Principal Components Analysis with logistic regression). For each town both methods were applied and the results were compared. In both cases the methods spatially delineated approximately the same areas as susceptible to landslides but with different susceptibility levels. Keywords: landslide, mapping, susceptibility, urban development, principal components analysis, logistic regression, Dempster-Shafer G. Gartner, F. Ortag (eds.), Cartography in Central and Eastern Europe, Lecture Notes in Geoinformation and Cartography, DOI 10.1007/978-3-642-03294-3_26, © Springer-Verlag Berlin Heidelberg 2010
418 Bogdan Mihai, Ionut Sandric, Ionut Savulescu and Zenaida Chitu
26.1 Introduction Since the year 2005, different regions were affected by heavy rainfalls that led to dramatic floods with important damages, in terms of life, houses, crops and infrastructure. These phenomena start to have a periodicity, related to snowmelt, in spring (March to May), then to the big rainfall and storms in July and August. The heavy rainfall that led to floods had also triggered landslides, mostly by reactivations of the old landslides. These phenomena affected also the settlements with a dramatic impact in the hilly and mountain areas where urban/rural infrastructures are old and not well maintained (bad roads, old and inefficient water drainage pipelines on slopes, old protection walls affected by the older mass movements etc.). Most of the urban settlements within these areas include districts with rural features since the 1968 administrative reform. There are some situations of some ”urban districts” which moved since 1975 from their original place to another like for example the former village of Irimesti, belonging to Breaza town in the Prahova Subcarpathians as an effect of the deep mass movements (Sandric 2008). Mapping these phenomena became an important task for the future development of each Carpathian and Subcarpathian urban settlement. In 2007, The Romanian Government started to develop a methodology for risk mapping and assessment. This task is a part of the National Data Infrastructure Project with the main goal to finish the basic level of risk mapping in 2013, and to start the detailed risk mapping. The regional planning documents, like the territorial development plans appeared after 1991, contains schematic maps of hazard and risk phenomena to the level of each county
26.2 Data and Methodology Detailed mapping of landslide susceptibility (Crozier & Glade 2005) is an approach that needs a big amount of data. This is the reason of developing GIS applications since the 90s (Carrara et al. 1991, Carrara et al. 1995, Van Westen 1994). Several approaches in the international literature focuses on different featured mountain areas and put the emphasis on different type of geomorphic hazards at different scales (Donati & Turini 2002, Edbrooke et al. 2002, Gornitz et al. 2002, Giumaraes et al. 2003, Mihai 2005, Moon & Blackstock, 2004, Pasuto & Soldati 2004, Lundkvist 2005, Komac 2006 etc.). Our approach is a synthesis of some case studies regarding two towns from the Romanian Carpathians. The paper we propose compares the cartographic results obtained within two case studies (Figure 26.1), featuring middle size and small towns, with two different geomorphic conditions: Predeal, a traditional mountain
Mapping of Landslide Susceptibility for Urban Planning Purposes 419
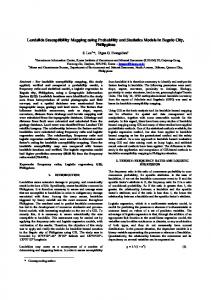
Fig. 26.1. The geographical location of the case studies urban settlements in Romania
resort to the springs of the Prahova River and Orsova, an entirely new rebuilt town, upstream from the Iron Gates Dam, on the Danube River in Banat Mountains. The data sources for each of the analytic map are different. These are in fact maps, aerial and satellite imagery and field topographic and GPS measurements. One of the key features of the data for detailed mapping in Romania is the limited availability in digital format. Various thematic maps were mostly available on analog format printed on paper and this made difficult and cumbersome the data acquisition process. These were scanned at a high resolution and then georeferenced with high precision in Stereographic 1970, datum Pulkovo 1942, the national coordinate system. Two map categories were available: the topographic maps 1:25,000 (for Predeal and Orsova case studies) and 1:5,000 (for the other analysis) and the geological maps at a scale of 1:50000. These data were sufficient in order to obtain reliable DEM in order to calculate the slope gradient, curvature, aspect and other geomorphic features. Additional data were brought through topographic and GPS survey especially on landslide bodies with an active dynamics. Geology layer was not satisfactory in terms of information amount and quality. The paper map sheets (since the 70’s and the beginning of the 80’s) drawn by cartographers from the Geological Institute in Bucharest were quite general and field mapping was needed especially for landslide areas and superficial deposits and soil cover. For the land use we relied on the maps provided by the local authorities. These were geometrically corrected with less than 2.0 meters RMS and then integrated into the GIS application.
420 Bogdan Mihai, Ionut Sandric, Ionut Savulescu and Zenaida Chitu
Aerial imagery has been a very useful data source. Image interpretation process took a long time because the lack of data and the age of their sources (mainly 70s and 80s) made necessary the filling of these information gaps. Orthophotos since the year 2005 at 0.5 m resolution were used for digitizing the land cover data and also the infrastructures in Orsova and partially in Predeal. The last case was covered by the maps (since 2002 Predeal Master Plan, unpublished) which were updated through GPS field surveying, together with aerial photo examination (monochromatic imagery since 1985). The land cover data was derived using the classification of Corine land cover system, adapted for each case study. Field data was essential for developing the GIS applications. Landslide areas were mapped mainly using this method. Within the built-up areas, houses, streets and other infrastructure elements superposes on landslide bodies. Most of them are dormant or with a smooth movement in time. In the most of situations, the topographic visual examination of the ground was not a source of reliable spatial data. Geotechnical studies were available only for small areas of the built-up areas (few square kilometers) and the data obtained were old (more than 10 years and not every time corresponding with the ground truth). Pedological sounding together with the rocky outcrops analysis (helped by the new building foundations opening) helped us to generate the corresponding vector layers, with the help of a GPS receiver (3–4 m error) and sometimes with total station (ca. 1.0 m of error for the largest bodies in Orsova and Predeal). Another dataset was related to the urban landscape features. Building mapping was done in detail in Predeal, for the entire town, because new investments within this mountain resort increased their density. The existing maps were old in terms of building data; a field survey together with photography brought different data in vector format like for example the relative age, the number of floors, the destination, the degradation/improvement level of the buildings etc. Within the town of Predeal, we mapped more than 3500 buildings.
26.3 Methods The methodology used for the landslides susceptibility mapping in Predeal and Orsova was: Dempster-Shafer theory as probabilistic model and PCA with Logistic Regression as multidimensional analysis The Dempster-Shafer, a variant of Bayes probability theory, makes it possible to use incomplete knowledge in the susceptibility analysis (Eastman 2003, Sandric 2005). The PCA analysis (Gorsevski 2004, Chitu et al. 2009) was used to reduce de number of variables and to eliminate de redundant information from these variables.
Mapping of Landslide Susceptibility for Urban Planning Purposes 421
Table 26.1. Data used for the susceptibility assessment Case studies (maps) Town
Year
Data layers and spatial resolution Superficial Land DEM Lithology deposits cover
Landslide bodies
Building, infrastructures
Method (model)
Predeal 2005
Yes 5m
Yes 5m
Yes 5m
Yes 5m
vector
vector
Dempster-Shafer, PCA with logistic regression
Orsova 2007
Yes 10 m
20 m
Yes 10 m
Yes 5m
vector
vector
Dempster-Shafer, PCA with logistic regression
The variables were previously classified and the classes were created to maximize the information and minimize the variance inside a class. Logistic regression (Gorsevski 2004, Chitu et al. 2009) was applied using only the first three principal components obtained from the PCA analysis, because for each town the most of the information were retained by the first three principal components. The principal components were used as independent variables and the past and present shallow landslides as dependent variable and the result was the landslides susceptibility map for each of the combination, indicating the probability that a pixel will contain a landslide.
26.4 Results 26.4.1 Landslide Susceptibility Mapping in the Town of Predeal, Curvature Carpathians, Upper Prahova Valley Both methods (probabilistic and multidimensional analysis) were used to map the landslide susceptibility in Predeal. An important task was first to map at a more accurate level (more than 4–5 m) the landslide areas within the Predeal town built-up area. The geotechnical data available was limited only to the north-western part of the built-up area and its age (1990) limited its value. A field survey using a GPS receiver, together with a pedological surveying made possible the mapping in vector format, of the landslide areas. The maps with the susceptibility assessment produced using the Dempster-Shafer and PCA with Logistic Regression are presented in the Figure 26.2. The main factors that contribute to the high susceptibility values were the slope declivity (0.61–0.65), together with land-cover (0.47–0.5), and then slope deposits and lithology. For each map three classes of susceptibility were defined. The classes were created by splitting in three equal intervals the 0–1 probability scale resulted for each map/each method. The risk assessment can be made by overlaying of the urban built-up area features and infrastructures on the detailed susceptibility map obtained. The resulting docu-
422 Bogdan Mihai, Ionut Sandric, Ionut Savulescu and Zenaida Chitu
Fig. 26.2. Susceptibility assessment produced using the Dempster-Shafer and PCA with Logistic Regression
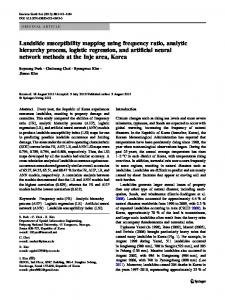
ment, updated from the most recent Master Plan of Predeal (drawn by Proiect Brasov since 2002, unpublished) can be useful for the new urban development plans. The town is featured since 1992, but especially since 2001 (the Law for the Restitution of Nationalized Houses to their former owners) by a real immobiliary fewer. Old houses since the 30s and 40s were repaired, destroyed and rebuilt, but new secondary residences and small private hotels and inns appeared within areas where landslides started to reactivate because of deforestation and topographic reshaping of slopes. The visualization possibilities can improve the mapping because we have developed for each building an attribute table with all their main features (year of building, degree of conservation, number of floors, destination etc.). Since 2005, some of the oldest houses started to be affected by mass movements and cracks within their walls are evidence. Both methods had identified approximately the same areas as susceptible to landslides, but with different susceptibility degrees. The ROC analysis (Pontius 2001) was used to validate the results obtained for both methods and is presented in Figure 26.3. The ROC analysis values resulted for the both maps were between 0.74 for the PCA wiuth Logistic Regression (LR) and 0.73 for the Dempster-Shafer theory, bu the ROC curve from the Figure 26.3 clearry display a sliglty better result for the PCA with LR in identifying the areas susceptible to landslides in Predeal.
Mapping of Landslide Susceptibility for Urban Planning Purposes
Fig . 26 .3 . town
423
ROC graph showing the validation of the two susceptibility maps for Predeal
Fig . 26 .4 . Differences in the percent of the areas identified as susceptibile to landslides for Predeal town
From Figure 26.4 we can see that the PCA with LR has identified more areas as low and medium susceptible to landslides, but far less areas with high susceptible to landslides that Dempster-Shafer. By comparison the best result is the map obtained from the PCA and LR for the low and medium susceptibility levels and the map obtained from the Dempster-Shafer for the high susceptibility maps, as can be seen, also, from the ROC curves presented in Figure 26.3.
424
Bogdan Mihai, Ionut Sandric, Ionut Savulescu and Zenaida Chitu
26.4.2 Landslide Susceptibility Mapping in Orsova Town, Danube Valley, Banat Mts The town has a particular evolution, because since the creation of the Iron Gates Dam Reservoir in 1964–1972, between Romania and Serbia (the former Yugoslavia at that time), all the settlement along the Danube’s Iron Gates Sector (The Djerdapska Klisura in Serbian or Eisernes Tor in German), had to move up on the slopes. About 17,000 inhabitants lost their homes which were rebuilt within new settlements built-up areas. Water level rise with 35 m behind the new created dam building designed for navigation improvement and hydroelectric power. Orsova town was one of these settlements which emerged on the mountain slopes of the Almaj Mountains and the Mehedinti Plateau, between 1966–1971, when the old town together with other three villages (Coramnic, Jupalnic and Tufari) situated on the terrace tops around the Cerna- Danube rivers junction disappeared after the controlled flooding of the lowest level of the small depression of Orsova (floodplain and the lowest terrace levels). Mapping the landslide susceptibility became a necessary task because the new town site was a less stable one. New buildings (block of flats, villas, public buildings, including the railway, bus and boat station) moved on new grounds, some of them stable (top of terrace remnants), but a lot of them less stable (old landslide bodies superposed on the Miocene sandy-clay with gravel deposits filling the OrsovaOgradena basin). A relevant thing is the occurrence of a betonies clay big body to the upper part of the basin, an area where houses and the national road to Moldova Noua were yearly affected by mass movements and even seriously damaged. The landslide bodies were mapped in field, in built-up areas through sociological investigation and house state examination. We convert them to vector format, after
Fig . 26 .5 . town
ROC graph showing the validation of the two susceptibility maps for Orsova
Mapping of Landslide Susceptibility for Urban Planning Purposes 425
Fig. 26.6. Landslides susceptibility maps for Orsova
a complete examination of ortophotos. A field validation followed with a complete updating of these areas through a GPS survey. Finally all the landslide occurrences were recognized in field, and redrawn according to the field situation. It was possible to discover and map new landslides areas and the slope susceptibility to landslides was confirmed (4–5 bodies on less than 10 km2). The ROC analysis values resulted for the both maps were between 0.83 for the PCA wiuth Logistic Regression (LR) and 0.94 for the Dempster-Shafer theory from which we can conclude that in the case of Orsova the Dempster-Shafer theory has better identifed the spatial distribution of the areas susceptibile to landslides. The ROC curves shows a very good validation of the Dempster-Shafer theory and in the same time a good validation for the PCA and LR model, the differences beeing for the all three levels of susceptibility From Figure 26.7 we can see that Dempster-Shafer method has identified more areas as medium and high susceptible to landslides and a bit less areas as low susceptible to landslides. By comparison the best result is the map obtained from the Dempster-Shafer, which has identified better the actual landslides bodies and areas with similar conditions. From the Figure 26.6 we can observe that areas with high susceptibility to landslides are present on the hill slopes of Orsova town, very close to the Cerna bay. For this area the high susceptibility is false, the result being highly influenced by the contribution of the built-up area from the north-eastern part where due to lithological background, the landslides have a high density.
426
Bogdan Mihai, Ionut Sandric, Ionut Savulescu and Zenaida Chitu
Fig . 26 .7 . Differences in the percent of the areas identified as susceptibile to landslides for Orsova town
From the maps analysis is easy to observe the areas where landslide bodies features mainly the Turlui catchment where the town centre and the western districts developed, along the national road to Moldova Noua. The landslide high susceptibility areas correspond for Dempster-Shafer method to more than 80% of the mapped landslide bodies and more than 60% for the PCA with Logistic Regression method, but there are also some dormant areas of future mass movements. These are overgrazed areas with poor quality roads and footpaths and less efficient slope drainage works. Superficial landslides could appear on the slopes of the gullies within the town built-up areas where poor quality old drainage works occur. The maps show the situation of a town rebuilt in a short time (5 years) with a population of more than 12,000 inhabitants, covering a limited area, less stable than the former town site.
26.5 Discussion The landslide susceptibility maps for each town were drawn with slightly different datasets. The main problem was the data availability, and the data quality. Data was seldom available in digital format, in all these situations. Some maps were scanned a stitched using the image processing packages (the Predeal town master plan maps). Other maps were like the topographic plans of Orsova town (1:1,000) were in a digital drawing format, which was converted into shape file format but with a poor geometric quality. This was the reason they were used only on fieldwork for data display and validation to the level of topography, building and urban infrastructures.
Mapping of Landslide Susceptibility for Urban Planning Purposes 427
Another problem is the amount of digital layers integrated within the analysis. Their number is usually limited because the subsequent data acquisition needs fieldwork investigation and measurements. An example is the availability of underground water data, which represents a condition for landslide triggering. The water table is not continuous and the existing hydro-geological data is old and of quite poor quality. Other data, like the pedological data was available because of the pedological sounding carried for slope deposits morphological analysis. Mapping of landslide susceptibility is a long process. Database building takes a long time because of the low data quality which needs also new data sets acquiring. For example, land use- land cover data was not enough within the available cartographic documents. Topographic maps at different scales are old and does not show a detailed data (1:5,000 dates since 1975 and 1:25,000 were updated since 1982). Satellite imagery usually available had a limited role within the data acquisition process because the towns are quite small and their resolution is limited. The best image used was the SPOT a high resolution visible image since 1997 for the Predeal area (10.0 m); this was subjected to a complex visual interpretation. The best available data is represented by the orthophotos in digital format, since 2005, which were interpreted for the land cover classification using the CORINE land cover legend system. Validation was the most important step for mapping. This is a longer process, because landslides can occur in different places but not every time along the years. For some of the maps this process almost finished but for some of them we evaluate the result. For example, in Predeal town the validation was done in different points were shallow landslide occurs on almost all slopes where spruce fir trees were removed for making grounds for new villas. Small cracks were mapped on the walls of houses in Orsova towns and they must be followed in time. Local enquiries help the validation process.
26.6 Conclusion The maps presented within the paper are the first similar applications in Romania, although there were few similar contributions at lower scales previously (Armas et al. 2003) for the Subcarpathian sector of the Prahova River Valley. The approach had three main goals: the searching of a better digital modeling and mapping methodology, the evaluation of the results and also the transfer of the validated maps to the local authorities. These objectives can be reached when the local authorities collaborates with the research team. They can help the data acquisition process and then the validation process of the final maps. Fieldwork difficulties can easily appear because of the permanent need to access on private ownership. Sometimes, aerial ortophotos can help the ’’access’’ in this areas but their resampling level can affect
428 Bogdan Mihai, Ionut Sandric, Ionut Savulescu and Zenaida Chitu
the detailed visual analysis. The detail degree of these maps is another discussion topic. Usually we start from the DEM resolution and from the other data resolution. GPS data is available at resolution of 3–4 meters, but this can be improved for landslide body limits to tens of centimeters using total station (Orsova biggest landslide in the Turlui catchment or differential GPS surveying (Predeal northern area on Cioplea Hill). The mapping scale can help the distribution of errors to the level of the whole digital map. These maps will be a necessary document for the urban planning project development, like there are in a lot of European Union countries. They can be attached to the master plan maps which must be updated every ten years. The building licenses can be issued also taking into account these maps.
Acknowledgement The results presented within this paper were financed by the Romanian National Authority for Research in Higher Education (CNCSIS), grants no. 33379AT (2004– 2005), 2916AT (2006–2007) and 2916 TD (2006–2007). Grant directors Bogdan Mihai PhD and Ionut Sandric PhD student.
References Armas I, Damian R, Sandric I, Osaci-Costache G (2003) Vulnerabilitatea versantilor la alunecari de teren in sectorul subcarpatic al Vaii Prahova, Bucuresti. Ed. Fundatiei Romania de Maine Carrara A, Cardinali M, Detti R, Guzzetti F, Pasqui V, Reichenbach P (1991) GIS techniques and statistical models in evaluating landslide hazard, Earth Surface Processes and Landforms, 16, pp 427–45 Carrara A, Cardinali M, Guzzetti F, Reichenbach P (1995) GIS technology in mapping landslide hazard. In: Carrara A, Guzzetti F (eds) Geographic Information Systems in Assessing Natural Hazards, Dordrecht, Kluwer Academic Publishers Chitu Z, Sandric I, Mihai B, Savulescu I (2009) Evaluation of Landslide Susceptibility using Statistical Multivariate Methods. In: Landslide Processes from Geomorphologic mapping to dynamic modelling (eds) Malet et al, CERG Crozier M, Glade T (2005) Landslide Hazard and Risk: Issues, Concepts and Approach. In: Glade T, Anderson M, Crozier M (eds.) Landslide hazard and risk, edn Wiley Donati L, Turrini M (2002) An objective method to rank the importance of the factors predisposing to landslides with the GIS methodology. An application to an area of the Apennines (Valnerina ; Perugia, Italy), Engineering Geology, 63, pp 277–89 Eastman JR (2003) Idrisi Kilimanjaro, Guide to GIS and Image Processing, Clark Labs, Clark University, Worcester MA, USA
Mapping of Landslide Susceptibility for Urban Planning Purposes 429
Edbrooke S, Mazengarb C, Stephenson W (2002) Geology and geological hazards of the Auckland urban area, New Zealand, Quaternary International, 103, pp 3–21 Gornitz V, Couch S, Hartig E (2002) Impacts of sea level rise in the New York City metropolitan area, Global and Planetary Change, 32, pp 61–88 Gorsevski P (2001) Statistical modeling of landslide hazard using GIS, Proceedings of the Seventh Federal Interagency Sedimentation Conference, March 25 to 29, Reno, Nevada, pp103–109 Guimaraes RF, Montgomery D, Greenberg H, Ferreira-Fernandes N, Trancoso-Gomes R, De Carvalho O (2002) Parameterization of soil properties for a model of topographic controls on shallow landsliding: application to Rio de Janeiro, Engineering Geology, 69, pp 99–108 Mihai B (2005) Muntii Timisului (Carpatii Curburii). Potential geomorfologic si amenajarea spatiului montan. Bucuresti: Editura Universitatii din Bucuresti Moon V, Blackstock H (2004) A methodology for assessing landslide hazards using deterministic stability models, Natural hazards, 32, pp 111–134 Komac M (2006) Application of a perialpine landslide susceptibility model in the Alpine region, Geologija, 49,1, pp 141–150 Lundkvist M (2005) Accident risk and environmental assessment. Development of an assessment guideline with examination in Northern Scandinavia, Geografiskaregionstudier, 65: Uppsala Universitet Pasuto A, Soldati M (2004) An integrated approach for hazard assessment and mitigation of debris flows in the Italian Dolomites, Geomorphology, Volume 61, Issues 1–2, 1 July, pp 59–70 Pontius, R, Schneider, L C (2001) Land-cover change model validation by an ROC method for the Ipswich watershed, Massachusetts, USA. Agriculture, Ecosystems and Environment 85: 239–248 Sandric I (2005) Aplicatii ale teoriei probabilitatilor conditionate in geomorfologie, Analele Universitatii Bucuresti, Anul LIV-2005 Şandric I (2008) Sistem informational geografic temporal pentru evaluarea hazardelor naturale. O abordare bayesiana cu propagare de erori, PhD Dissertation, University of Bucharest Van Westen C J (1994) GIS in landslide hazard zonation: A review with examples from the Andes of Colombia. In Price MF, Heywood DI (eds), Mountain Environments and Geographic Information Systems: Taylor and Francis Publishers