Marwah Abdulmajeed Azeez et al, International Journal of Computer Science and Mobile Computing, Vol.4 Iss.2, Feb- 2015, pg. 307-313
Available Online at www.ijcsmc.com
International Journal of Computer Science and Mobile Computing A Monthly Journal of Computer Science and Information Technology
ISSN 2320–088X IJCSMC, Vol. 4, Issue. 2, February 2015, pg.307 – 313 RESEARCH ARTICLE
Detection and Segmentation of Lung Cancer using Statistical Features of X-Ray Images Marwah Abdulmajeed Azeez1, Sabah Noori Mazhir2, Alyaa Hussein Ali3 ¹Department of Physics, Baghdad University, Iraq ²Department of Physics, Baghdad University, Iraq ³Department of Physics, Baghdad University, Iraq
[email protected];
[email protected];
[email protected]
Abstract— The early detection of lung cancer is a difficult task because it is one of the important problems due to the installation of complex cancer cells. It is difficult to diagnose quickly through the x-rays only, therefore enlisted this techniques such as digital technologies, becoming a process of early detection of cancer easier complicated. X-ray images contain the noise so as to contain the bones of the rib cage, as well as the bones of the sternum, which is a major obstacle to distinguish cancer, therefore, to improve the images using a filter (median) as well as the way of image segmentation, the thresholding and edge detection methods. Dividing the lung into two parts (upper and lower) comparing the parts with each other to identify which part carry the tumor .The statistical features has been calculated using first Order histogram. In this research three images of one patient has been used after several stages of treatment. Keywords— Cancer, X-ray image, segmentation, statistical feature 1. INTRODUCTION Lungs are located on the lateral sides of the thoracic cavity and separated from each other by the mediastinum. As the left lung is physically smaller than the right lung This is because the right and left lungs exhibit some obvious structural differences since the heart projects into the left side of the thoracic cavit, the right lung is subdivided into the superior, middle, and inferior lobes by two fissures. The left lung has a medial surface indentation, called the cardiac impression that is formed by the heart [1]. Lung disease refers to disorders that affect the lungs, the organs that allow us to breathe. Breathing problems which are caused by lung disease may prevent the body from getting enough oxygen [2]. Lung cancer is a highly aggressive and frequently fatal malignancy that originates in the epithelium of the respiratory system. Smoking causes about 85% of all lung cancers. Metastasis, the spread of cancerous cells to other tissues, occurs early in the course of the disease, making a surgical cure unlikely for most patients [1]. Xray imaging is the fastest, most common, and least expensive diagnostic. Production of digital X-rays from pictorial radiographs is becoming a common practice to maximize information and reduce the number of
© 2015, IJCSMC All Rights Reserved
307
Marwah Abdulmajeed Azeez et al, International Journal of Computer Science and Mobile Computing, Vol.4 Iss.2, Feb- 2015, pg. 307-313
rejected X-rays [3]. X-rays are among the oldest sources of electromagnetic (EM) radiation used for imaging. The best known use of X-rays is medical diagnostics [4]. 2. METHODOLOGY Analysis of tissue is a process which is very successful in the diagnosis of medical images of abnormal lung tissue and for this reason we need the help of x-rays and digital image processing, which is the way of modern diagnosis defect. The steps to detect the cancer are:1. Cancelling the rips which appear white on the lungs this can make mastics in detecting the cancer by subtracting the background of the lung image from the cancer. 2. Dividing the lung which carry the cancer into two parts (normal and abnormal). Comparing these with each other by the histogram plot and statistical features. 3. When we specify which part hold the cancer the image is processed by the following steps:A. Image segmentation Image segmentation is the most difficult task in image processing. Segmentation refers to the grouping of image elements that exhibit “similar” characteristics, i.e. subdividing an image into its constituent regions or objects [5]. The thresholding process is the simplest way to segmented the x-ray image. B. Median Filter Median filtering is a nonlinear signal processing technique which is useful for noise reduction in images [6]. It is the best-known order-statistic filter, which replaces the value of a pixel by the median of the intensity levels in the neighborhood of that pixel. C. Thresholding Thresholding is one of the simplest segmentation methods. It can extract the object from the background by grouping the intensity according to the threshold value [7]. D. Edge detection Edge detection is a type of image segmentation techniques which determines the presence of an edge or line in an image and outlines them in an appropriate way [8]. The main purpose of edge detection is to simplify the image data in order to minimize the amount of data to be processed [9]. E. Region of interest A region of interest, is a selected subset of samples within a dataset identified for a particular purpose. The concept of an ROI is commonly used in many application areas. In medical imaging, the boundaries of a tumor may be defined on an image or in a volume, for the purpose of measuring its size [10]. And It’s property which are the statistical and Geometrical features. 3.
FIRST-ORDER STATISTICS FEATURES
First-order statistics measure the likelihood of observing a gray value at a randomly-chosen location in the image. First-order statistics can be computed from the histogram of pixel intensities in the image. These depend only on individual pixel values and not on the interaction or co-occurrence of neighbouring pixel values [11]. Where, i is between (0, 255), p(i) the probability density of occurrence of the intensity ,as determined from the histogram with total number of pixels in the image is given as[12]. .……….. …
(1)
Where i= 0,1,2……. G-1 G=gray level tone of an image. N=number of cell in horizontal domine , M= number of cell in vertical domine. The features which obtained from the histogram. Energy Provide the sum of squared elements. It is also known as uniformity or the angular second moment. Its range is from 0 to 1. Energy is E for a constant image [13]. . ………………
© 2015, IJCSMC All Rights Reserved
(2)
308
Marwah Abdulmajeed Azeez et al, International Journal of Computer Science and Mobile Computing, Vol.4 Iss.2, Feb- 2015, pg. 307-313
Entropy
Measures the randomness of a gray-level distribution. The Entropy is expected to be high if the gray levels are distributed randomly throughout the image [13]. It is given by ……….
H=
(3)
mean
It provides the mean of the gray levels in the image. The Mean is expected to be large if the sum of the gray levels of the image is high [13]. It is given by ……… (4)
Variance
Variance tells us, how spread out the distribution of gray levels is. The Variance is expected to be large if the gray levels of the image are spread out greatly [13]. It is given by σ2
………
(5)
Standard Deviation
Standard Deviation shows much 'variation' or 'dispersion' exists from the average [13].
Skewness
Skewness of the histogram is also known as third moment. This measure is 0 for symmetric histograms, positive by histograms skewed to the right (about the mean) and negative for histograms skewed to the left. For smooth images this value comes to be negative. Following equation is used to calculate third moment[14]. µ3= σ-3
……… (7)
kurtosis
The kurtosis is the flatness of histogram [12]. Kurtosis is the degree of peskiness of a distribution, defined as a normalized form of the fourth central moment of a distribution. There are several flavors of kurtosis commonly encountered, including the kurtosis proper [15,16] . µ4= σ-4
…… …. (8)
4. EXTRACTING THE LUNG DISEASE In the sample images, the background illumination is clear in the center of the image than at the other regions. The morphological opening operation is used to estimate the background illumination. Morphological in erosion followed by a dilation, the opening operation has the effect of removing object that can not completely contain the structuring element. To create a more uniform background, subtract the background image, background, from the original image, after subtraction, the image has a uniform background but is now too dark. The thresholding has been applied with adding a pseudo –color image a matrix which is RGB to identify each object in the matrix image with a different color in the associated color map matrix.
© 2015, IJCSMC All Rights Reserved
309
Marwah Abdulmajeed Azeez et al, International Journal of Computer Science and Mobile Computing, Vol.4 Iss.2, Feb- 2015, pg. 307-313
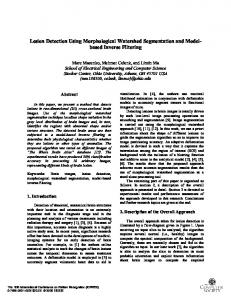
The right upper part of the lung (normal)
Original image
Histogram
The right bottom part of the lung (abnormal)
Histogram
Cancer Small cell carcinoma of the lung after Five weeks later Cases
Cancer Small cell carcinoma of the lung after Two months later Cases
Fig 1 Shows the left and right part of the lung for the normal and abnormal images with histogram of three cases of at different time TABLE 1 The statistical features for the special Cancer Case
Image No.1
mean
variance
energy
Skewness
kurtosis
entropy
Standard Deviation
upper right side
36.6054
833.4615
0.0126
5.6749e-005
6.8089e-008
0.1133
82.8697
Bottom right patient
39.973
845.8074
0.0140
5.7665e-005
6.8178e-008
0.1268
29.0827
TABLE2
The statistical features for the special Cancer Case after Five weeks Image No.2
mean
variance
energy
Skewness
kurtosis
entropy
upper right side Bottom right patient
33.3142
760.5291
0.0139
6.9343e-005
9.1178e-008
0.1185
Standard Deviation 82.5776
37.6092
807.7151
0.0125
5.6452e-005
6.9891e-008
0.0914
28.4203
kurtosis
entropy
Standard Deviation
1.2894e-007
-0.0294
82.3554
2.2458e-007
0.0293
22.3024
TABLE 3 The statistical features for the special Cancer Case after Two months
Image No.3
mean
variance
energy
upper right side
33.8003
642.8964
0.0150
Bottom right patient
31.3018
497.3995
0.0163
Skewness 8.2895e005 1.1170e004
Three samples for the same patient have been taken for different time after the patient has received a treatment we have take an image for the patient after five weeks, then after two months. The statistical features for the three images are shown in table (1,2,3) figure (2) shows the (ROI) for the cancer.
© 2015, IJCSMC All Rights Reserved
310
Marwah Abdulmajeed Azeez et al, International Journal of Computer Science and Mobile Computing, Vol.4 Iss.2, Feb- 2015, pg. 307-313
Image No.
RGB image
Threshold after ROI
Edge detection using prewitt
image number 1 T=200
After Two months Image No.3
T