VOLUME 85, NUMBER 21
PHYSICAL REVIEW LETTERS
20 NOVEMBER 2000
Detection and Sorting of Neural Spikes Using Wavelet Packets Eyal Hulata,1 Ronen Segev,1 Yoash Shapira,1 Morris Benveniste,2 and Eshel Ben-Jacob1, * 1
School of Physics and Astronomy, Raymond & Beverly Sackler Faculty of Exact Sciences, Tel-Aviv University, Tel-Aviv 69978, Israel 2 Department of Physiology & Pharmacology, Sackler Faculty of Medicine, Tel-Aviv University, Tel-Aviv 69978, Israel (Received 10 January 2000) We propose a novel method for the detection and sorting of recorded neural spikes using wavelet packets. We employ the best basis via the Shannon’s information cost function and local discriminant basis using mutual information. We demonstrate the efficiency of the method on data recorded in vitro from 2D neural networks. We show that our method is superior both in separation from noise and in identifying superimposed spikes. PACS numbers: 87.17. – d, 05.70.Ln, 82.40.Bj
0031-9007兾00兾85(21)兾4637(4)$15.00
Yet, the signature of different neurons might be quite similar. Thus, a simple wavelet transform will require many components to distinguish between spikes of different origins. To overcome this difficulty, we have developed a novel method using wavelet packets decomposition to detect and sort neural spikes. The decomposition uses a family of orthonormal bases from which one optimal basis can be selected. We show how to determine one optimal basis for spike detection and sorting by maximizing the Shannon information function and by using discriminant basis techniques based on mutual information. We present a test of our method by applying it to measurements of neural spikes from cell cultures grown on a multielectrode array. An important feature of our method is that nine coefficients of the optimal basis can both discriminate well between spikes and background noise and also distinguish among spikes from different origins.
50 0 µV
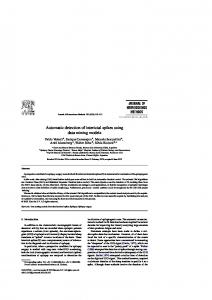
Current technology enables simultaneous recording of electronic signals from many neurons in a neural network (cell cultures, hippocampal slices, and in vivo tissues) [1–6]. It is expected to improve our understanding of how real neural networks code, learn, and store information. There are three main obstacles in analyzing and recognizing signals from such recordings: (i) The spikes from neurons farther away from the electrode can be embedded in the noise as is shown in Fig. 1. (ii) Signal recognition may be complicated by a superposition of multiple action potential spikes (Fig. 1). (iii) The volume of data which is present from a simultaneous recording from a multielectrode at a resolution of an action potential is too great. In a typical experiment ⬃250 000 individual spikes can be recorded. Various signal processing techniques have been used to detect and sort neural spikes (see Refs. [7,8] for reviews). One popular method to detect and classify spikes is to filter the data utilizing a series of templates of the spike waveform of each neuron [7]. Simple variants of this method utilizing principal components analysis have been developed [7]. Here we propose a more efficient method based on wavelet packets decomposition. Our method uses a few packet coefficients for both detection and sorting of neural spikes. The same coefficients enabled good detection and sorting of many different spike waveforms originating from different electrodes and experiments. A comparison between wavelet packets decomposition and principle components analysis is presented below. The neural spikes, being short voltage pulses, are localized functions whose natural analysis is via the use of wavelets transform [9,10], which is the Fourier transform analog for localized functions. Important information often appears through a simultaneous analysis of the signal’s time and frequency properties. The wavelet transform which covers the time-frequency domain enables us to visualize the specific properties of the signal at hand [11]. However, a disadvantage of using the wavelet basis is that it divides the time-frequency domain into predetermined frequency bands which are not optimized for neural spikes. Spikes from different neurons can have distinct signatures.
−50 1
1 1
−100 −150
2
2 2 5
10 msec 15
2 20
FIG. 1. Recording from a single electrode which detects signals from three neurons marked. Note that in the presented time we show only two of the spikes detected so we mark only spike 1 and spike 2. The spikes sometimes superimpose one another as partially seen with the two “1’s” at the center.
© 2000 The American Physical Society
4637
VOLUME 85, NUMBER 21
PHYSICAL REVIEW LETTERS
The wavelet transform of f [ V at scale a and time b兾a is defined [12] ∂ µ Z ` 1 ⴱ t2b ⴱ F共a, b兲 ⬅ 具 f, ca,b 典 苷 dt , f共t兲 p c a a 2` (1) where c共t兲 is called the mother wavelet and t2b ca,b ⬅ c共 a 兲 is a scaled and translated wavelet. Numerically, f is represented by a vector of length N. For simplification we demand that N 苷 2L . It is convenient to choose discrete values for a and b that are in the base of 2 (a 苷 2i and b 苷 2i ⴱ j, where i, j are nonnegative integers). It can be proven that the set ca,b for discrete a and b is an orthonormal basis [12]. It is intuitively useful to view the wavelet transformation as filtering the function f [13,14]. In this case, the scale parameter a represents the bandwidth of the filter. Suppose that V represents the frequency domain of the function f. The first level of the transform (a 苷 2) filters f into low and high frequency (two halves of V labeled V1,0 and V1,1 , respectively. In the second level of the transform (a 苷 4) only the low band of level 1 (V1,0 ) is filtered again into two halves V2,0 and V2,1 . This can be repeated L 苷 log2 共N兲 times. The result is a division of the frequency domain into a sequence of bands, each of half the bandwidth of its former. The division is finer as zero frequency is approached. A complete orthonormal basis is derived during this division. This basis covers V through a union of bands: V1,1 © V2,1 © · · · Vn,1 © Vn,0 苷 V. Wavelet packets decomposition [12,14,15] is a more flexible division of the frequency domain than the wavelet transform. Unlike the wavelet transform, the wavelet packets decompose the frequency domain into finer regions at all frequencies. Using the bands and filter view, each band Vi,j is decomposed into two branches Vi11,2j , Vi11,2j11 (lower and higher halves of the bandwidth, respectively). The packets that cover all those bands form an overredundant class of orthonormal bases. One can choose any complete set of bands that cover V without overlapping. The unique features of the neural spikes are located around certain frequencies with related bandwidths. The packet decomposition allows us to match the packets with appropriate frequencies and bandwidths to the features of the neural spikes. Our goal is to define a method to select the basis that is optimal for the problem at hand. The best basis algorithm is a method to select an orthonormal basis that compactly covers the energy distribution of a signal. We present here an intuitive understanding of the algorithm. For a more detailed and mathematical description, see Refs. [14,16,17]. The principal idea of best basis is finding a basis with as few significant coefficients as possible. In other words, as opposed to a basis that distributes the signal’s energy homogeneously, we wish to find a basis that concentrates 4638
20 NOVEMBER 2000
the signal’s energy over a few basis members. Hence, the basis underlines the features of the signal. The fit of the basis to the signal’s features is evaluated with a cost function M that will quantitatively favor either Vi,j or its two branches as basis members. A common measure fit for weighting the distribution of energy over the basis members is the Shannon information function which corresponds to minus the entropy: m X M共q兲 苷 qi log共qi 兲 , (2) i苷1 m is the set of basis coefficients that spans Vi,j where qi苷1 [14,16,18]. There is an intuitive relation between the information cost function and the physical entropy. Maximum entropy corresponds to a homogeneous distribution over microstates. Thus, minimum entropy (maximum information) should correspond to concentration of energy over a minimal number of basis members. The result is a basis (a complete nonoverlapping set of subspaces that span V) that has an overall maximum information. Our goal is not to find an optimized basis to describe a neural spike, but rather to efficiently distinguish among different types of spikes. The technique local discriminant basis [18] is a best basis technique which isolates the minimal number of basis members that best separates the energy distributions of different types of signals. Given two classes of signals, x 共1兲 and x 共2兲 , the discriminant basis will isolate the packets’ coefficients that possess the most different values for x 共1兲 and x 共2兲 . Accordingly, a new cost function that maximizes the difference among packets’ coefficients values must be defined. In direct relation to the information cost function defined above, a discriminant measure of mutual information (cross entropy) can be defined: n n X X qi pi D共q, p兲 苷 qi log 1 pi log , (3) p qi i i苷1 i苷1 m is the set of basis coefficients that spans Vi,j where qi苷1 m for the class of x 共1兲 and pi苷1 is accordingly the set of coefficients originated from the class of x 共2兲 [18]. This cost function is used to quantitatively favor either Vi,j or its two branches according to the power of separation achieved using the corresponding basis members. We now demonstrate our method on real measurements. Extracellular recordings were made utilizing a multielectrode array (MEA) consisting of 60 substrate-integrated thin film microelectrodes (MEA chip, Multi Channel Systems [6], for cell culture procedure; see [19]) of 10 mm width and 200 mm between the electrodes. The electrode impedance is 100 500 KV at 1 kHz and its bandwidth of 10 Hz to 3 kHz permits the recording of individual spikes. Low-noise amplifiers are integrated on a single board (B-MEA-1060, amplifier, gain 32000 with bandpass filter 200 Hz – 5 kHz, Multi Channel Systems). The signals collected from the microelectrodes are digitized and stored
PHYSICAL REVIEW LETTERS
packets applied on the manually separated spikes. A coefficient possesses a separation ability if it captures a higher portion of a spike’s energy than of noise energy. Thus, the “twist” point in the energy distribution curve distinguishes between the separating and nonseparating coefficients. We find that only the first two principal components have separation ability and they contain 76% of the signal’s energy. On the other hand, there are nine separating wavelet packets that contain 74% of the signal’s energy. The energy coverage of both methods is similar but the high separation dimension of the wavelet packets enables better separation ability. Next, we compare the distribution of the noise energy over the coefficients of principle components and wavelet packets. We manually selected ⬃200 time windows with no spikes. As we show in Fig. 2b the principal components contain more noise energy than the packets. This enables the wavelet packets to better separate spikes from noise. To evaluate the two spike sorting techniques we test the result vs manual separation. We compare the two automatic separation abilities in two stages: (i) the ability to distinguish between single spike and noise and (ii) the ability to analyze a complex signal with a number of neural sources that generate overlapping spikes. The automatic separation of clusters is done using the simple k-means classifier [22,23]. The k-means algorithm finds distinct clusters in multidimensional space. For principal components the dimension is 2 and 9 for wavelet packets. A test case of 400 events was manually built from a recording which contained overlapping spikes (see Fig. 1). The test case was composed of 100 events of each spike type and 100 events of transient noise. Each of the spike types is roughly in a different amplitude range, but a simple threshold detector failed to separate among them. In Fig. 3 we present a comparison between our method and principal components. The curves shown in the figure are the cluster means identified by the clustering algorithm. As is seen using wavelet packets enables one µV
by a personal computer equipped with a 16-channel, 12-bit data acquisition board (Microstar DAP , 770 K samples兾s) and a multiplexer that enables simultaneous 60 electrode recording at rate of 12 K samples兾s per electrode. The data were acquired utilizing ALPHA-MAP data acquisition software (Alpha Omega Engineering). Data from each electrode array were recorded continuously for 6 hours. A specific electrode which picked up several neurons and exhibited overlapping of spikes was selected. A threshold detector was used to mark voltage amplitudes which exceeded the noise by 3.5 fold. A window of 256 samples around the event was isolated. Each window (an example is given in Fig. 1) contains a number of neural spikes. The first step is to determine the center location of the suspected spikes. This was achieved by imitating the shift-invariant wavelet packets decomposition [11,21]. In this method we use the shifted version of wavelet packets to decompose the signal and detect a peak amplitude. Once a peak is detected we mark it for further analysis by the best basis. We chose Coiflet of order 5 as a mother wavelet. This mother wavelet is nearly symmetric and has little overlapping both on time and frequency domains. The nonoverlapping feature is important, as it does not spread the signal’s energy into neighboring packets (see [14] for discussion). For initial determination of the basis we separated manually a few dozen event windows into three groups of neural spikes and one noise group. Then, the local discriminant basis procedure was applied between pairs of groups and a discriminative basis was obtained for each pair. For a number of groups larger than two (as in our case), we receive six bases as the procedure is applied on two groups at a time. It appeared that the union of those bases was only slightly overcomplete as most bases had selected similar packets. Thus, the union of bases acted as a discriminating basis for all four groups. Among the basis members, the most discriminative packets were used for the spike sorting. In Fig. 2a we show the comparison between the decomposition coefficients of principal components and wavelet
20 NOVEMBER 2000
(a)
80
(b)
8
%
%
40
4
20
2
components #
200
150
5
10
15
0 0
100
100 msec components # 5
10
15
FIG. 2. A comparison between the separation ability of the wavelet packets (solid lines) and principle components (dashed lines). (a) Distribution of energy percentage over the coefficients. Only the first two principal components have separation ability as opposed to nine wavelet packets. (b) Distribution of noise energy: the first principal components capture more noise energy than the wavelet packets, thus reducing the ability to separate spikes from noise.
(b)
200
6
60
0 0
(a)
µV
VOLUME 85, NUMBER 21
0
2
4
6
8
10
50 0
msec 2
4
6
8
10
FIG. 3. A comparison of our method (a) and principal components (b). The curves are the cluster means identified by the clustering algorithm. We manually selected 100 events for each of the three spike types and the noise group. Our method can sort all the three different spike types and separate them from the noise group [bottom curve in (a)]. The resulting clusters are ⬃100 events each. The principal components can sort the maximum amplitude spike [top curve in (b)] but mixes the other two spikes types and the noise group.
4639
VOLUME 85, NUMBER 21
PHYSICAL REVIEW LETTERS
TABLE I. Summary of sorting of the two methods on the test data. The wavelet packets falsely detect 10% of the noise as spikes and show satisfactory detection percentage for all the spike types. On the other hand, the principal components fail to distinguish between the noise and the two low amplitude spikes. False detection Packets Princomp
Detection percentage of spikes Type 1 Type 2 Type 3
10% 88% 93% No separation ability
95% 95%
to sort the three different spikes from each other and the noise group, while the principal components fail to do so. As is clearly seen in Fig. 3a, the wavelet packets separate the three spike types from each other and the noise class. On the other hand, even though the principal components detected the high amplitude spikes, it failed to distinguish the two weaker classes from noise as is shown in Fig. 3b. For the wavelet packets case, even in a low dimensional subspace, the separability of the different clusters can be visualized. All the results are summaries in Table I. To conclude we have presented a new method for detection and sorting of neural spikes. Testing our method on real measurements demonstrates its advantage both in detecting low amplitude spikes embedded in noise and in separating overlapping spikes. We have greatly benefited from conversations with S. Marom and A. Averbuch. This research has been partially supported by a grant from the Israeli Academy of Sciences, the Sackler Institute, and the Adams Super Center for Brain Studies.
*Corresponding author. Email address:
[email protected] [1] Y. Jimbo, H. P. C. Robinson, and A. Kawana, IEEE Trans. Biomed. Eng. 40, 804 –810 (1993). [2] M. Camepari, M. Bove, E. Maede, M. Cappello, and A. Kawana, Biol. Cybernet. 77, 153–162 (1997). [3] D. A. Stenger and T. M Mckenna, Enabling Technologies for Cultured Neural Networks (Academic Press, San Diego, 1994). [4] P. Fromherz, B. Muller, and A. Stett, Phys. Rev. E 55, 1779 (1997). [5] M. P. Maher, J. Pine, J. Wright, and Y. C. Tai, J. Neurosci. Methods 87, 45–56 (1999).
4640
20 NOVEMBER 2000
[6] U. Egert, B. Schlosshauer, S. Fennrich, W. Nisch, M. Fejtl, T. Knott, T. Muller, and H. Hammerle, Brain Res. Protoc. 2, 229 (1998). [7] M. S. Lewicki, Netw. Comput. Neural Syst. 9, R53–R78 (1998). [8] B. Wheeler, Automatic Discrimination of Single Units (CRC Press, Boca Raton, FL, 1999). [9] X. Yang and S. A. Shamma, IEEE Trans. Biomed. Eng. 35, 806 (1998). [10] M. Unser and A. Aldroubi, Proc. IEEE 84, 626– 638 (1996). [11] G. Zouridakis and D. C. Tam, Comput. Biol. Med. 27, 9–18 (1997). [12] I. Daubechies, Ten Lectures on Wavelets (SIAM, Philadelphia, PA, 1992). [13] A. N. Akansu and R. A. Haddad, Multi-Resolution Signal Decomposition (Academic Press, Boston, 1992). [14] S. Mallat, A Wavelet Tour of Signal Processing (Academic Press, San Diego, 1998). [15] R. R. Coifman, Y. Meyer, and M. V. Wickerhauser, Wavelets and Their Applications (Presses Polytechniques et Universitaires Romandes, Lausanne, 1992). [16] R. R. Coifman and M. V. Wickerhauser, IEEE Trans. Inf. Theory 38, No. 2, 713–718 (1992). [17] David Donoho, Xiaoming Huo, and Thomas P.-Y. Yu, Matlab toolbox, http://www-stat.stanford.edu/wavelab/. [18] N. Saito, Ph.D. thesis, Yale University, New Haven, 1994. [19] Cell culture: dissociated cortical cultures were prepared and maintained as described previously [20]. Briefly, the entire cortices from one-day-old Charles river rats were finely chopped. The cortical tissue was digested with 0.065% trypsin (Biological Industries, Beit Ha-Emek, cat. 03-046-1b) in Phosphate Buffered Saline (Biol. Ind. cat. 02-023-1a), for 20 min, followed by mechanical dissociate by trituration. Cells were resuspended in Modified Essential Medium with Eagle’s salts (Biol. Ind. 01-025-1a) containing 5% horse serum (Biol. Ind. 04-001-1a), 1 mg兾ml Gentamycin and 0.02 mM glucose, and plated on the multielectrode array which was previously coated with poly-d-lysine (Sigma). The culture was kept in at 37 ±C with 5% CO2 and 95% humidity. Measurements were made in growth medium at 37 ±C and atmosphere with 5% CO2 and 95% humidity or without keeping the controlled atmosphere. All the recorded spikes were the result of spontaneous network activity. [20] S. Marom (private communication). [21] I. Cohen, S. Ras, and D. Malah, Signal Process. 57, 251– 270 (1997). [22] F. Dellaert, Matlab function, http://www.cs.cmu.edu/ people/dellaert/. [23] S. T. Bow, Pattern Recognition and Image Processing (M. Dekker, New York, 1991).