Pathophysiology/Complications O R I G I N A L
A R T I C L E
Detection of Diabetic Sensorimotor Polyneuropathy by Corneal Confocal Microscopy in Type 1 Diabetes A concurrent validity study AUSMA AHMED, BSC1 VERA BRIL, MD2 ANDREJ ORSZAG, MD1 JENNA PAULSON1
EMILY YEUNG, BSC1 MYLAN NGO, RRT2 STEVEN ORLOV, MD1 BRUCE A. PERKINS, MD,
From the 1Division of Endocrinology and Metabolism, Department of Medicine, University of Toronto, Toronto, Ontario, Canada; and the 2Division of Neurology, Department of Medicine, University of Toronto, Toronto, Ontario, Canada. Corresponding author: Bruce A. Perkins,
[email protected]. Received 25 July 2011 and accepted 13 December 2011. DOI: 10.2337/dc11-1396 © 2012 by the American Diabetes Association. Readers may use this article as long as the work is properly cited, the use is educational and not for profit, and the work is not altered. See http://creativecommons.org/ licenses/by-nc-nd/3.0/ for details.
their specificity as predictive markers for the future onset of neuropathy (5,6). The prevailing concept of the natural history of DSP is that the initiating injury to the peripheral nervous system occurs in the small, unmyelinated, and thinly myelinated Ad- and C-type nerve fibers (7,8). The gold-standard method for evaluating such morphological change in small nerve fibers can be accomplished by the examination of intraepidermal nerve fibers in skin biopsy samples (9). However, this biopsy strategy has inherent limitations as a generalized screening test in all patients with type 1 diabetes, including the invasive nature of the procedure and its cost. As an alternative, the small nerve fibers in the subbasal nerve plexus of the Bowman layer of the cornea can be directly visualized reliably and noninvasively by a technique of in vivo corneal confocal microscopy (CCM) (10–15). The cornea is extremely sensitivedthere appear to be more nerve endings in the cornea than any other anatomical site in the bodydand it is thus a practical location to evaluate changes in small nerve morphology (16). Corneal nerve fibers are thought to closely represent those that are involved in the length-dependent process of DSP despite the fact that they do not arise from the longest nerves in the body. Rather, they arise from the ophthalmic division (V1) of the trigeminal nerve, which anatomically shares similarities with spinal nerves (those traditionally evaluated in DSP) because it has both motor and sensory roots, and morphologically, the small nerve endings in the cornea share features with those that arise from spinal nerves that terminate in the epidermis. CCM parameters, including corneal nerve fiber length (CNFL), corneal nerve fiber density (CNFD), corneal nerve branch density (CNBD), and the tortuosity coefficient (TC) have been studied in casecontrol analyses of DSP (10–15,17,18). However, evaluation of the diagnostic performance of these parameters in type 1 diabetes has been limited to small cohorts or to analyses using reference definitions of
care.diabetesjournals.org
DIABETES CARE, VOLUME 35, APRIL 2012
MPH
1
OBJECTIVEdWe aimed to determine the corneal confocal microscopy (CCM) parameter that best identifies diabetic sensorimotor polyneuropathy (DSP) in type 1 diabetes and to describe its performance characteristics. RESEARCH DESIGN AND METHODSdConcurrent with clinical and electrophysiological examination for classification of DSP, CCM was performed on 89 type 1 diabetic and 64 healthy subjects to determine corneal nerve fiber length (CNFL), density, tortuosity, and branch density. Area under the curve (AUC) and optimal thresholds for DSP identification in those with diabetes were determined by receiver operating characteristic (ROC) curve analysis. RESULTSdDSP was present in 33 (37%) subjects. With the exception of tortuosity, CCM parameters were significantly lower in DSP case subjects. In ROC curve analysis, AUC was greatest for CNFL (0.88) compared with fiber density (0.84, P = 0.0001), branch density (0.73, P , 0.0001), and tortuosity (0.55, P , 0.0001). The threshold value that optimized sensitivity and specificity for ruling in DSP was a CNFL of #14.0 mm/mm2 (sensitivity 85%, specificity 84%), associated with positive and negative likelihood ratios of 5.3 and 0.18. An alternate approach that used separate threshold values maximized sensitivity (threshold value $15.8 mm/mm2, sensitivity 91%, negative likelihood ratio 0.16) and specificity (#11.5 mm/ mm2, specificity 93%, positive likelihood ratio 8.5). CONCLUSIONSdAmong CCM parameters, CNFL best discriminated DSP cases from control subjects. A single threshold offers clinically acceptable operating characteristics, although a strategy that uses separate thresholds to respectively rule in and rule out DSP has excellent performance while minimizing unclassified subjects. We hypothesize that values between these thresholds indicate incipient nerve injury that represents those individuals at future neuropathy risk. Diabetes Care 35:821–828, 2012
D
iabetic sensorimotor polyneuropathy (DSP) represents a diffuse symmetrical and length-dependent injury to peripheral nerves that has major implications on quality of life, morbidity, and from a public health perspective, costs (1,2). At present, underdiagnosis impedes the benefits of early identification, the emphasis on early management, and the prevention of neuropathy-related sequelae.
Furthermore, the lack of an early biomarker for nerve injury hinders the process of drug development in clinical research (3). Practice recommendations for screeningdsuch as examination with the monofilament or vibration tuning forkdare not being systematically performed (4,5), which highlights the urgent need for a valid screening test in clinical practice that overcomes the limitations in
c c c c c c c c c c c c c c c c c c c c c c c c c c c c c c c c c c c c c c c c c c c c c c c c c
821
Corneal confocal microscopy and neuropathy DSP that do not reflect recommendations for classification based on electrophysiological testing in research studies (17,19). Acknowledging the ultimate need for a screening test that can predict future onset of DSP, we first sought to determine the performance of CCM parameters in identifying the presence or absence of DSP. We used a gold-standard definition based on nerve conduction studies in the crosssectional baseline evaluation of an ongoing longitudinal cohort study of patients with type 1 diabetes. RESEARCH DESIGN AND METHODSdIn total, 89 patients with type 1 diabetes from the Diabetes and Endocrinology Clinic and the Diabetic Neuropathy Clinic at the Toronto General Hospital were accrued as part of a cohort study funded by the Juvenile Diabetes Research Foundation (Operating Grant No. 17–2008–715). The larger objectives of the study are to identify the concurrent and predictive validity of CCM parameters in the cross-sectional identification of DSP and in the prediction of future DSP in longitudinal analysis. For comparison, an additional 64 healthy volunteers were recruited by community advertisement and by sampling among family and friends of diabetic subjects and accrued to ensure that the distribution of age (by decade of life) and sex was the same as for the type 1 diabetic subjects. The current report examines the cross-sectional data from examinations conducted between November 2008 and May 2010. The research ethics board of the Toronto General Hospital Research Institute approved the protocol and consent procedures. Selection of type 1 diabetic subjects The accrual strategy aimed to include type 1 diabetic subjects with a spectrum of nerve injury ranging from lack of detectable nerve injury to severe DSP. This was accomplished by way of stratified accrual according to the Toronto Clinical Neuropathy Score (TCNS), a validated grading system to evaluate history and physical exam components that permitted tracking of the number of subjects likely to have absent, mild, moderate, and severe neuropathy at the time of study accrual (5,20). We aimed to include at least 20 subjects in each of the four TCNS stages and continued subject accrual into the study until this was accomplished. Subjects were included if they had type 1 diabetes, were aged $18 years, provided informed consent, and did not have neuropathy attributable to causes 822
DIABETES CARE, VOLUME 35, APRIL 2012
other than diabetes. These causes were excluded by detailed medical history, family history of neuropathy, history of toxin exposure, renal failure, or presence of abnormal serum or urine protein electrophoresis. History of refractive surgery or contact lens use did not preclude participation. Current eye infection, recent histories of corneal abrasion, presence of severe movement disorder, or known allergy to proparacaine were exclusion criteria, although none of the screened subjects met these criteria. CCM examination As previously described (21), patients underwent bilateral examination of nerve fibers in the Bowman layer of the cornea using a 0.3-mm2 field-of-view lens on the Rostock Cornea Module of the Heidelberg Tomograph II (Heidelberg Engineering, Smithfield, RI) to produce a 0.3 mm 3 0.3 mm (384 pixel 3 384 pixel) digital image, with some differences in methodology as compared with a recently published protocol (22). The device is a laser-scanning confocal microscope that uses a visible 670-nm red wavelength diode laser source to highlight the area of the cornea being scanned for the examiner and to illuminate its structures. In brief, topical anesthetic and a viscous tear gel were applied to the eye to facilitate optical contact between the cornea and disposable cap on the objective lens of the CCM. Subjects fixed their gaze on a target positioned behind the CCM device and the examiner used a side-view digital video camera to ensure the apexdor the central areadof the cornea was scanned. The examiner manually focused the CCM lens on the subbasal nerve plexus in the Bowman layer of the cornea and captured the first in-focus high-contrast image. We used a volume scan to capture a set of 40 contiguous 0.3 mm 3 0.3 mm images from the cornea, beginning with the first superficial manually obtained image. Scans were recorded over a depth of 50 mm in 1.3-mm incremental steps during a 6-s automated protocol. The alternative modes are the section mode, which refers to capture of a single image without the subsequent incremental stepwise image capture, and the sequence mode, which permits capture of a movie of up to 100 images (22). Although it has not been determined which mode is most valid for research into DSP, realistically, the three methods have functional similarities: they all require the examiner to manually focus on nerve fibers and make a qualitative choice as to which fibers to capture (22). Compared with these alternative image acquisition
modes, the volume scan mode offered two putative methodological advantages (21): first, it shortened the duration of examination as it partially automated the process. Second, the semiautomated acquisition of many contiguous images may be advantageous for nonspecialized examiners. However, image quality may be limited by saccadic eye movements in comparison with the section and sequence modes. The procedure was repeated twice per eye, and 1 image was selected from the two sets of 40 images per eye during visual inspection by the examiner on postexamination analysis. The unblinded selection of this image was based on the combination of two qualitative criteriadmaximum technically sound features (the image most in focus and high contrast) and highest density of nerve fibers. The mean of the two images from contralateral eyes was taken to determine the values for CNFL, CNFD, CNBD, and TC. The parameters were measured using analytical software (CCMetrics Image Analysis tool v1.1 provided by Drs. R. Malik and M. Dabbah, University of Manchester) (23) and standardized per square millimeter of cross-sectional area of the Bowman layer. For determination of CNFL, the examiner manually traced over the nerve fibers and branches observed in the digital image (using a graphic pen tablet). The analysis tool provided an output of the number of pixels occupied by this tracing. We multiplied this value by the constant 0.78125 mm, representing the height and width of each pixel in the field, and divided by the constant 0.09 mm2, the area examined by the zeroed 300-mm field-of-view microscope lens to produce a CNFL value in millimeters per square millimeter. Although there is no established standard for the CCM protocol in DSP, other investigators recently have analyzed the average of three to five images per patient (15,17,24). Our protocol aimed to test an abbreviated, clinically generalizable version of the algorithm for the most conservative estimates of validity. In agreement with other investigators, we did not regard sampling of a single image as sufficient. Whether sampled from a patient’s single eye or also from the contralateral eye, we previously observed variability in measurement because two examinations could never be feasibly reproduced on precisely the same site of the cornea twice (21). As an example of this inherent variability, the side-to-side intraclass correlation coefficients for CNFD and CNFL were 0.51 and 0.67, respectively (21). care.diabetesjournals.org
Ahmed and Associates Table 1dClinical characteristics of the 64 healthy volunteers and the 89 type 1 diabetic subjects according to DSP status Type 1 diabetes (n = 89)
n Female sex, n (%) Age (years) Diabetes duration (years) Current/recent smoking, n (%) BMI (kg/m2) Height (m) Weight (kg) Systolic blood pressure (mmHg) Diastolic blood pressure (mmHg) HbA1c (%) Total cholesterol (mmol/L) LDL cholesterol (mmol/L) HDL cholesterol (mmol/L) Triglycerides (mmol/L) TCNS, median (IQR)‡ Nerve conduction parameters Sural nerve amplitude potential (mV) Sural nerve conduction velocity (m/s) Peroneal nerve amplitude potential (mV) Peroneal nerve conduction velocity (m/s) CCM parameters CNFD (fibers/mm2) CNBD (branches/mm2) CNFL (mm/mm2) TC (unitless)
Healthy volunteers
Control subjects without DSP
Case subjects with DSP
ANOVA P value for trend*
64 34 (53) 38.9 6 17.6 d 13 (21) 24.7 6 4.6 1.7 6 0.1 71.7 6 15.9
56 29 (53) 34.9 6 14.8 17.6 6 14.0 7 (13) 25.3 6 4.4 1.7 6 0.1 76.9 6 15.2
33 17 (52) 50.0 6 14.3 31.4 6 13.5 7 (21) 28.9 6 5.0 1.7 6 0.1 85.5 6 19.7
0.99 0.0001 ,0.0001 0.43 0.001 0.14 0.005
124 6 14
125 6 14
137 6 17
0.0001
76 6 11 5.5 6 0.4 4.9 6 1.1 2.9 6 0.8 1.5 6 0.5 1.1 6 0.6 0 (0–2)
71 6 8 7.4 6 1.3 4.6 6 0.8 2.5 6 0.7 1.7 6 0.4 0.9 6 0.7 2.5 (1.5–6)
73 6 9 8.7 6 2.1 4.6 6 1.6 2.4 6 1.1 1.6 6 0.5 1.2 6 0.9 10 (7–14)
0.01 ,0.0001 0.29 0.01 0.18 0.16 ,0.0001
18 6 8
11 6 5
262
,0.0001
51 6 5
46 6 4
40 6 3
,0.0001
662
662
261
,0.0001
48 6 3
43 6 3
36 6 5
,0.0001
43 6 11 35 6 14 18.4 6 4.4 20 6 9
39 6 10 29 6 16 16.7 6 4.3 17 6 5
28 6 9 17 6 12 11.1 6 3.6 19 6 9
,0.0001 ,0.0001 ,0.0001 0.16
Data are means 6 SD unless otherwise indicated. IQR, interquartile range. *P values for categorical variables were calculated with the x2 test, and ANOVA was used for continuous variables. ‡Scores of 0–5 are considered to represent low likelihood of DSP, 6–8 represent likelihood of mild neuropathy, 9–12 represent likelihood of moderate neuropathy, and 13–19 represent likelihood of severe neuropathy.
Akin to neurologic scoring systems for DSP in which right-to-left averages are taken (5), we chose the approach of averaging the results of two images taken from contralateral eyes. Recognizing the mathematical principle of regression to the mean (which states that as the number of averaged samples increases, the reproducibly of the test will inherently improve), we chose to limit sampling to two images to provide the most conservative estimates of validity. Classification of DSP case and control subjects DSP was established by published clinical and electrophysiological criteria (19). On care.diabetesjournals.org
the basis of this consensus, we defined electrophysiological abnormality according to the presence of at least one abnormal nerve conduction parameter in both dominant-side sural and peroneal nerve distributions using the Counterpoint instrument (Natus Medical Incorporated, San Carlos, CA) (6). We applied ageand height-adjusted criteria for sural and peroneal amplitudes and conduction velocities, which were scored as normal or abnormal according to laboratory reference values (25). Case definition of DSP required electrophysiological abnormality and the presence of .1 symptom (numbness, tingling, weakness, foot pain, or ataxia) or sign (abnormal knee or
ankle reflexes, temperature, light touch, monofilament, or vibration sensation), keeping with a distal symmetrical neuropathic pattern of onset and progression (26). Severity of DSP was defined according to the number of abnormal nerve conduction parameters. Mild, moderate, and severe DSP were defined by the presence of less than four, four, or greater than four lower-limb nerve conduction study abnormalities, respectively. Assessment of small fiber function Cooling detection threshold was obtained using the TSA-II NeuroSensory Analyzer (Medoc Ltd., Ramat-Yishai, Israel) and the method of limits as previously described (27). Axon reflex–mediated neurogenic vasodilatation in response to cutaneous heating by the laser Doppler imaging flare technique (LDIFLARE) was measured using the moorLDI2 (Moor Instruments Ltd., Axminster, U.K.), as previously described (28). The LDIFLARE area was calculated in centimeter squared using Moor LDI software (version 3.11). Sample size On the basis of previous observations in which the same clinical stratification method was used (5,20), we anticipated an allocation ratio of 1.4 (control subjects without neuropathy are expected to be recruited at a rate 40% higher than those with neuropathy). Using the methods for power calculation in receiver operating characteristic (ROC) analysis of Hanley and McNeil (29), to discriminate a conservatively modeled area under the curve (AUC) of 0.75 from the null hypothesis in which the diagnostic accuracy is no different from chance alone (AUC = 0.5), we required a total of 54 subjects (;20 subjects per three strata) under the assumptions of a type 1 error (a-level) of 0.05 and 95% power. We continued recruitment, which totaled 89, until the smallest stratum contained 20 subjects. This sample size provided sufficient power (.97%) to detect an association with 10 covariates in multiple regression analysis and permit exploration of interaction between two variables at a power of 94%. Statistical analysis Analyses were performed using SAS (version 9.1 for Windows). Differences in clinical categorical variables between DSP case and control subjects were assessed using the x2 test while continuous variables were assessed by Student t test. ROC curves were generated for each corneal DIABETES CARE, VOLUME 35, APRIL 2012
823
Corneal confocal microscopy and neuropathy nerve parameter to determine AUC and for inspection of the optimal threshold values for diagnosis of DSP. On the basis of previous work in DSP diagnosis (5,6), we planned to describe thresholds using two approaches: 1) the single threshold that concurrently optimized sensitivity and specificity, and 2) an alternative approach in which two threshold values were sought, one to maximize sensitivity and the other to maximize specificity, such that the negative likelihood ratio would approach 0.1 while the positive likelihood ratio would approach 10. Statistical testing to compare differences in AUC between CCM parameters was conducted based on the method of Pencina et al. (30). We reported the probability tables from the ROC logistic regression model of the parameter with maximal AUC, including positive and negative likelihood ratios. On the basis of the lack of a validation set, a bootstrap analysis was performed to establish 1,000 datasets, each produced by the random selection of 89 subjects with replacement. The mean and 95% CI of AUCs produced from the 1,000 datasets were calculated, and comparisons between parameters were made by the Student t test. Association of CCM parameters with measures of large and small fiber function were assessed by linear regression. RESULTSdAmong the 89 participants with diabetes, 33 (37%) met the case definition for DSP and 56 (63%) served as diabetic control subjects without DSP. As shown in Table 1, compared with the 64 healthy volunteers and the 56 diabetic control subjects without DSP, diabetic case subjects with DSP were generally older (ANOVA P for trend 0.0001) and had longer diabetes duration (P , 0.0001), higher BMI (P = 0.001) and weight (P = 0.005), and higher systolic blood pressure (P = 0.0001) than the diabetic control subjects without DSP or the healthy volunteers. Glycated hemoglobin A1c, the TCNS (a clinical indicator of the severity of nerve injury), and all of the nerve conduction study parameters showed incrementally higher levels across healthy volunteers, diabetic control subjects without DSP, and diabetic case subjects with DSP (ANOVA P for trend ,0.0001 for all variables). Furthermore, the TCNS score and nerve conduction study parameter distributions had substantial variability, indicating that the diabetic subjects represented subjects with a wide spectrum of clinical nerve injury. With the exception of TC, CCM parameters were 824
DIABETES CARE, VOLUME 35, APRIL 2012
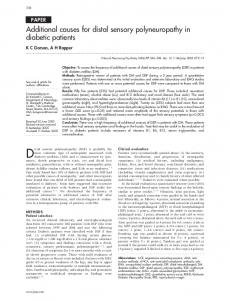
significantly lower across healthy volunteers, diabetic control subjects without DSP, and diabetic case subjects with DSP (ANOVA P for trend ,0.0001 for all variables, with the exception of TC). Figure 1 shows the ROC curve for the four CCM parameters among the type 1 diabetic subjects for the identification of DSP cases according to the clinical and electrophysiological criteria (19). CNFL had the greatest AUC of 0.88. To overcome the potential impact of outliers in the dataset, we performed bootstrap analysis to evaluate 1,000 datasets produced by repeated random selection. We found the mean estimate for AUC of CNFL was 0.88 (bootstrap analysis 95% CI 0.80–0.96). In comparison with the AUC for CNFL, CNFD showed an AUC of 0.84 (0.72– 0.94), CNBD showed an AUC of 0.73 (0.63–0.85), and TC showed an AUC of 0.55 (0.46–0.60). AUCs for each of these parameters were significantly lower than that of CNFL (P , 0.0001 for comparison of each of the three parameters with CNFL). To determine the threshold value that most closely approached the upper-left
corner of the ROC curves, we visually inspected the curves (Fig. 1) and compared them with the probability table generated by the logistic regression analysis inherent in the generation of the ROC curve (table not shown). From this, we identified a point on the ROC curve for CNFL that simultaneously maximized sensitivity and specificity (Fig. 1, indicated by the asterisk). This point corresponded to a CNFL value of #14.0 mm/ mm2 to rule in DSP, which represented sensitivity of 85%, specificity of 84%, and positive and negative predictive values of 76 and 90%, respectively. However, the positive likelihood ratio for this threshold value was 5.3 and the negative likelihood ratio was 0.18. We subsequently sought the thresholds that would approach positive likelihood ratios of 10 and 0.1 according to the generally accepted values for a clinically useful test threshold. For ruling in DSP, the threshold value of #11.5 mm/mm2 (Fig. 1, indicated by the double-dagger) was associated with specificity of 93%, positive predictive value of 83%, and positive likelihood ratio
Figure 1dROC curve for the identification of DSP by the four CCM parameters in the 89 subjects with type 1 diabetes. The curve representing the performance of CNFL is depicted by the solid black line. The AUC for CNFL was the largest among the CCM parameters (0.88). See text for estimates of AUC for each test and their statistical comparisons with CNFL. According to the first approach for determining threshold values for the diagnosis of DSP described in RESEARCH DESIGN AND METHODS, the single point on the CNFL curve with optimal operating characteristics had a sensitivity of 85% and a specificity of 84%, corresponding to a threshold value of 14.0 mm/mm2 (indicated by *). However, according to the second approach in which two threshold values were sought, the value 15.8 mm/mm2 (indicated by †) had a sensitivity of 91% for ruling out DSP with a negative likelihood ratio of 0.16, whereas the value 11.5 mm/mm2 (indicated by ‡) was associated with a specificity of 93% and a positive likelihood ratio of 8.5. care.diabetesjournals.org
Ahmed and Associates of 8.5. Conversely, for ruling out DSP, the threshold value of $15.8 mm/mm2 (Fig. 1, indicated by the dagger) was associated with sensitivity of 91%, negative predictive value of 91%, and negative likelihood ratio of 0.16. Use of this diagnostic interval was associated with 60 of 89 (67%) subjects classified as DSP case or control subjects by CNFL examination, whereas 29 of 89 (33%) subjects were left unclassified. To further explore the relationship of CNFL and DSP, we examined its distribution across a broad spectrum of nerve injury (Fig. 2). Subjects with type 1 diabetes had significantly lower CNFL than did healthy volunteers (t statistic = 4.84, P , 0.0001). As shown in Fig. 2 second to sixth box-and-whisker plots, among subjects with diabetes, CNFL had a significant, stepwise, inverse relationship with ordinal categories of increasing DSP severity (linear regression b = 21.96, P , 0.0001). Compared with healthy volunteers, diabetic control subjects without DSP and without subclinical sural nerve injury had no significant difference in CNFL (linear regression b = 20.01, P = 0.50), as shown in Fig. 2 first and second box-and-whisker plots. CNFL was lower among diabetic control
subjects without DSP but with subclinical sural nerve injury than in control subjects without such injury (linear regression b = 20.08, P = 0.05), as shown in Fig. 2 second and third box-and-whisker plots. Diabetic case subjects with DSP had substantially lower CNFL compared with diabetic control subjects without DSP (linear regression b = 25.64, P , 0.0001). Among case subjects with DSP, CNFL had an inverse relationship with increasing neuropathy severity (linear regression b = 21.53, P = 0.001), as shown in Fig. 2 fourth to sixth box-and-whisker plots. To illustrate the relationship of CNFL across healthy volunteers, diabetic control subjects without DSP, and diabetic case subjects with the three levels of DSP severity, we present representative images from these subgroups in Fig. 3. Diabetic case subjects with DSP are defined according to the number of abnormal nerve conduction parameters as described in the Fig. 2 legend. With respect to large fiber neuropathy measures, shorter CNFL (in millimeter per square millimeter) was associated with lower amplitude potentials (in microvolt) and slower conduction velocities (in meter per second) for both sural (linear regression b = 0.26, P , 0.0001, and b = 0.40,
P , 0.0001, respectively) and peroneal nerves (b = 0.65, P , 0.0001, and b = 0.45, P , 0.0001, respectively). Shorter CNFL (in millimeter per square millimeter) was also associated with lower cooling detect threshold (in degree Celsius) (linear regression b = 0.31, P , 0.0001) and smaller LDI FLARE area (in centimeter squared) (b = 0.82, P = 0.0007). CONCLUSIONSdIn the evaluation of a large cohort of type 1 diabetic subjects consisting of a wide spectrum of neuropathy severity, we found that CCM can be used as a proxy for the clinical and electrophysiological definition of DSP, as defined by consensus criteria using nerve conduction studies. The diagnostic performance of CNFL was very good, as indicated by a ROC AUC of 0.88, exceeding that of CNFD, CNBD, and TC. Furthermore, CNFL was associated with the existence of a single optimal threshold for ruling in DSP (at a quantitative level of #14.0 mm/mm2) that had good sensitivity and specificity (85 and 84%, respectively). Although indicating good diagnostic operating characteristics, we also investigated an alternative strategy that considers two separate thresholds for CNFLdone that
Figure 2dBox-and-whisker plots demonstrating the distribution of CNFL in 64 healthy volunteers and 89 type 1 diabetic subjects according to neuropathy status. Type 1 diabetic control subjects without DSP were divided into two groups based on the presence or absence of sural nerve conduction study abnormalities. Type 1 diabetic case subjects with DSP were divided into mild, moderate, and severe groups based on the presence of less than four, four, or greater than four lower-limb nerve conduction study abnormalities, respectively. care.diabetesjournals.org
DIABETES CARE, VOLUME 35, APRIL 2012
825
Corneal confocal microscopy and neuropathy
Figure 3dRepresentative images of CCM according to membership in the following groups: healthy volunteers (A), diabetic control subjects without DSP (B), and diabetic case subjects with varying DSP severity (C–E). TCNS scores of 0–5 are considered to represent low likelihood of DSP, 6–8 likelihood of mild neuropathy, 9–12 likelihood of moderate neuropathy, and 13–19 likelihood of severe neuropathy.
maximizes sensitivity (91% at $15.8 mm/ mm2) and another that maximizes specificity (93% at #11.5 mm/mm2). These measures translated into a positive likelihood ratio of 8.5 and a negative likelihood ratio of 0.16. This approach permitted the classification of the majority of subjects. The prevailing concept of the natural history of DSP highlights the importance of early preclinical small fiber damage, which can be detected by intraepidermal nerve fiber density acquired by skin punch biopsy. This test is generally regarded as the gold standard of small nerve fiber degeneration (9). However, the quantitative relationship between neuropathy status and severity with intraepidermal nerve fiber density is equivalently paralleled by corneal nerve fiber morphology measured by CCM (15). In view of this, CCM has been targeted in research as a noninvasive alternative to skin biopsy with studies that focus on practical aspects of its performance, 826
DIABETES CARE, VOLUME 35, APRIL 2012
including reproducibility (21,31) and concurrent validity (17). We report on the validity of CCM parameters to identify DSP that is defined by electrophysiologically based consensus guidelines (19). Our current analysis identifies nerve fiber tortuosity as a parameter with extremely poor concurrent validity for the identification of DSP. Instead, our analysis highlights the validity of CNFL. A previous concurrent validity study reports a similar optimal performance for CNFL as compared with the other parameters, but it also reports a substantially lower threshold CNFL value than in our analysis. That study defines DSP according to the Neuropathy Deficit Score (17,32,33), a clinical score determined by four physical examination maneuvers for the diagnosis of DSP. It could thus be predicted to produce a lower optimal threshold value for neuropathy diagnosis because the sensory and motor physical examination deficits that make
up an abnormal Neuropathy Deficit Score reflect more advanced stages of DSP than the definition that we operationalized according to electrophysiologically-based consensus guidelines. Alternatively, differences in the technique of image capture, selection, and analysis may account for the different threshold values obtained in the two studies. The determination of diagnostic thresholds for CNFL was an important objective of our study. Although we identify a single CNFL threshold value that discriminates DSP case from control subjects with good diagnostic operating characteristics, this approach may be an unrealistic expectation of a diagnostic test in clinical practice. For this reason, we also report the diagnostic strategy in which a range of values between two separate thresholds for CNFL were useddone that maximizes sensitivity and another that maximizes specificity. We hypothesize that individuals within a range of CNFL values (defined by care.diabetesjournals.org
Ahmed and Associates levels that are ;11.5–15.8 mm/mm2) represent individuals without clinically significant nerve damage to warrant a confident diagnosis of DSP. As such, these values may represent incipient or subclinical DSP and represent individuals at the highest risk of subsequent DSP onset. Although our data are generally corroborated by another concurrent validity study (17), we acknowledge limitations to the interpretation of our results. First, although we define diagnostic thresholds for CNFL, we acknowledge that sample size and measurement error limit the precision of these specific threshold values. Second, despite common features in the natural history and biology of DSP in type 1 and type 2 diabetes, further study is required to determine the relevance to type 2 diabetes. Third, we focused on the quantitative measurement of corneal nerve fiber morphology but not on its function, such as by the assessment of corneal sensitivity by noncontact corneal esthesiometry (34). Finally, we acknowledge that protocols that use fully automated image analysis will likely need to be adopted for this diagnostic test to be generalized into clinical practice (35,36). In view of the very good concurrent validity of CNFL, through longitudinal study, we hypothesize that it will have sufficient predictive validity to identify individuals who are at subsequent risk of developing clinically significant DSP. The clinical implication of this work is that CNFL could be harmonized as a clinical test applied to patients with diabetes during their annual retinopathy examinations performed by eye specialists. Because CNFL is a promising measure to quantify early and late phenotypes of DSP, it should be considered as an outcome for use in clinical trials investigating interventions for the prevention and treatment of DSP. AcknowledgmentsdThis research was supported by Juvenile Diabetes Research Foundation Grant 17-2008-715. A.A. is supported by a Charles Hollenberg Studentship from the Banting and Best Diabetes Centre. B.A.P. is a Canadian Diabetes Association Scholar. No potential conflicts of interest relevant to this article were reported. A.A. researched and performed statistical analysis of data, wrote the manuscript, and reviewed the manuscript for scholarly content and accuracy. V.B. created the study hypothesis and objective, designed the study, and reviewed the manuscript for scholarly content and accuracy. A.O., J.P., E.Y., and M.N. researched data. S.O. researched and performed statistical analysis of data and reviewed the care.diabetesjournals.org
manuscript for scholarly content and accuracy. B.A.P. created the study hypothesis and objective, designed the study, researched and performed statistical analysis of data, and reviewed the manuscript for scholarly content and accuracy. B.A.P. is the guarantor of this work and, as such, had full access to all the data in the study and takes responsibility for the integrity of the data and the accuracy of the data analysis. Parts of this study were presented in abstract form at the American College of Physicians Internal Medicine Conference in San Diego, California, 7–10 April 2011. References 1. Boulton AJ, Vinik AI, Arezzo JC, et al.; American Diabetes Association. Diabetic neuropathies: a statement by the American Diabetes Association. Diabetes Care 2005; 28:956–962 2. Dworkin RH, Malone DC, Panarites CJ, Armstrong EP, Pham SV. Impact of postherpetic neuralgia and painful diabetic peripheral neuropathy on health care costs. J Pain 2010;11:360–368 3. Ziegler D, Luft D. Clinical trials for drugs against diabetic neuropathy: can we combine scientific needs with clinical practicalities? Int Rev Neurobiol 2002;50:431–463 4. Harris SB, et al. Diabetes management in Canada: baseline results of the group practice diabetes management study. Can J Diabetes 2006;30:131–137 5. Perkins BA, Olaleye D, Zinman B, Bril V. Simple screening tests for peripheral neuropathy in the diabetes clinic. Diabetes Care 2001;24:250–256 6. Perkins BA, Orszag A, Ngo M, Ng E, New P, Bril V. Prediction of incident diabetic neuropathy using the monofilament examination: a 4-year prospective study. Diabetes Care 2010;33:1549–1554 7. Smith AG, Singleton JR. Impaired glucose tolerance and neuropathy. Neurologist 2008;14:23–29 8. Sumner CJ, Sheth S, Griffin JW, Cornblath DR, Polydefkis M. The spectrum of neuropathy in diabetes and impaired glucose tolerance. Neurology 2003;60:108–111 9. England JD, Gronseth GS, Franklin G, et al.; American Academy of Neurology. Practice parameter: evaluation of distal symmetric polyneuropathy: role of autonomic testing, nerve biopsy, and skin biopsy (an evidence-based review). Report of the American Academy of Neurology, American Association of Neuromuscular and Electrodiagnostic Medicine, and American Academy of Physical Medicine and Rehabilitation. Neurology 2009;72: 177–184 10. Rosenberg ME, Tervo TM, Immonen IJ, Müller LJ, Grönhagen-Riska C, Vesaluoma MH. Corneal structure and sensitivity in type 1 diabetes mellitus. Invest Ophthalmol Vis Sci 2000;41:2915–2921
11. Hossain P, Sachdev A, Malik RA. Early detection of diabetic peripheral neuropathy with corneal confocal microscopy. Lancet 2005;366:1340–1343 12. Malik RA, Kallinikos P, Abbott CA, et al. Corneal confocal microscopy: a noninvasive surrogate of nerve fibre damage and repair in diabetic patients. Diabetologia 2003;46:683–688 13. Oliveira-Soto L, Efron N. Morphology of corneal nerves using confocal microscopy. Cornea 2001;20:374–384 14. Quadrado MJ, Popper M, Morgado AM, Murta JN, Van Best JA. Diabetes and corneal cell densities in humans by in vivo confocal microscopy. Cornea 2006;25: 761–768 15. Quattrini C, Tavakoli M, Jeziorska M, et al. Surrogate markers of small fiber damage in human diabetic neuropathy. Diabetes 2007;56:2148–2154 16. Rózsa AJ, Beuerman RW. Density and organization of free nerve endings in the corneal epithelium of the rabbit. Pain 1982;14:105–120 17. Tavakoli M, Quattrini C, Abbott C, et al. Corneal confocal microscopy: a novel noninvasive test to diagnose and stratify the severity of human diabetic neuropathy. Diabetes Care 2010;33:1792–1797 18. Chang PY, Carrel H, Huang JS, et al. Decreased density of corneal basal epithelium and subbasal corneal nerve bundle changes in patients with diabetic retinopathy. Am J Ophthalmol 2006;142: 488–490 19. England JD, Gronseth GS, Franklin G, et al.; American Academy of Neurology; American Association of Electrodiagnostic Medicine; American Academy of Physical Medicine and Rehabilitation. Distal symmetric polyneuropathy: a definition for clinical research: report of the American Academy of Neurology, the American Association of Electrodiagnostic Medicine, and the American Academy of Physical Medicine and Rehabilitation. Neurology 2005;64:199–207 20. Bril V, Perkins BA. Validation of the Toronto Clinical Scoring System for diabetic polyneuropathy. Diabetes Care 2002;25:2048– 2052 21. Hertz P, Brill V, Orszag A, et al. Reproducibility of in vivo corneal confocal microscopy as a novel screening test for early diabetic sensorimotor polyneuropathy. Diabet Med 2011;28:1253–1260 22. Tavakoli M, Malik R.A. Corneal confocal microscopy: a novel non-invasive technique to quantify small fibre pathology in peripheral neuropathies. J Vis Exp 2011; (47):2194 23. Dabbah MA, Graham J, Petropoulos I, et al. Dual-model automatic detection of nerve-fibres in corneal confocal microscopy images. In Proceedings of the 13th International Conference on Medical Image Computing and Computer-Assisted Intervention: Part 1. DIABETES CARE, VOLUME 35, APRIL 2012
827
Corneal confocal microscopy and neuropathy
24.
25.
26.
27.
828
Beijing, China, September 2010. Berlin, Springer-Verlag, 2010 Messmer EM, Schmid-Tannwald C, Zapp D, Kampik A. In vivo confocal microscopy of corneal small fiber damage in diabetes mellitus. Graefes Arch Clin Exp Ophthalmol 2010;248:1307–1312 Oh SJ. Normal values for common nerve conduction tests. In Clinical Electromyography: Nerve Conduction Studies. Philadelphia, Lippincott Williams & Wilkins, 2003, p. 86–106 Shin TM, Bril V, Orszag A, Ahmed A, Perkins BA. How sensitive is the case definition for diabetic sensorimotor polyneuropathy to the use of different symptoms, signs, and nerve conduction parameters in type 1 diabetes? Diabetes Res Clin Pract 2011;92:e16–e19 Zinman LH, Bril V, Perkins BA. Cooling detection thresholds in the assessment of diabetic sensory polyneuropathy: comparison of CASE IV and Medoc instruments. Diabetes Care 2004;27:1674–1679
DIABETES CARE, VOLUME 35, APRIL 2012
28. Krishnan ST, Rayman G. The LDIflare: a novel test of C-fiber function demonstrates early neuropathy in type 2 diabetes. Diabetes Care 2004;27:2930–2935 29. Hanley JA, McNeil BJ. The meaning and use of the area under a receiver operating characteristic (ROC) curve. Radiology 1982;143:29–36 30. Pencina MJ, D’Agostino RB Sr, D’Agostino RB Jr, Vasan RS. Evaluating the added predictive ability of a new marker: from area under the ROC curve to reclassification and beyond. Stat Med 2008;27:157– 172; discussion 207–212 31. Efron N, Edwards K, Roper N, et al. Repeatability of measuring corneal subbasal nerve fiber length in individuals with type 2 diabetes. Eye Contact Lens 2010;36: 245–248 32. Abbott CA, Carrington AL, Ashe H, et al.; North-West Diabetes Foot Care Study. The North-West Diabetes Foot Care Study: incidence of, and risk factors for, new diabetic foot ulceration in a
33.
34.
35.
36.
community-based patient cohort. Diabet Med 2002;19:377–384 Young MJ, Boulton AJ, MacLeod AF, Williams DR, Sonksen PH. A multicentre study of the prevalence of diabetic peripheral neuropathy in the United Kingdom hospital clinic population. Diabetologia 1993;36:150–154 Pritchard N, Edwards K, Vagenas D, et al. Corneal sensitivity as an ophthalmic marker of diabetic neuropathy. Optom Vis Sci 2010; 87:1003–1008 Dabbah MA, Graham J, Petropoulos I, Tavakoli M, Malik RA. Dual-model automatic detection of nerve-fibres in corneal confocal microscopy images. Med Image Comput Comput Assist Interv 2010;13: 300–307 Dabbah MA, Graham J, Petropoulos IN, Tavakoli M, Malik RA. Automatic analysis of diabetic peripheral neuropathy using multi-scale quantitative morphology of nerve fibres in corneal confocal microscopy imaging. Med Image Anal 2011;15:738–747
care.diabetesjournals.org