sensor units and unpredictable environmental conditions. The rest of this ... algorithm based on clustering to detect outliers in wireless sensor ... the same time pi(t). Definition 4: .... As there were no outliers in the chosen IoT air quality dataset ...
ISSN (Online) 2394-2320 International Journal of Engineering Research in Computer Science and Engineering (IJERCSE) Vol 4, Issue 10, October 2017
Detection of outliers in the IoT data using the STCPOD model [1]
Mrs. I. Priya Stella Mary [2] Dr. L. Arockiam
Abstract - The Internet of Things (IoT) is the novel communication paradigm in which the internet is extended from the virtual world to interact with the objects in the physical world. Through this, an immense number of applications can be developed but at the same time, enormous challenges have to be dealt with to reap the benefits of the IoT. One such challenge is outlier detection in Internet of Things. Outlier detection is a process to detect the data that vary from the rest of the data based on a certain quantity. Outlier detection is very essential in Internet of Things to detect unusual behaviours, readings and events. In this paper, a novel STCPOD (Spatially and temporally correlated proximate Outlier Detection model) is proposed to deal with Outlier detection problem in IoT. Experimental results have proved that the proposed method has outperformed the existing STCOD model in terms of accuracy. Keywords — IoT, sensors, outliers
INTRODUCTION Sensors are the indispensable units in IoT. Since they are small and have low quality, they are subject to several limitations such as limited energy and memory resources, communication bandwidth and computational abilities. These limitations make sensor nodes to simply produce incorrect data [8]. So whenever the battery power is low, the probability of producing unusually high or low sensor values will raise promptly. Generally sensors are deployed in the harsh environmental conditions. These conditions inevitably lead to device malfunctions which in turn resulting in the generation of erroneous data. Besides sensor faults and noises, unusual sensor readings may also be caused by actual events (e.g. When a fire occurs in certain region where temperature sensors are deployed, the readings of all the sensors in and around the region will extremely increase). These are all some of the possible causes for the generation of unusual readings in the Internet of Things, often called outliers. An outlier detection technique is said to be efficient when it has high detection rate and low false alarm rate. False alarm rate denotes the number of normal sensor readings that are mistakenly considered as outliers. Outlier detection in IoT becomes essential in order to identify whether the unusual reading which has been detected represents either the measurement errors or interesting events. Due to enormous inadequacies in the existing outlier detection techniques for general data which could not be applied to outlier detection in IoT, the need arises for the development of new outlier detection techniques which take into account all the characteristics of IoT data while detecting outliers. More often sensor readings are spatially and temporally correlated. Outliers in IoT are unusual data that
significantly deviate from the previous readings of the current sensor or deviate from the readings of the proximate sensor nodes. In IoT, An outlier may be a sign of an error or an event. In general, an outlier is an observation that is significantly different from the other values in a data set. In the context of Internet of Things, outliers are the measurements that significantly differ from the normal pattern of sensed data. The raw data generated by IoT devices are often untrustworthy and imprecise due to several factors such as noise, defective sensor units and unpredictable environmental conditions. The rest of this paper is systematized as follows. In Section 2, an overview of related works is presented. Section 3 presents the proposed STCPOD (Spatially and temporally correlated proximate Outlier Detection model), in Section 4 the experiments conducted, demonstrate the efficiency of the proposed model in the IoT dataset and Section 5 concludes the paper. II.RELATED WORKS Ke Zhang et al. [1] presented a novel Local Distancebased Outlier Factor to quantify the outliers in distributed datasets. First the LDOF threshold has been set up and then the top-n outlier detection method was employed. The proposed method has detected the outliers with high precision even though the size of the neighbourhood is high. It was proved experimentally that the proposed method has outperformed the classical k nearest neighbour algorithm as well as Location outlier factor based outlier detection algorithm. Oussama Ghorbel et al. [2] have given an overview of prevailing outlier detection methods such as statistical based outlier detection methods, classification-based outlier detection methods, spectral decomposition based outlier detection methods developed specifically for the wireless sensor networks
All Rights Reserved © 2017 IJERCSE
1
ISSN (Online) 2394-2320 International Journal of Engineering Research in Computer Science and Engineering (IJERCSE) Vol 4, Issue 10, October 2017 and discussed the problem of outliers in wireless sensor networks. Min Wang et al. [3] proposed a spatially and temporally correlated outlier detection method to differentiate the faulty data from the outlier data so as to save energy and avert the deliverance of faulty data to the sink node. The performance of the proposed algorithm was tested through simulation using the OMNet++ platform. Experimental results proved that the proposed method has outperformed the existing majority voting algorithm and weight based voting algorithm for outlier detection. Kun Niu et al. [4] have presented a novel outlier detection algorithm based on clustering to detect outliers in wireless sensor networks. The proposed algorithm has detected the latent outliers through the clustering labels of time slots. Experimental outcomes proved the effectiveness and the strength of the proposed algorithm on real world wireless sensor data sets. Aymen Abid et al. [5] have proposed an outlier detector based on the distance between the current reading and its neighbours’ readings. The assessment was done by introducing random values into the Intel Berkley lab real world database. The proposed detector has detected outliers with high detection rate, low false alarm rate and great accuracy. Andradel et al. [6] have proposed an outlier detection methodology in wireless sensor networks by deploying the clustering and lightweight statistics techniques. It was proved that the proposed methodology has produced precise results even though the outliers were present in the data and also the accuracy and reliability of the analytical results were greatly improved. Oussama Ghorbel et al. 2014 [7] have proposed an enhanced kernel principal component analysis method based on Mahalanobis kernel to receive important feature for classification and to deter the abnormal events. Experimental results proved the efficiency of the proposed method when compared with the existing kernel principal component analysis method for wireless sensor networks. Manish Gupta et al. [9] have proposed Hodrick Prescott filters to lessen the noise and errors from the sensor data. Hodrick Prescott filters are mathematical tools to eliminate the cyclical component of time series data from the raw data. Experiments and analysis proved the efficiency of the proposed method when compared with the outcomes of other outlier detection techniques. Nauman Javed et al. [10] proposed an outlier detection technique which automatically derived a physical phenomenon model measured by sensors. This model compares sensor readings to detect outliers via spatial and temporal interpolation. The outlier detection technique utilized the statistical modelling of data to detect outliers
efficiently. The greatest advantage of the proposed outlier detection technique is that it was not domain-specific. III.METHODOLOGY Sensor nodes are usually placed in the harsh environment. While monitoring air quality, they are prone to generate faulty data and frequently tend to produce untrustworthy readings due to environmental interference and other quality problems [2]. To enhance the quality of sensor data, detection of outliers becomes the prime task to ensure reliability and accuracy and robustness of data. The proposed STCPOD model plays a vital role in detecting outliers at a faster rate to produce complete dataset. A. Spatial Temporal Correlation Detection Model (STCPOD)
Based
Outlier
The STCPOD model is described in detail. First of all to understand the proposed model, some definitions are given below. Definition 1: Similarity of sensor readings: Two sensor readings are said to be similar only when the similarity measure sim_mre is greater than or equal to the threshold (T) set. sim_mre(si(t), si(t-1)) ≥ T Similarity measure is computed using the following formula sim_mre(si(t),si(t-1)) = min (si(t), si(t-1))/max(si(t), si(t1)) Where si(t) - current sensor reading si(t-1)-preceding sensor reading Definition 2: Temporal correlation: A sensor node’s current reading si(t) has similarity with its preceding reading si(t-1). Definition 3: Spatial correlation: Two sensor nodes are said to be spatially correlated with each other only when one sensor node’s reading taken at time ‘t’ i.e. si(t) has similarity with the other sensor node’s reading taken at the same time pi(t) Definition 4: Outlier: An outlier occurs when a sensor node’s current reading si(t) has no similarity with its preceding reading si(t-1). STCPOD model comprises of three algorithms viz. Discover by self-learning algorithm (DSLA), Discover by
All Rights Reserved © 2017 IJERCSE
2
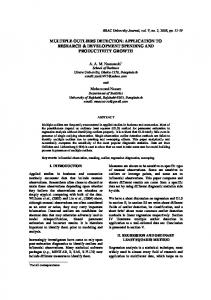
ISSN (Online) 2394-2320 International Journal of Engineering Research in Computer Science and Engineering (IJERCSE) Vol 4, Issue 10, October 2017 proximate sensors algorithm (DPSA) and Outlier determining algorithm (ODA). Detecting outliers that are extremely different from the remaining sensor data readings is a major challenge in the IoT environment. Existing outlier detection methods are unsuitable on IoT datasets due to the lack of spatial and temporal correlation consideration. STCPOD model is represented in the following figure 1.
STCPOD model IoT dataset
Extract
Target dataset
Discover by selflearning module
Discover by proximate sensors
Outlier determining algorithm
B. Discover By Self-Learning Algorithm(DSLA) When a sensor reading is fed into the Discover by selflearning algorithm, it determines whether the reading that has been fed is usual or not. In the Discover by selflearning algorithm, first the threshold is set up and then the similarity measure is calculated between the current reading si(t) and the preceding reading si(t-1). If the similarity measure is larger than the threshold set, it implies the readings are similar and the current reading si(t) is not an outlier. No action will be taken in this case. Whereas If the similarity measure is smaller than the threshold set, it implies the occurrence of unusual reading and so the current reading si(t) will be sent to the Discover by proximate sensors algorithm to determine whether it is an outlier or not. Discover by self-learning algorithm detects readings that appear to be extremely higher or lower than the rest of the sensor readings. Discover by self-learning algorithm Input: - current sensor reading si(t), preceding sensor reading si(t-1) Output: - returns whether si(t) is outlier or not. Step 1:- Set up the threshold (T) value Step 2:- Find the similarity measure between si(t) and si(t-1) (temporal correlation) sim_mre(si(t), si(t-1)) = min (si(t), si(t-1))/max(si(t), si(t1)) Step 3:- Compare the similarity measure with the threshold (T) set. If sim_mre >T then reading si(t) is normal, goto step(v) Otherwise go to step (iv) Step 4:- Call Discover by proximate sensors algorithm Step 5:- Proceed to check the subsequent sensor reading, until the final reading sn(t) is reached then go to step 5 Step 6:- Exit
module
Evaluate performance of STCPOD using
Outlier points
performance measures
C. Discover by Proximate Sensors Algorithm (DPSA) When the sensor node generates abnormal data, it can seek the help of its correlated proximate nodes to determine whether the sensor reading is an outlier or not. Outliers generated by a sensor can be detected through the proposed Discover by proximate sensors algorithm by making comparison with the proximate sensors readings, i.e. an unusual reading is compared with the correlated proximate sensor readings corresponding to time to determine whether it is an outlier or not.
Figure .1 STCPOD model
All Rights Reserved © 2017 IJERCSE
3
ISSN (Online) 2394-2320 International Journal of Engineering Research in Computer Science and Engineering (IJERCSE) Vol 4, Issue 10, October 2017
IV.RESULTS AND DISCUSSIONS
Discover by proximate sensors algorithm Input: - unusual sensor reading si(t), correlated proximate sensor reading pi(t) and threshold (T) Output: - returns score. Step 1:- Set up the threshold (T) value Step 2:- Find the n proximate sensors through Haversine formula using the geographical co-ordinates (spatial correlation) Step 3:- Find the correlation between the sensor readings with outliers and the n proximate sensors using the Pearson correlation co-efficient. Step 4: If the correlation is high among n proximate sensors, then go to step 5 otherwise go to step 9 Step 5:- Compare the unusual sensor reading si(t) with the readings of the highly correlated proximate sensor readings pi(t) corresponding to time. Step 6: Find the similarity measure between si(t) and pi(t) (spatial correlation) sim_mre(si(t), pi(t)) = min (si(t), pi(t))/max(si(t), pi(t)) Step 7: Compare the similarity measure with the threshold (T) set. If sim_mre >T Score=0 Else Score=1 End if Step 8: Return score to the sensor node that has sought proximate nodes’ assistance to determine the abnormal data. Step 9: Exit
D. Outlier Determining Algorithm (ODA) The outlier determining algorithm will decide whether the unusual sensor reading is an outlier or not after receiving scores from the correlated proximate sensor nodes. Outlier determining algorithm Input: - All scores from the correlated proximate sensor nodes, n- total number of correlated proximate sensor nodes Output: - Determine outlier or not Step 1:- Find majority score m_score = sum (score[i]) Step 2:- If n/2+1≤ m_score ≤ n then The reading is not an outlier; Else The reading is an outlier; send the reading to the sink node to flag that reading to determine whether it is an event or an interesting truth End if Step 3: Exit
The open source programming language R is used to implement the proposed STCPOD model. R provides a good environment to carry out statistical computing and graphics. The air pollution dataset used for this research work has been taken from city pulse smart city datasets collections. The data was sensed at 449 observation points. Among them, data sensed from five observation points was taken for this proposed work. Each dataset comprises of time-series data with 17569 instances. The sampling rate of each air quality sensor is 5 minutes. The dataset comprises of basic attributes such as time, sensor id to uniquely identify the sensors and observation attributes such as Ozone, Particulate Matter, Carbon Monoxide, Sulphur dioxide, Nitrogen dioxide. From the original dataset, the extracted target dataset comprises of the basic attributes time, sensor id, longitude, latitude to uniquely identify the sensors and only one observation attribute namely Carbon monoxide. Certain percentage of outliers was synthetically introduced into the dataset. The amount of outliers introduced into the dataset is five to fifteen percentage of the total number of observations. The efficiency of the proposed STCPOD model was evaluated through various metrics. For experimental purposes, only five sensor readings are taken into account for carrying out outlier detection. It is assumed that all five sensors have same communication range. It is also assumed that any one of the five sensors generates outliers due to environmental interference and other quality problems. A. Comparative Analysis of the Proposed Model with the Existing STCOD Model As there were no outliers in the chosen IoT air quality dataset, 5%, 10%, 15% of outliers have been synthetically introduced. The performance of the proposed algorithm is assessed using the following metrics [11] [12] (i) Outlier detection rate (ii) False alarm rate (i) Outlier detection rate The outlier detection rate refers to the ratio between the numbers of correctly identified outliers to the total number of true outliers.
Detection Rate
All Rights Reserved © 2017 IJERCSE
true positive true positive true negative
4
ISSN (Online) 2394-2320 International Journal of Engineering Research in Computer Science and Engineering (IJERCSE) Vol 4, Issue 10, October 2017
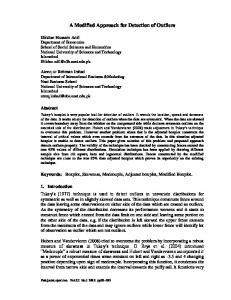
The outlier detection rate of the proposed method STCPOD model and the existing STCOD model is shown in the following figure 2.
Figure 3. False Alarm Rate V. CONCLUSION The objective of the proposed STCPOD model is to attain high detection rate and low false alarm rate. In the experimentation, it has been found that the detection rate of STCPOD model is much better than the existing STCOD model. It has been shown that the proposed model can detect outlier readings in the IoT data more efficiently than the existing STCOD model. Thus the proposed STCPOD model outperforms the STCOD apparently REFERENCES [1] Zhang, Ke, Marcus Hutter, and Huidong Jin. "A new local distance-based outlier detection approach for scattered real-world data", Advances in knowledge discovery and data mining, Vol. abs/0903.3257, 2009, pp. 813-822.
Figure 2. Outlier detection rate (ii) False Alarm rate False alarm rate is the ratio between the numbers of correct sensor readings that are misconstrued as outlier to the total number of alarms.
False Alarm Rate
[2] Ghorbel, Oussama, Mohamed Wassim Jmal, Walid Ayedi, Hichem Snoussi, and Mohamed Abid. "An overview of outlier detection technique developed for wireless sensor networks", In Systems, Signals & Devices (SSD), IEEE tenth International Conference, DOI: 10.1109/SSD.2013.6564165, 2013, pp. 1-6.
False Positive False Positive False Negative
The False alarm rate of the proposed method STCPOD model and the existing STCOD model is shown in the following figure 3.
[3] Wang, Min, and Zhongbo Wu. "Spatio-temporal correlation based outlier detection algorithm in sensor network", In Computer and Automation Engineering (ICCAE), IEEE Second International Conference, DOI: 10.1109/ICCAE.2010.5451639, Vol.4, 2010, pp. 424-427. [4] Niu, Kun, Fang Zhao, and Xiuquan Qiao. "An outlier detection algorithm in wireless sensor network based on clustering", In Communication Technology (ICCT), 15th IEEE International Conference, DOI: 10.1109/ICCT.2013.6820415, 2013, pp. 433-437. [5] Abid, Aymen, Abdennaceur Kachouri, and Adel Mahfoudhi. "Anomaly detection through outlier and neighborhood data in Wireless Sensor Networks", In Advanced Technologies for Signal and Image Processing (ATSIP), 2nd IEEE International Conference, DOI: 10.1109/ATSIP.2016.7523045, 2016, pp. 26-30. [6] Andrade, A. T. C., C. Montez, R. Moraes, A. R. Pinto, Francisco Vasques, and G. L. da Silva. "Outlier detection using k-means clustering and lightweight methods for Wireless Sensor Networks", In Industrial Electronics
All Rights Reserved © 2017 IJERCSE
5
ISSN (Online) 2394-2320 International Journal of Engineering Research in Computer Science and Engineering (IJERCSE) Vol 4, Issue 10, October 2017 Society, IECON, 42nd Annual Conference of the IEEE, DOI: 10.1109/IECON.2016.7794093, 2016, pp. 46834688. [7] Ghorbel, Oussama, Mohamed Abid, and Hichem Snoussi. "Improved KPCA for outlier detection in Wireless Sensor Networks", In Advanced Technologies for Signal and Image Processing (ATSIP), 1st IEEE International Conference, 2014, pp. 507-511. [8] Zhang, Yang, Nirvana Meratnia, and Paul Havinga. "Why general outlier detection techniques do not suffice for wireless sensor networks", Intelligent Techniques for Warehousing and Mining Sensor Network Data, 2009, pp.136-155. [9] Gupta, Manish, K. R. Krishnanand, Hoang Due Chinh, and Sanjib Kumar Panda. "Outlier detection and data filtering for wireless sensor and actuator networks in building environment", In Building Efficiency and Sustainable Technologies, IEEE International Conference , DOI: 10.1109/ICBEST.2015.7435872, 2015, pp. 95-100. [10] Javed, Nauman, and Tilman Wolf. "Automated sensor verification using outlier detection in the internet of things", In Distributed Computing Systems Workshops (ICDCSW), IEEE 32nd International Conference, DOI: 10.1109/ICDCSW.2012.78, 2012, ISSN: 1545-0678, pp. 291-296. [11] Thakran, Yogita, and Durga Toshniwal. "Unsupervised outlier detection in streaming data using weighted clustering." In Intelligent Systems Design and Applications (ISDA), IEEE 12th International Conference, Vol.6, No.11, 2012, pp. 947-952. [12] Abid, Aymen, Abdennaceur Kachouri, and Adel Mahfoudhi. "Anomaly detection through outlier and neighborhood data in Wireless Sensor Networks", In Advanced Technologies for Signal and Image Processing (ATSIP), IEEE 2nd International Conference, DOI: 10.1109/ATSIP.2016.7523045, 2016, pp. 26-30.
All Rights Reserved © 2017 IJERCSE
6