Eswaran et al. in 2002 [3], using a 151-channel noninvasive de- vice, known as the .... LA ROSA et al. ...... biology from the University of Montevallo, Mon- tevallo ...
IEEE TRANSACTIONS ON BIOMEDICAL ENGINEERING, VOL. 55, NO. 2, FEBRUARY 2008
453
Detection of Uterine MMG Contractions Using a Multiple Change Point Estimator and the K-Means Cluster Algorithm Patricio S. La Rosa*, Student Member, IEEE, Arye Nehorai, Fellow, IEEE, Hari Eswaran, Curtis L. Lowery, and Hubert Preissl
Abstract—We propose a single channel two-stage time-segment discriminator of uterine magnetomyogram (MMG) contractions during pregnancy. We assume that the preprocessed signals are piecewise stationary having distribution in a common family with a fixed number of parameters. Therefore, at the first stage, we propose a model-based segmentation procedure, which detects multiple change-points in the parameters of a piecewise constant time-varying autoregressive model using a robust formulation of the Schwarz information criterion (SIC) and a binary search approach. In particular, we propose a test statistic that depends on the SIC, derive its asymptotic distribution, and obtain closed-form optimal detection thresholds in the sense of the Neyman–Pearson criterion; therefore, we control the probability of false alarm and maximize the probability of change-point detection in each stage of the binary search algorithm. We compute and evaluate the relative energy variation [root mean squares (RMS)] and the dominant frequency component [first order zero crossing (FOZC)] in discriminating between time segments with and without contractions. The former consistently detects a time segment with contractions. Thus, at the second stage, we apply a nonsupervised K-means cluster algorithm to classify the detected time segments using the RMS values. We apply our detection algorithm to real MMG records obtained from ten patients admitted to the hospital for contractions with gestational ages between 31 and 40 weeks. We evaluate the performance of our detection algorithm in computing the detection and false alarm rate, respectively, using as a reference the patients’ feedback. We also analyze the fusion of the decision signals from all the sensors as in the parallel distributed detection approach. Index Terms—Autoregressive process, changepoint detection, magnetomyogram (MMG), uterine contraction.
I. INTRODUCTION HE analysis of uterine contractions during pregnancy is clinically important, especially predicting labor [1], [2]. Therefore, an automated method to detect uterine contractions
T
Manuscript received August 3, 2006; revised April 19, 2007. This work was supported by the NIH/NINDS and NIBIB under Grants 2 R01 NS36277-04A1 and 1 R33 EB000978. Asterisk indicates corresponding author. *P. S. La Rosa is with the Department of Electrical and Systems Engineering, Washington University in St. Louis, St. Louis, MO 63130 USA (e-mail: pla@ ese.wustl.edu). A. Nehorai is with the Department of Electrical and Systems Engineering, Washington University in St. Louis, St. Louis, MO 63130 USA (e-mail: nehorai @ese.wustl.edu). H. Eswaran and C. L. Lowery are with the Department of Obstetrics and Gynecology, University of Arkansas for Medical Sciences, Little Rock, AR 72205 USA. H. Preissl is with the Department of Obstetrics and Gynecology, University of Arkansas for Medical Sciences, Little Rock, AR 72204 USA and also with the MEG-Center, University of Tübingen, Tübingen D-72076, Germany. Color versions of one or more of the figures in this paper are available online at http://ieeexplore.ieee.org. Digital Object Identifier 10.1109/TBME.2007.912663
can be very helpful in the clinical evaluation of a patient. Uterine contractions can be described by their mechanical and electrophysiological aspects. Mechanical contractions manifest as the result of the excitation and propagation of electrical activity in the uterine muscle and appear in the form of an intrauterine pressure increase. Different techniques have been developed to quantify uterine contractions, such as tocography (TOCO), electrohysterogram (EHG) or electromyogram (EMG), and magnetomyogram (MMG). TOCO measures the strength of the uterine muscle exerted on the abdominal wall using an external mechanical method, and the contractions are recorded using tensometric transducers attached to the patient’s abdomen. This technique is attractive because it is noninvasive and simple, but it is of limited value due to its low sensitivity and accuracy [3]. The uterine EHG measures the action potentials of the myometrium cells using either internal electrodes or abdominal surface electrodes [1], [4]. This technique has a high temporal resolution and has captured more attention in the past decade, in particular for developing filtering techniques for noise and artifacts, as well as for time-frequency characterization of the EHG waveforms [1], [4]–[8]. However, because of differences in the conductivities of tissue layers, the uterine EHG signals get filtered during their propagation to the surface of the maternal abdomen. The uterine magnetomyogram (MMG) is a noninvasive technique that measures the magnetic fields associated with the action potentials. The first MMG recordings were reported by Eswaran et al. in 2002 [3], using a 151-channel noninvasive device, known as the superconducting quantum interference device array for reproductive assessment (SARA). The authors established the feasibility of recording uterine contractile activities with a spatial-temporal resolution high enough to determine localized regions of activation and propagation through the uterus. Unlike electrical recordings, magnetic recordings are independent of any kind of references, thus ensuring that each sensor mainly records localized activities. Hence, MMG seems to permit determining propagation patterns in the uterus [3]. Detection of uterine contractions has been performed in the past using a single EHG channel [6]–[9] and an array of MMG channels [10]. Among these references, we find time domain and multiresolution domain analysis. In the time-domain analysis, the uterine contractions are detected by applying a discrimination rule (threshold) on the values of a function (feature) evaluated on a sliding time window. For example, using EHG measurements, the authors in [11] discriminate the root mean square (RMS) values using an experimental threshold. In [6] the authors discuss the feasibility of using the first-order zero-
0018-9294/$25.00 © 2008 IEEE
454
IEEE TRANSACTIONS ON BIOMEDICAL ENGINEERING, VOL. 55, NO. 2, FEBRUARY 2008
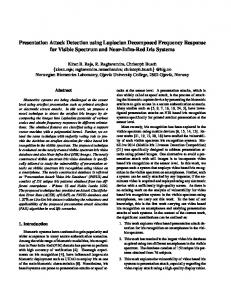
Fig. 1. Overview of the single channel processing scheme implemented to estimate uterine MMG contractions. On the left, a simplified illustration of the sensing array and the uterine MMG field. On the right, a functional block scheme of the proposed single channel detector.
crossing (FOZC) as a feature. However, no threshold for detection is provided. In [8], the authors discriminate the RMS values using an adaptive threshold level, determined by applying a median-moving average filter on an overlapping sliding window of EHG measurements. In [10] the authors propose to use the generalized synchronization index as an indicator of uterine contractions using an array of MMG channels. In a multiresolution analysis, a single EHG measurement is represented in a higher dimensional linear space, which is formed by decomposing the signal into several subspaces spanned by a set of basis functions [12]. For example, in [9] a single channel EHG measurement is decomposed using a set of biorthogonal wavelet functions and the contraction detected using a two-stage algorithm. In the first stage, the authors design a multivariable sequential cumulative likelihood ratio test to sequentially detect changes in the covariance matrix of the decomposed signal. Then, in the second stage, the diagonal parameters of the covariance matrices are classified using a neural network trained by an expert. As with the time-domain techniques, the segmentation stage of this multiresolution approach requires setting up a time window as well as a threshold level to detect changes in the parameters. Also, the basis functions (wavelets) are selected based on the average performance obtained in the classification stage. One common restriction of the above techniques is that the time-window length as well as the threshold level is determined experimentally based on a particular data set. In general the selection of the time-window length depends on the length of the shortest event to be detected, the global detection delay, and the number of samples required to properly estimate the hypothesis parameters [9]. Therefore, the detection performance might change from patient to patient because of, for example, differences in the pregnancy stage, tissue conductivities, etc. In this paper, we propose a single channel two-stage timesegment discriminator of uterine magnetomyogram (MMG)
contractions during pregnancy. At the first stage, we propose a model-based segmentation procedure, which detects multiple change-points in the parameters of a piecewise constant time-varying autoregressive model using a robust formulation of the Schwarz information criterion (SIC) and a binary search approach. This novel segmentation technique does not require the use of a sliding window as in previous work. In particular, we propose a test statistic that depends on the SIC, derive its asymptotic distribution, and obtain closed-form optimal detection thresholds in the sense of the Neyman–Pearson criterion; therefore, we control the probability of false alarm and maximize the probability of change-point detection in each stage of the binary search algorithm. Then, at the second stage, we apply the nonsupervised K-means cluster algorithm to classify each time segment using the RMS and FOZC as candidate features. Finally, we provide a discrete-time binary decision signal indicating the presence of a contraction. We validate our method using real MMG measurements and compare the detected time intervals with the patients’ feedback. Since each single channel detector provides local information regarding the presence of a contraction, we also analyze the fusion of the decision signals from all the sensors as in the parallel distributed detection approach. As we illustrate with real data, this approach proves to be helpful in understanding the uterine MMG contraction activity spatially and temporally. Fig. 1 illustrates the uterine MMG field, the sensing array, and the proposed single channel scheme to estimate the contraction intervals. This work is organized as follows: in Section II we present the model-based time-domain segmentation method and analyze its performance; in Section III we define the feature space and describe the classification method; we discuss the performance of our algorithm using real MMG data in Section IV, and summarize our results in Section V.
LA ROSA et al.: DETECTION OF UTERINE MMG CONTRACTIONS USING A MULTIPLE CHANGE POINT ESTIMATOR
II. MODEL-BASED TIME-DOMAIN SEGMENTATION , be the samples of an MMG meaLet surement acquired from a position close to the abdominal surface of the patient, where is the number of total samples. Let for , , be the preprocessed measurement, where is a function defined over the MMG samples. In our case, represents the downsampling following by a bandpass filtering. Using the central limit theorem we assume that the distribution of the preprocessed samples’ amplitudes is Gaussian with unknown mean and variance. Also, as shown in [13], [14], EMG measurements can be considered as a series of stationary segments with Gaussian distributed amplitudes. Therefore, we design a time-series segmentation algorithm that detects multiple change points in the distributions parameters. A. Detection Principle The statistical problem of segmentation can be formulated as follows: Assume that (i) is a piecewise stationary real process so that there exist instants such that is stationary . Also, assume that the probability distribution of the samples between and belongs to the same family of distributions where are the unknown parameters. Then our problem consists of detecting changes in the distribution of , associated to changes in . Therefore, we apply a statistical test looking for changes in . Usually the statistical inference about change points has two aspects: the first is to detect if there is any change in the sequence of random variables observed, and the second is to estimate the number of change points and their corresponding locations. In particular, the statistical inference of the change-point problem consists of testing the following hypotheses: (1) (2) where is the unknown parameter vector, is the unknown number of the change points, and are the unknown positions of the change points. Therefore, our . Note problem is to estimate the set of change points that in our case, we assume that all the data are available and thus our detection approach is offline or at best, with a delay of . The problem of detecting multiple change points has been addressed by means of a binary segmentation procedure in [15], [16]. Essentially, this approach simplifies the general problem by evaluating iteratively the alternative hypothesis of detecting a single change point in the parameter. It can be described as follows: First, detect a single change. If there is no change, then the null hypothesis is accepted. If there is a change, then the estimated change point divides the original sequence into two subsequences. For each subsequence, detect a change as in the first step, and continue the process until no more changes can be found in any of the subsequences. Using the above approach, the alternative hypothesis becomes (3)
455
Here we estimate the change point using the Schwarz information criterion (SIC)1 [18], which is defined as (4) where is the likelihood function of the samples, is the maximum likelihood estimation of assuming a change point at sample , and is the number of unconstrained parameters in the model under of (3), with . The case corresponds to the situation without change point, thus, and . The SIC has been applied in [16] to estimate the change points of the variance of a normal distribution. They preferred using the SIC over the AIC, because the minimum of SIC among the possible models has been proved to be an asymptotically unbiased estimator of the model order of the true model [16], [18], which makes this criterion appropriate for designing a change point test [16]. Hence, or is based on the principle of minthe decision to accept imum information criterion. This means that is accepted if and is rejected if for some . In the latter case the change point is estimated by such that (5) where is the SIC under , is the SIC under for , and is the total number of unconstrained parameters under . Note that is constrained to the set so we can compute the maximum likelihood estimates of the parameters, and . The SIC approach for testing change points does not require resorting to the distribution of the test statistic [16] as in the classical testing procedures, such as the generalized likelihood ratio test. If the SIC values are very close, then it is of interest to test if this difference is caused by data fluctuation when there is actually not change. To avoid misleading change-point detections, in [16] a robust SIC-based change-point detector is proposed. We will derive a test for the same purpose but based on a time-varying AR-model of the preprocessed measurements . B. AR-Modeling Based Segmentation using a stable Assume that we model the time series autoregressive (AR) model of fixed known order , with timevarying coefficients; driven by a zero-mean white Gaussian be process with time-varying variance. Let the sequence of preprocessed measurements. Then (6) or equivalently (7) where , and
, , is a zero-mean
1SIC is a modification of the Akaike information criterion (AIC) proposed by Akaike in 1973 [17].
456
IEEE TRANSACTIONS ON BIOMEDICAL ENGINEERING, VOL. 55, NO. 2, FEBRUARY 2008
Gaussian process with variance lowing hypothesis
. Then, we test the fol-
parameter) as a function of given by the
in (4) with
, we have
(8) (9) is unknown, where is the unknown number of change points, and are the unknown instants of the change points. Hence, our problem is to estimate the set of change . Accordingly, using the binary search procepoints dure, the alternative hypothesis becomes
(14) Under , considering a change point at time , we obtain the likelihood function as
(15) where
(10) , . We approxLet imate the likelihood function of the samples under both hysamples conditioned on the potheses by considering the initial values. This approximation allows us to obtain closed form solutions for the maximum likelihood estimates of the parameters and reduce the computational complexity of the algorithm. Therefore, under , the approximate likelihood function is given by
(16) and
(17) Then, applying natural logarithm to (15), we have
(11) Then the approximate log likelihood is
(18)
(12) with
where , and
with . Then, the maximum likelihood estimates and are obtained by equating to zero and , respectively, the derivatives of (12) with respect to and are given by
(13) Now, replacing the concentrated likelihood (i.e., the likelihood function written, when possible, as a function of a particular
where the maximum likelihood estimates , and and by (13) by substituting
and are given are given by
(19) Then replacing the concentrated likelihood as a function of and in (4) with , we have the is given as follows:
(20)
LA ROSA et al.: DETECTION OF UTERINE MMG CONTRACTIONS USING A MULTIPLE CHANGE POINT ESTIMATOR
and the change point
is estimated by
such that (21)
Then, for improving the robustness on detecting a change-point, the hypothesis is accepted when , where is a threshold value to be determined. Let be the test statistic defined as
(22) Then
or
is accepted if (23)
Hence, if we know the probability function of , we using, for example, the can determine an optimal Neyman–Pearson criterion as follows: (24) where is the significance level of the test. One possibility to determine the probability distribution of under would be to estimate it empirically (histogram) using Monte Carlo simulations. However, the test statistic depends on the sample size, which is not fixed, and it also depends on the binary search procedure, therefore, we would have to compute a histogram for all possible sample sizes, which is unpractical. Here, for , we obtain and apply an approximation under as follows (see Appendix A of the distribution of for details on the derivation):
457
. The constant depends on the where sample size , the significance level , and the number of pathen the given segment rameters . Note that, if is not tested for changes and is accepted. The binary search is accepted for procedure is finalized when the hypothesis all time segments. Remark: Here, we derived a robust SIC change-point test to detect changes in the distribution of the preprocessed mea. In particular, we assumed that the preprocessed surements samples are modelled by a piecewise time-varying autoregressive (AR) model of order with input given by a white Gaussian noise with time-varying variance. We also consider the special case assuming that the AR model order is zero, and thus is a sequence of independent zero-mean normal random variables. in (6). 1) Special Case: Assume that is a sequence of indepenThen dent zero-mean normal random variables with parameters . Hence, our problem is reduced to looking for changes in the variance of a sequence of independent normal random variables. Similarly, the multiple and change-point problem is given by (8) with is the alternative hypothesis becomes as in (10). The SIC for (30) and for
is
where tors under problem is
and
(31) , , and are the maximum likelihood estima, respectively. The test statistic for this
(32) (25) where (26) (27)
is given by (25) with the approximate distribution of under , and the approximate threshold value is . in (6) 2) Model Order Estimation: The model order is typically unknown and needs to be estimated. A possible information criterion approach to estimate the model order is by minimizing the overall SIC, which is the SIC computed on using the estimated change points for a given set of values. It is given by
and
(28) Therefore, applying the above approximation in (24) we have that and are related as follows:
(29)
(33) where , is the maximum likelihood estiusing the estimated change points mate of and assuming a model order . Therefore, can be estimated by (34)
458
IEEE TRANSACTIONS ON BIOMEDICAL ENGINEERING, VOL. 55, NO. 2, FEBRUARY 2008
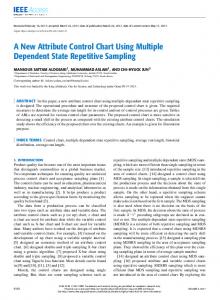
Fig. 2. (a) Computed probability of false alarm (P ) and asymptotic P as a function of for n = 100 and n = 1000 samples. (b) Receiver operating characteristic (ROC) for different change points. (c) ROC for different � values. (d) ROC for different sample sizes.
C. Performance Analysis theory,2
we analyze Using terminology from signal detection the performance of the change-point detector by computing the and the probability of false alarm probability of detection . of our problem is given by (35) and
is (36)
is the threshold that defines the decision regions. where as follows: Using (25) we approximate
(37) To analyze as a function of , we plot the receiver operating characteristic (ROC), which is a parametric plot of versus . We compute the and as a function of for a sample size equal to 100 and 1,000, and using 1,000 Monte Carlo simulations. Fig. 2(a) illustrates the computed through Monte Carlo simulations and the using (37). As expected, when the sample size increases, the given by (37) approaches the computed numerically, and both decrease their values as increases. depends on , , , and . For The test statistic under , . Then, we the purpose of analysis, we set 2In signal detection theory the probability of a type I error is called the probability of false alarm (P ), whereas the probability of a type II error is called the probability of a miss (P ). The quantity 1 P is the probability of detection (P ).
0
study the sensitivity of ROC for different combinations of , , and . Fig. 2(b) shows the ROC curves for , , and . As intuitively expected, it can be seen , the increases as the change point apthat for a given decreases proaches the middle of the time segment and the when the change points are towards the end points of the time segment. The latter occurs because of the poor performance (higher variance) of the maximum likelihood estimate obtained from the shorter segment due to the reduced number of samples. As a consequence, the presence of a change point might pass unnoticed when is small. For example, in Fig. 2(c) we observe , , , and a given that for value, the increases with . Finally, in Fig. 2(d) for , , , and a given , we cannot as increases. observe significant differences between the and for , we study the estiNext, under , where mation bias (detection delay) . In our setup , i.e., we can expect negative delays. Note that in a sequential detection setup a negative delay will be considered as a false alarm. Here, we are interested in studying the mean value of the detection delay (38) We compute (38) using 1000 Monte Carlo simulations. in (38) Fig. 3(a) and (b) illustrates the average value of , as a function of the change point , in (a) for , ; and in (b) for , , . As expected, the average delay decreases for larger values. Also, for change points near the origin of the time segment, the expected delay is large compared
LA ROSA et al.: DETECTION OF UTERINE MMG CONTRACTIONS USING A MULTIPLE CHANGE POINT ESTIMATOR
459
Fig. 3. (a) Average value of the detection delay as a function of the change point for n = 100, � = 0:01, and � = 1, 2, and 4. (b) Average value of the detection delay as a function of the change point for n = 100, � = 2, and � = 0:005, 0.01, 0.02, and 0.03. (c) Probability of detection (P ) as a function of the change point for n = 100, � = 0:01, and � = 1, 2, and 4. (d) P as a function of the change point for n = 100, � = 2, and � = 0:005, 0.01, 0.02, and 0.03.
with the one obtained for change points located near the center of the time window. As a reference in Fig. 3(c) and (d), we respectively. Note that for a given , illustrate the for change points at the end of the window is smaller the than the for change points in the center. Therefore, if is over a large number of change large enough, then points and the expected delay is approximately uniform over the same range of change points. So far we have provided a statistical segmentation technique based on some prior knowledge of the data distribution. In par, is piecewise ticular, we have assumed that belongs stationary and that the probability distribution of to same family , with piecewise constant timevarying parameters. A uterine contraction time segment can be modelled by several piecewise stationary processes. In our ap, proach, this means that it can be modeled by a subset of therefore, we need to define features that characterized each such that we are able to classify the time segments that belongs to a uterine contraction. In the next section we describe the candidate features and the K-means cluster algorithm. III. CLASSIFICATION The classification of each detected time segment is based on the values of certain features. In general, a classification problem requires the definition of an appropriate feature space and a classification algorithm. In this section we introduce the RMS and FOZC as candidate features for discriminating whether a time segment belongs to a uterine contraction or background activities. We describe the K-means cluster algorithm to discriminate the feature values. Then, we define the
binary decision signal and introduce the criterion to evaluate the performance of detection. A. Candidate Features be the time index Let sequence of the estimated change points and we define . The samples of a time segment are de. Let fined by , be a vector that contains and . Let the samples between the change points , , be the mapping function, where and is the total number of feature is associated with the particular mappings. The selection of application. In our case, in order to detect uterine contractions, ’s such that their values differentiate a we need to find uterine contraction from background activity coexisting in the same frequency bandwidth and time segment of analysis. In [6], [11] the application of RMS and FOZC have been effectively used to discriminate uterine contractions in EHG measurements. Uterine contractions have been shown to appear as high amplitude variations in the recorded MMG [3]. Thus it is intuitively reasonable to evaluate RMS and FOZC as features in MMG recordings, defined as follows: of a sample vector is defined as 1) RMS:
(39)
460
IEEE TRANSACTIONS ON BIOMEDICAL ENGINEERING, VOL. 55, NO. 2, FEBRUARY 2008
2) FOZC: is the first-order count of the number of zero crossings on the time series in a given time segment [19]. It is given by
and the For example, if the total number of clusters is total number of time segments detected is equal to 2, so we only have two features values to be classified, then no classification is performed and it is assumed that there is not contraction in the measurements. C. Cluster Labelling and Binary Decision Signal
(40) and denotes the sign where if , and 0 otherwise. function defined as In general, zero crossing analysis is an effective tool for modeling the spectral characteristic of stochastic processes [19] and it has been applied for signal detection and estimation [19]. For example, in [6] the authors show that the FOZC is applicable in detecting uterine contractions in EHG measurements. In particular, the dominant frequency principle [19] says that the normalized expected zero-crossing rate , which is a weighted average of the spectral mass, tends to admit values in the neighborhood of a significantly dominant frequency. Therefore, it is a practical way to discriminate changes in spectrum between time segments. B. Classification Algorithm To discriminate the features we use the K-means clustering algorithm [20], which classifies the time segments into groups based on a set of features (RMS or FOZC, or both). K-means is one of the simplest unsupervised learning algorithms (although it requires a priori ) that solve the well-known clustering problem. This algorithm finds a partition in which objects within a cluster are as close to each other as possible, and as far from objects in other clusters as possible. The centroid of each cluster is the point to which the sum of the distances from all objects in that cluster is minimized. The grouping is done by minimizing the criterion , which is the sum of the squared distances between the feature vectors and the corresponding cluster centroid
An advantage of the K-means cluster algorithm is that it is a nonsupervised data classification technique. However, in order to interpret the results, namely clusters labelling, it is required to have certain knowledge of the feature space. In this sense, for example, if the RMS is used as a feature, then we might expect the centroid with largest RMS value to be labelled as a contraction. Similarly, if the FOZC is used, we might assign as a contraction the centroid with lowest FOZC value. In practice, as we discuss in the experimental results section, the feasibility of discriminating a uterine contraction using the RMS and FOZC depends also on the segmentation stage. be the set of clusters labels, Let is the label assigned arbitrarily by the classiwhere fication algorithm to a resulting cluster. Also, let be the set of clusters assigned as a contraction based on a certain is classified as a criterion. Therefore, a time segment contraction if its feature . Then, the binary deciis defined as follows: sion signal if otherwise where
(42)
.
D. Performance Evaluation Let , be the binary reference signal according, indicates for example, to the patient’s feedback, i.e., the presence of a contraction at sample . Then, we evaluate the performance of the detection algorithm by computing the detection ratio (DR), false alarm ratio (FAR), and correlation coefficient (CORR) which are defined as follows:
(41) (43) for is the time-segment feature vector, is the centroid for the cluster, is the total number of clusters fixed a priori, is the Euclidean distance. The minimization of is and performed using an iterative algorithm, which essentially moves objects between clusters until the sum cannot be decreased further. The algorithm is briefly described as follows [21]: the first step consists in selecting randomly time-segment feature vectors from the population. These features represent initial centroids. At the second step, it assigns each features to the clusters that has the closest centroid. After all the features have been assigned, as a third step, the positions of the centroids are recalculated. The second and third steps are repeated until the centroids no longer move. Note that if the number of segments is less than the number of cluster , then no classification can be performed and we assume that not contraction has taken place. where
if
or (44)
The DR computes the percentage of agreements in detection and for given the total numbers between . The FAR of time-samples with contractions according to computes the percentage of disagreements in detection (false and for given the total numalarm) between . bers of time-samples without contractions according to and The CORR indicates how similar is the sequence in the time interval .
LA ROSA et al.: DETECTION OF UTERINE MMG CONTRACTIONS USING A MULTIPLE CHANGE POINT ESTIMATOR
461
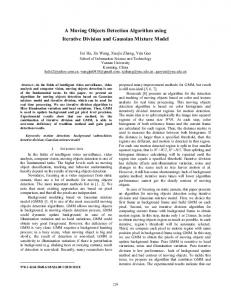
Fig. 4. (a) SARA system installed at the University of Arkansas for Medical Sciences (UAMS) Hospital. (b) 151-channel sensor array embedded under the concave surface upon which the patient leans her abdomen. The sensors coils are placed 3 cm apart, covering a total area of approximate 1350 cm . (c) Diagram of sensor array with channels identification numbers. The complete circles indicate the groups of channels G1, G2, and G3, and the dotted circles indicate the group of channels G4.
IV. EXPERIMENTAL RESULTS In this section we show the performance of the proposed detection scheme using real MMG data. In particular we evaluate the performance of the pre-segmentation techniques as well as the discrimination capabilities of RMS and FOZC. Also, we analyze the fusion of the decision signals from all the sensors as in the parallel distributed detection approach, allowing us to study the temporal and spatial distribution of the uterine contraction activities.
TABLE I DATASET SUMMARY
A. Data Acquisition and Preprocessing The uterine MMG recordings were obtained using a 151-channel magnetic field sensor array system named SARA3 (SQUID Array for Reproductive Assessment). SARA is a passive, stationary, floor-mounted instrument at which the patient sits and leans her abdomen against the concave surface which contains the array of sensors [Fig. 4(a)]. The sensor array covers a region of approximately 45 cm high and 33 cm wide, inclined at 45 . Fig. 4(c) shows with a surface of 1300 a view of the 151-channel array embedded under the concave surface upon which the patients leans her abdomen. The whole system is in a three-layer magnetically shielded room (MSR) and is equipped with high-order synthetic gradiometer noise cancellation, which effectively eliminates the vibrational noise transmitted by the mother. Recordings were performed on ten patients who presented themselves in the labor and delivery unit complaining of contractions, having gestational age ranging from 31 to 40 weeks. Table I illustrates the individual gestation ages of the patients used in this study. The recording session was 10 min long with a sampling rate of 250 Hz. The records also contain an additional channel that registers the beginning and end of the contraction according to the patient’s feedback, which we used here to evaluate the performance of our method. Note that the perception of contraction by the mother, is limited, because it is well known, that this subjective report is not exact. 3SARA was built in collaboration with VSMMedTech Ltd., Canada and is installed at the University of Arkansas for Medical Sciences (UAMS) Hospital.
However, if a mother reports contraction, we can be assured that a contraction occurred. In this respect, we may miss some contractions, but it can be assured that the reported contractions are real ones. We remove the presence of artifacts, such as fetal and maternal magnetocardiogram MCG and maternal breathing, by first downsampling the data to 5 Hz and then applying a bandpass filter focusing on the primary uterine magnetic activity. The primary magnetic activity of a uterine contraction is represented by a low frequency typically between 0.1 and 0.4 Hz [10], [22]. The MMG activity in this range likely represents the plateau and repolarization phase of the action potentials [10], [22]. Note that the biomagnetic signal includes also possible contribution from motions of the fetus or intestines. However based on the investigated frequency band, the contribution of these is limited and in addition there is no hypotheses of their occurrence during contractions. In Fig. 5 we illustrate the normalized power spectral density (PSD) computed using the Welch’s method on samples of channels 2, 50, and 120 obtained from six different patients. The PSDs are computed using all samples from the 10 min of measurements of each patient, thus, containing contractions. We choose these above channels (sensor positions) for illustrating three different abdominal areas. Fig. 4(c) illustrates the spatial location of the selected channels. We choose three pairs of patients at 38, 39, and 40 weeks of pregnancy, respectively. It
462
IEEE TRANSACTIONS ON BIOMEDICAL ENGINEERING, VOL. 55, NO. 2, FEBRUARY 2008
Fig. 5. Power spectral density (PSD) computed using the Welch’s method on samples of channels 2, 50, and 120 obtained from six different patients with gestational age between 38 and 40 weeks.
can be seen that we cannot distinguish a common PSD pattern among the different patients. Therefore, we study the performance of the detection algorithm in the frequency ranges given by 0.1 to 0.4 Hz, and 0.2 to 0.4 Hz, looking for and adequate band range that maximizes in average the detection of contractions. In each case, we apply equiripple FIR bandpass filters to the downsampled measurement, with lower and upper pass freand , respectively, given by the limits of quency limits the frequency ranges defined above. The upper and lower stop and , respectively, frequencies are . The gains in the pass and stop band are conwith strained to 0 dB and 60 dB, respectively, and the maximum allowed ripple in both bands is 0.05 dB. B. Model Order Estimation, Feature Evaluation and Cluster Labelling The segmentation stage requires the estimation of the model order , which can be estimated, for example, using the approach proposed in Section II-B2. In practice, we found that this approach performed well only in a portion of channels, while in the remaining part, it did not lead to a good performance. Namely, in channels with visible presence of contractions we obtained that has a large value and it the model order that minimized the did not lead to detection of changes. However, we also found that for all the channels the number of change points detected tends to decrease as the model order increases. Therefore, in practice, the model order can be thought as a resolution parameter in terms of the number of change points detected. We evaluated, the discriminating capabilities of the RMS and FOZC by computing them on the time segments detected in both
and with significance value frequency ranges for . We found that the RMS is a good candidate feature to discriminate between time segments with and without contractions according to the patient’s feedback. In particular, we found that in both frequencies ranges of analysis the time segments with contractions usually have larger RMS values than time segments without contractions. In the case of the FOZC, we were not able to find a consistent pattern for discrimination. One possible reason might be the reduced length of some estimated time segments specially when a contraction is taking place. Therefore, in our examples below we use the RMS as a feature to identify the presence of a contraction in a particular time segment. Assuming that the preprocessed records in the analyzed frequency ranges contain only the presence of uterine contractions, then RMS values are related to the energy evolution of the burst of uterine activities. Therefore, if we divide the RMS value into three groups, the largest values of RMS correspond to the peak phase of the burst of activities, the second larger ones correspond to the rising and falling phase, and the smallest values represent the resting state. Using the assumption above, we classify the RMS values in all the examples below using the K-means at three. cluster algorithm by fixing the number of clusters Thus, we label as a contraction the time segments during which RMS values belong to the two clusters with largest centroids. In practice, we observed that the RMS values are more likely to be classified in three groups rather than two, specially due to the presence of large RMS values or peaks. In this sense the classification using only two groups assigns centroids around the peaks, and as a consequence, very often assigns the middle level RMS values as background noise.
LA ROSA et al.: DETECTION OF UTERINE MMG CONTRACTIONS USING A MULTIPLE CHANGE POINT ESTIMATOR
463
Fig. 6. Bandpass filtered records from channel 2 of patient 6 with a gestational age of 40 weeks: (a) preprocessed channel with grid lines indicating the estimated change points for d = 1 and � = 0:01; (b) RMS in each time segment; (c) FOZC in each time segment; (d) cluster groups using RMS features; (e) estimated contractions segments; (f) time segments with contractions according to the patient feedback.
As an example, we illustrate in Fig. 6 the records from channel 2 of patient 6 at 40 weeks of pregnancy, bandpass filtered between 0.2 and 0.4 Hz. Fig. 6(a) shows the downsampled and filtered signals. The vertical grid lines indicate the estimated change points according to an AR model with order and . We choose since, as we discuss in the next subsection, the detection methods achieves in average the maximum DR and CORR in the given frequency range. It can be seen that the number of change points estimated increases at the time intervals when the patient indicates the presence of a contraction. This observation suggest that the samples that belongs to the contraction interval might be modelled by an AR model with a larger model order. Fig. 6(b) and (c) illustrates the RMS and FOZC computed on the estimated time segments. In general we observe that in this frequency range the FOZC does not identify the presence of a contraction very well according to the patient’s feedback. Fig. 6(d) shows the cluster groups obtained after applying the K-means algorithm on the RMS values. The cluster labels are given in ascending order according to the centroid RMS values, i.e. label 3 is the centroid with largest RMS value. Fig. 6(e) shows the binary decision amplified by 1.2 times the maximum value of the signal preprocessed measurements. In this case, the RMS values that belongs to the two clusters with largest centroids values were classified as a contraction. Fig. 6(f) illustrates the time-intervals which the patient acknowledged the presence of a contraction. C. Performance Analysis and Discussion We evaluate the DR, FAR, and CORR of the detector algorithm in ten patients in four group of channels defined in Table I. We select the groups according to their relative position in the
array. Fig. 4(c) illustrates the array with the selected group of channels. Table II illustrates the average and standard deviation of DR, FAR, and CORR computed in each group of channels G1, G2, G3, and G4 for the ten patients used in this study, for with . The case , assumes that the mean of the process is zero, therefore, we look for changes in variance. Here, to simplify our analyzes below, we apply the same value to all channels from the same patient. From the results obtained, the detector performance with respect to the frequency band and with respect to the sensor positions. We observe that the maximum average DR and average CORR are achieved consistently in all groups of channels for equals to 0 and 1, in the frequency range 0.2–0.4 Hz. Also, in the same frequency range for , 1, the lowest average FAR are obtained in the group of channels G1. We obtain that in the frequency range 0.1–0.4 Hz, the maximum average DR and average CORR are obtained for , 3. Note that we have to consider that each single channel detector decides the presence of a contraction based on local spatial information; thus a detection classified as FA might be indicating the occurrence of a burst of activity in the myometrium; however its power and surface distribution might not be sufficient to be detected by the patient. Therefore, we also analyze the temporal-spatial detection of the sensor array by fusing the decision signals as in the parallel distributed detection approach. In particular, we illustrate the percentage of active sensors as a function of time, which is the result of adding all binary decision signals, obtained from processing every channel, normalized by the total number of channels. Also, in each sensor, we compute the RMS on the time segment estimated as contraction and we illustrate the total RMS as function of time. This approach proves to be helpful
464
IEEE TRANSACTIONS ON BIOMEDICAL ENGINEERING, VOL. 55, NO. 2, FEBRUARY 2008
TABLE II AVERAGE DR, FAR, AND CORR COMPUTED ON MEASUREMENTS FROM CHANNELS G1, G2, G3, AND G4
in understanding the uterine MMG contraction activity spatially and temporally. As an example, in Fig. 7 we illustrate the total RMS and the percentage of active sensors as a function of time for patients 1, 5, and 6 using and in the frequency band 0.2 to 0.4 Hz. The time interval of a contraction according to the patient’s feedback is indicated by the high level of the pulse train in each figure, respectively. The pulse amplitude is just for purposes of illustration. In the case of patient 5 we only detect the first two contractions. Interestingly, we found that the power variation associated to the other three contractions are detectable in the frequency band 0.4 to 0.45 Hz (see the PSD of patient 5 in Fig. 5). We also observed that in patient 6, the maximum agreement in detection as well as in RMS values coincided with the starting point of 3 contractions over the 5 evidenced in this graph according the patient’s feedback. However, comparison against the intrauterine pressure measures is required in order to quantify the above observations. We also illustrate the spatial and temporal distribution of the activity detected based on each sensor decision in the frequency band 0.2 to 0.4 Hz. In Fig. 8, we illustrate the snapshots of the re-
constructed measurement surface for patient 6 using the array of measurements , , which are the preprocessed measurements masked with their corresponding binary decision signals. The time interval illustrated contains a contraction, based on patients’ feedback between 246 and 286 s (see also Fig. 7, patient 6). It can be seen that the maximum number of activated sensors occurs between the time snapshots of 252 to 260 s. It is interesting to note that the percentage of activated sensors increases from 15% to 80% in 3 s just a couple of seconds before the patients starts acknowledging the presence of a contraction. On the other hand, the percentage of activated sensors decreases from 85% to 50% in 25 s. This difference might lead us to the conclusion that the contractions rise faster than they fall in terms of spatial distribution; however, we could not generalize such observation in other contraction segments in the same patient. V. CONCLUSION In this paper we have developed a general analysis approach for the detection of uterine MMG contractions. In particular, we proposed a two-stage statistical time-segment discriminator
LA ROSA et al.: DETECTION OF UTERINE MMG CONTRACTIONS USING A MULTIPLE CHANGE POINT ESTIMATOR
465
Fig. 7. From left to right: total RMS and percentage of active sensors as a function of time for patients 1, 5, and 6. The time interval of a contraction according to the patients’ feedback is indicated by the high level of the pulse train in each figure, respectively. Note that the pulse amplitude is just for purpose of illustration.
Fig. 8. Snapshots of the reconstructed measurement surface from patient 6 masked with the binary decision signals in the frequency band 0.2 to 0.4 Hz. The time selected coincides with the presence of contraction, according to the patient’s feedback.
using a single channel of MMG measurements. We assumed that the preprocessed channels are modeled by a piecewise timevarying AR model of a certain order with input given by a white Gaussian noise with time-varying variance. Therefore, we first designed a statistical model-based segmentation algo-
rithm based on the SIC to estimate the time-instants of changes in the parameters. To discriminate time segments that contain a contraction, we evaluated features such as the time segment power (RMS) and the dominant frequency component (FOZC). Then, we applied the nonsupervised cluster algorithm K-means
466
IEEE TRANSACTIONS ON BIOMEDICAL ENGINEERING, VOL. 55, NO. 2, FEBRUARY 2008
to classify the RMS values, obtaining then a discrete-time binary decision signal indicating the presence of a contraction. The detection of multiple change points is performed using a binary search algorithm; therefore, the problem is simplified by testing the hypothesis for a single change point. In this work, using the asymptotic distribution of the test statistics based on SIC, we obtained optimal thresholds in the sense of the Neyman–Pearson criterion; therefore, we controlled the probability of false alarm and maximized the probability of change-point detection in each stage of the binary search algorithm. We also proposed an estimate of the model order . However, in practice, this approach performed well only in a group of channels from the same patient, suggesting that a different model for segmentation should be attempted. For example, allowing for time segments with piecewise constant time-varying model orders to avoid over segmentation. We applied our detection algorithm to real MMG records obtained from ten patients with gestational ages between 31 and 40 weeks, who were admitted to the hospital for contractions. We found that the RMS values discriminate the presence of time segment with contractions. However, that result was not obtained in the case of the FOZC values. We evaluated the performance of our detection algorithm by computing the DR, FAR, and CORR, respectively, using as a reference the patient’s feedback. We observed that the maximum average DR and average CORR are achieved consistently in all groups of channels for equals to 0 and 1, in the frequency range 0.2–0.4 Hz. Also, in the same frequency range for , 1, the lowest average FAR are obtained in the group of channels G1. We obtain that in the frequency range 0.1–0.4 Hz, the maximum average DR , 3. Thus, in average, and average CORR are obtained for a variance based algorithm is suitable to detect contractions using the RMS values. Since each single channel detector provided local information, regarding the presence of a burst of activities, we also analyzed the fusion of the decision signals from all the sensors as in the parallel distributed detection approach. This approach proved helpful in understanding the uterine MMG contraction activity both spatially and temporally. In further studies we will address the optimization of the detection by evaluating additional features of the preprocessed measurements. We will also develop a biomagnetic compatible pressure measurement device for a better recording of the intrauterine pressure and provide a more precise approach to validate the performance of our method with real measurements, as well as, to allow for comparison with other methods. APPENDIX DETERMINATION OF FOR THE SIC CHANGE POINT DETECTOR BASED ON AN AR-MODEL Let [23] showed that the asymptotic distribution of
, where . is given by
(45)
where
Let
. Then, . Thus
(46) Hence, using (45)
(47) Then, solving for
(48) ACKNOWLEDGMENT The authors are grateful to Dr. C. Muravchick, Dr. N. Cao, and the anonymous reviewers for their helpful comments that improve the quality on this work. REFERENCES [1] J. Gondry, J. Duchene, and C. Marque, “First results on uterine EMG monitoring during pregnancy,” in Proc. Ann. Int. Conf. IEEE EMBS, 1992, vol. 6, pp. 2609–2610. [2] H. Eswaran, H. Preissl, J. D. Wilson, P. Murphy, and C. Lowery, “Prediction of labor in term and preterm pregnancies using non-invasive magnetomyographic recordings of uterine contractions,” J. MaternalFetal Neonatal Med., vol. 190, pp. 1598–1603, 2004. [3] H. Eswaran, H. Preissl, J. D. Wilson, P. Murphy, S. Robinson, and C. Lowery, “First magnetomyographic recordings of uterine activity with spatial-temporal information with 151-channel sensor array,” Amer. J. Obstetrics Gyn., vol. 187, pp. 145–151, 2002. [4] D. Devedeux, C. Marque, D. Mansour, S. Germain, and J. Duchene, “Uterine electromyography: A critical review,” Amer. J. Obstetrics Gyn., vol. 169, pp. 1636–1653, 1993. [5] J. Duchene, D. Devedeux, D. Mansour, and C. Marque, “Analyzing uterine EMG: Tracking instantaneous burst frequency,” IEEE Trans. Eng. Med. Biol. Mag., vol. 14, pp. 125–132, 1993. [6] N. Radhakrishnan, J. D. Wilson, C. Lowery, H. Eswaran, and P. Murphy, “A fast algorithm for detecting contractions in uterine electromyography,” IEEE Eng. Med. Biol. Mag., vol. 19, pp. 89–94, Mar./Apr. 2000. [7] K. Horoba, J. Jezewski, J. Wrobel, and S. Graczyk, “Algorithm for detection of uterine contractions from electrohysterogram,” in Proc. 23rd Int. Conf. IEEE EMBS, 2001, pp. 461–464.
LA ROSA et al.: DETECTION OF UTERINE MMG CONTRACTIONS USING A MULTIPLE CHANGE POINT ESTIMATOR
[8] J. Jezewski, K. Horoba, A. Matonia, and J. Wrobel, “Quantitative analysis of contraction patterns in electrical activity signal of pregnant uterus as an alternative to mechanical approach,” Physiol. Meas., vol. 26, pp. 753–767, Jul. 2005. [9] M. Khalil and J. Duchene, “Uterine EMG analysis: A dynamic approach for change detection and classification,” IEEE Trans. Biomed. Eng., vol. 47, pp. 748–756, Jun. 2000. [10] C. Ramon, H. Preissl, P. Murphy, J. D. Wilson, C. Lowery, and H. Eswaran, “Synchronization analysis of the uterine magnetic activity during contractions,” Biomed. Eng. Online, vol. 4:55, 2005, 10.1186/ 1475-925X-4-55. [11] J. Ramondt, C. van Kooten, A. Verhoeff, and H. Wallenburg, “Computer analysis of mechanical and electrical uterine activity,” Med. Biol. Eng. Comput., vol. 24, pp. 351–355, 1986. [12] S. Mallat, “A theory for multiresolution signal decomposition: The wavelet representation,” IEEE Trans. Pattern Anal. Machine Intell., pp. 674–693, Jun. 1989. [13] J. Duchene and F. Goubel, “Surface electromyogram during voluntary contraction: Processing tools and relation to physiological events,” Critical Rev. Biomed. Eng., vol. 21, pp. 313–397, Jun. 1993. [14] G. Inbar, J. Allin, O. Paiss, and H. Kranz, “Monitoring surface EMG spectral changes by the zero crossing rate,” Med. Biol. Eng. Comput., vol. 31, p. 597, 1984. [15] L. J. Vostrikova, “Detecting ‘disorder’ in multidimensional random processes,” Soviet Math. Doklady, vol. 24, pp. 55–59, 1981. [16] J. Chen and A. K. Gupta, “Testing and locating variance changepoints with applications to stock,” J. Amer. Stat. Assoc., vol. 92, pp. 739–747, June 1997. [17] H. Akaike, “Information theory and an extension of the maximum likelihood principle,” in Proc. 2nd Int. Symp. Information Theory, B. N. Petrov and B. A. K. E. Csaki, Eds., 1973, pp. 267–281. [18] G. Schwarz, “Estimating the dimension of a model,” Annals Stat., vol. 6, pp. 461–464, Mar. 1978. [19] B. Kedem, “Spectral analysis and discrimination by zero-crossings,” Proc. IEEE, vol. 74, pp. 282–304, Nov. 1986. [20] J. MacQueen, “Some methods for classification and analysis of multivariate observations,” in Proc. 5th Symp. Math. Stat. Probab., Berkeley, CA, 1967, no. 1, pp. 281–297. [21] C. M. Bishop, Neural Networks for Pattern Recognition. Oxford, U.K.: Oxford Univ. Press, 1995. [22] R. Nagarajan, H. Eswaran, J. D. Wilson, P. Murphy, C. Lowery, and H. Preissl, “Analysis of uterine contractions: A dynamical approach,” J. Maternal-Fetal Neonatal Med., vol. 14, pp. 8–21, Mar. 2003. [23] R. A. Davis, D. Huang, and Y. Yao, “Testing for a change in the parameter values and order of an autoregressive model,” Ann. Stat., vol. 23, pp. 282–304, Feb. 1995.
Patricio S. La Rosa (S’03) received the B.Sc. degree in engineering and completed the electrical civil-industrial engineering program from the Pontifical Catholic University of Chile (PUC), Santiago, in 1999 and 2000, respectively, the M.Sc. degree (with maximum distinction) in electrical engineering from University of Chile, Santiago, in 2003, and is working toward the Ph.D. degree at Washington University, St. Louis, MO. His research interest are in statistical signal processing and its applications to biomedicine and sensor arrays. Mr. La Rosa received the John Paul II Foundation scholarship between the years 1995 and 2000 for undergraduate studies in engineering sciences at PUC.
Arye Nehorai (S’80–M’83–SM’90–F’94) received the B.Sc. and M.Sc. degrees in electrical engineering from the Technion-Israel Institute of Technology, Haifa, and the Ph.D. degree in electrical engineering from Stanford University, Stanford, CA. From 1985 to 1995, he was a faculty member with the Department of Electrical Engineering, Yale University. In 1995, he joined the Department of Electrical Engineering and Computer Science, The University of Illinois at Chicago (UIC), as a Full Professor. From 2000 to 2001, he was Chair of the de-
467
partment’s Electrical and Computer Engineering (ECE) Division, which then became a new department. In 2001, he was named University Scholar of the University of Illinois. In 2006, he became Chairman of the Department of Electrical and Systems Engineering, Washington University, St. Louis, MO. He is the inaugural holder of the Eugene and Martha Lohman Professorship and the Director of the Center for Sensor Signal and Information Processing (CSSIP) at WUSTL since 2006. He is the Principal Investigator of the new multidisciplinary university research initiative (MURI) project entitled Adaptive Waveform Diversity for Full Spectral Dominance. Dr. Nehorai has been a Fellow of the Royal Statistical Society since 1996. He was co-recipient of the IEEE SPS 1989 Senior Award for Best Paper, coauthor of the 2003 Young Author Best Paper Award and co-recipient of the 2004 Magazine Paper Award. He was elected Distinguished Lecturer of the IEEE SPS for the term 2004 to 2005 and received the 2006 IEEE SPS Technical Achievement Award. He was Editor-in-Chief of the IEEE TRANSACTIONS ON SIGNAL PROCESSING during the years 2000 to 2002. In the years 2003 to 2005, he was Vice President (Publications) of the IEEE Signal Processing Society, Chair of the Publications Board, member of the Board of Governors, and member of the Executive Committee of this Society. From 2003 to 2006, he was the Founding Editor of the special columns on Leadership Reflections in the IEEE SIGNAL PROCESSING MAGAZINE.
Hari Eswaran received the B.S. and M.Sc. degrees in physics (electronics) from the University of Delhi, Delhi, India, the M.S. degree in physics (acoustics) from the University of Mississippi, Oxford, and the Ph.D. degree in applied sciences from University of Arkansas at Little Rock. He is currently an Assistant Professor and SARA Laboratory Director with the Department of Obstetrics and Gynecology, University of Arkansas for Medical Sciences, Little Rock. His area of research is focused on biomedical instrumentation with special emphasis on fetal monitoring instrumentation. His areas of research include, evoked potentials, magnetoencephalography, electro and magnetomyography, acoustics, signal processing, and electronics.
Curtis L. Lowery received the B.S. degree in biology from the University of Montevallo, Montevallo, AB, in 1977 and the M.D. degree from the University of Alabama at Birmingham School of Medicine, Birmingham, in 1981. He is currently a Professor and Director of the Division of Maternal-Fetal Medicine, Department of Obstetrics and Gynecology, University of Arkansas for Medical Sciences, Little Rock. He has an active collaboration with the Graduate Institute of Technology of the University of Arkansas at Little Rock since 1993 and oversees research projects of graduate students. Areas of interest include noninvasive antepartum surveillance involving superconducting quantum interference device technology, specifically fetal magnetoencephalography, magnetomyography of the gravid uterus, and fetal magnetocardiography. Other areas of interest include percutaneous umbilical blood sampling for prenatal diagnosis and medical management.
Hubert Preissl received the Diploma in physics and the Ph.D. degree in physics, both from the University of Tübingen, Tübingen, Germany, in 1988 and 1994, respectively. He was with the Max-Planck Institute for Biological Cybernetics, Tübingen, until 1994. He then joined the Institute for Medical Psychology and Behavioral Neuroscience, University of Tübingen. In 1997, he became an Assistant Professor with the MEG Center, Tübingen. In addition, since 2000, he has been a Project Director with the SARA-Lab, University of Arkansas for Medical Sciences, Little Rock. His major research interests are application of MEG in developmental neuroscience, investigation of interaction of neuronal and endocrinological networks and analysis of biomagnetic signals.