Methylation of CEs in target organs is ultimately responsible for decreased formation of 2-methoxyestradiol, a strong antiangiogenic and anticancer agent and ...
ANTICANCER RESEARCH 29: 4131-4138 (2009)
Determinants of Homocysteine Levels in Colorectal and Breast Cancer Patients P. FERRONI1, R. PALMIROTTA1, F. MARTINI1, S. RIONDINO1, A. SAVONAROLA1, A. SPILA1, F. CIATTI1, V. SINI2, S. MARIOTTI2, G. DEL MONTE3, M. ROSELLI2 and F. GUADAGNI1 1Department
of Laboratory Medicine and Advanced Biotechnologies, IRCCS San Raffaele Pisana, 00163, Rome; 2Department of Internal Medicine, Medical Oncology, University of Rome “Tor Vergata”, Tor Vergata Clinical Center, 00133, Rome; 3San Raffaele Rocca di Papa, 00040, Rocca di Papa, Rome, Italy
Abstract. Background: Homocysteinemia has been associated with oncogenic risk. This study was designed to investigate the homocysteine (Hcy) genotype/phenotype interactions together with the inflammatory and nutritional status of cancer patients. Patients and Methods: The Hcy levels were analyzed in 47 cancer patients in association with methylenetetrahydrofolate reductase (MTHFR) polymorphisms, folate and inflammatory markers. Results: The MTHFR C677T and A1298C genotype distributions did not differ from those predicted by the Hardy-Weinberg distribution. Conversely, the Hcy levels were higher in the cancer patients (p=0.04), who were also characterized by low-grade inflammation. The Hcy levels correlated with the interleukin-6 (IL-6) (p=0.001), tumor necrosis factor-α (TNF-α) (p=0.042) and folate (p1.5 mg/dl) or renal (creatinine level >1.5 mg/dl) function, Karnofsky performance status lower than 90% , concurrent therapy with anti-folate drugs, or medications known to influence homocysteine levels (thus interfering with the genotype/phenotype correlation study), such as current or recent use of a folate or vitamin B12 supplement or of any multivitamin preparation; current or recent use of drugs interfering with homocysteine levels (i.e. anticonvulsants, methotrexate and penicillamine). Informed consent was obtained from all the subjects. The study was performed under the appropriate institutional ethics approvals and in accordance with the principles embodied in the Declaration of Helsinki. Sample collection and laboratory analysis. Blood samples from the cancer patients were drawn within 1 week before surgery, or prior to neoadjuvant chemotherapy and/or irradiation. All the patients attended the clinic on an outpatient basis at 8:00 a.m. After an overnight fast and a rest period of at least 20 min, the blood samples were drawn without stasis, from the antecubital vein using a 20 G needle and either non-anti-coagulated, for serum recovery, or anti-coagulated in Na citrate 3.8% (1:9, v:v) or in ethylenediaminetetraacetic acid (EDTA), for plasma separation. The EDTA-containing vacuum tubes were kept on ice and in the dark for tHcy (which refers to the sum of homocysteine, homocystine, and homocysteine-cysteine mixed disulfide, free and protein bound) analysis. The EDTA-anti-
4132
coagulated whole blood samples for the DNA analyses were immediately frozen at –80˚C until processing; EDTA plasma was separated within 90 min. For serum preparation the blood was allowed to clot and then centrifuged at 2000 g for 10 min at 4˚C. The serum samples were either immediately analyzed for vitamin B12 and folate levels or aliquoted, coded and stored at –80˚C for batch analysis for interleukin-6 (IL-6), TNF-α and high-sensitivity C reactive protein (hs-CRP). Citrated plasma was obtained by centrifugation at 2000 xg for 10 min at 4˚C and immediately analyzed for fibrinogen levels. The storage conditions were carefully maintained and all the aliquots were limited to one freeze-thaw cycle, thus ensuring no decline of antigen values due to long-time storage as previously demonstrated (14). The MTHFR 677C¡T and 1298A¡C polymorphisms were investigated in DNA samples extracted from the whole blood by a MagNA Pure LC instrument and total DNA isolation kit I (Roche Diagnostics, Mannheim, Germany) using real-time polymerase chain reaction-based assay kits LC DNA Master Hybridization Probes and LC Fast Start DNA Master Hybridization Probes (Roche Diagnostics) performed on a LightCycler 2.0 (Roche Diagnostics). Quantitative vitamin B12 and plasma folate levels were measured by chemiluminescent microparticle immunoassays on an Architect i2000 instrument (Abbott Laboratories, Abbott Park, IL, USA). The hs-CRP levels were assayed by quantitative immunoturbidimetric ultrasensitive determination on an Architect c8000 instrument (Abbott Laboratories). The plasma tHcy and fibrinogen levels were assayed on an ACL TOP automated coagulometer (Instrumentation Laboratory (IL) Co, Lexington, MA, USA). The serum proinflammatory cytokine (IL-6 and TNF-α) levels were measured by enzyme-immunometric assays (R&D Systems, Minneapolis, MN, USA) according to the manufacturers’ instructions. All the samples were assayed in duplicate and those showing values above the standard curve were re-tested with appropriate dilutions. Both the biochemical and mutation analyses were conducted blind as to whether a sample came from a cancer or cancer-free subject. Statistical analysis. The allelic frequencies were estimated by gene counting and the genotypes were scored. The observed numbers of each MTHFR genotype were compared with that expected for a population in Hardy-Weinberg equilibrium. Differences between percentages were assessed by Chi-square test. Student’s unpaired ttest, Anova test and Pearson Product moment correlation analysis were used for the normally distributed continuous variables. Appropriate non-parametric tests (Mann Whitney U-test, KruskalWallis ANOVA and median test and Spearman rank correlation test) were employed for all the other variables. Multiple linear regression analyses were performed to further quantify the relationship between the clinical and biochemical variables. Only two-tailed probabilities were used for testing statistical significance. The data are presented as mean±SD, or median and interquartile ranges (IQR). Only p-values lower than 0.05 were regarded as statistically significant. All the calculations were made using computer software packages (Statistica 8.0, StatSoft Inc., Tulsa, OK, USA).
Results Based on the molecular studies, all the cancer and control subjects were divided into three genotypes of the MTHFR gene: CC, CT and TT for the C677T mutation and AA, AC and CC for the A1298C mutation. The genotype distribution
Ferroni et al: Homocysteinemia in Human Cancer
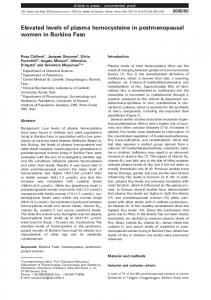
Figure 1. Frequency distribution of MTHFR C677T and A1298C genotypes between cancer patients and healthy subjects.
Table I. Laboratory variables of cancer patients and controls. Control subjects (N=47)
Cancer patients (N=47) P-value*
Vitamin B12 (pg/ml) Folate (ng/ml) Fibrinogen (mg/dl) hs-CRP (mg/l) Homocysteine (μM) IL-6 (pg/ml) TNF-α (pg/ml)
Median (IQR) Median (IQR) Mean±SD Median (IQR) Median (IQR) Median (IQR) Median (IQR)
299 (267-340) 5.5 (4.2-8.6) 348±86 0.11 (0.05-0.51) 6.4 (5.8-8.8) 0.8 (0.4-1.4) 1.9 (0.4-1.6)
0.999 0.438 0.258 0.004 0.040 11.5 μM) on the basis of the mean +2SD of the values observed in the controls. The associations between the tHcy and the clinicopathological variables were analyzed after categorization. As shown in Table II, no significant correlation was observed between tHcy and site, stage, tumor size or lymph node involvement of the cancer patients, which only showed a positive trend, while high plasma tHcy levels were associated with metastatic disease (Chi-square analysis: p11.5 μM P-value
15 32
11 (73) 27 (84)
4 (27) 5 (16)
0.37
29 18
23 (79) 15 (83)
6 (21) 3 (17)
0.73
22 25
20 (91) 18 (72)
2 (9) 7 (28)
0.10
17 18
14 (82) 15 (83)
3 (18) 3 (17)
0.94
23 12
21 (91) 8 (67)
2 (9) 4 (33)
0.07
28 19
26 (93) 12 (63)
2 (7) 7 (37)
0.01
*Categorized on the basis of the mean +2SD of the values observed in healthy subjects. **Including 35 primary carcinomas.
The ANOVA test showed that the plasma tHcy levels were not associated with either MTHFR 677C¡T (F=0.216, p=0.81) or 1298A¡C (F=0.243, p=0.79), but they were inversely correlated to the folate status of the patients (Spearman rank correlation: Rho=0.567, p