International Journal of Contemporary Hospitality Management Developing mobile services: A look at first-time and repeat visitors in a small island destination Manuel Rivera Robertico Croes YunYing Zhong
Downloaded by University of Central Florida At 13:48 13 December 2016 (PT)
Article information: To cite this document: Manuel Rivera Robertico Croes YunYing Zhong , (2016),"Developing mobile services A look at first-time and repeat visitors in a small island destination ", International Journal of Contemporary Hospitality Management, Vol. 28 Iss 12 pp. 2721 - 2747 Permanent link to this document: http://dx.doi.org/10.1108/IJCHM-02-2015-0052 Downloaded on: 13 December 2016, At: 13:48 (PT) References: this document contains references to 83 other documents. To copy this document:
[email protected] The fulltext of this document has been downloaded 104 times since 2016*
Users who downloaded this article also downloaded: (2016),"Service quality and brand loyalty: The mediation effect of brand passion, brand affection and self-brand connection", International Journal of Contemporary Hospitality Management, Vol. 28 Iss 12 pp. 2771-2794 http://dx.doi.org/10.1108/IJCHM-09-2015-0466 (2016),"An examination of determinants of trade show exhibitors’ behavioral intention: A stakeholder perspective", International Journal of Contemporary Hospitality Management, Vol. 28 Iss 12 pp. 2630-2653 http://dx.doi.org/10.1108/IJCHM-06-2015-0318
Access to this document was granted through an Emerald subscription provided by emeraldsrm:151079 []
For Authors If you would like to write for this, or any other Emerald publication, then please use our Emerald for Authors service information about how to choose which publication to write for and submission guidelines are available for all. Please visit www.emeraldinsight.com/authors for more information.
About Emerald www.emeraldinsight.com Emerald is a global publisher linking research and practice to the benefit of society. The company manages a portfolio of more than 290 journals and over 2,350 books and book series volumes, as well as providing an extensive range of online products and additional customer resources and services. Emerald is both COUNTER 4 and TRANSFER compliant. The organization is a partner of the Committee on Publication Ethics (COPE) and also works with Portico and the LOCKSS initiative for digital archive preservation. *Related content and download information correct at time of download.
The current issue and full text archive of this journal is available on Emerald Insight at: www.emeraldinsight.com/0959-6119.htm
Developing mobile services A look at first-time and repeat visitors in a small island destination Manuel Rivera Department of Hotel and Restaurant Management, University of Central Florida, Orlando, Florida, USA
Downloaded by University of Central Florida At 13:48 13 December 2016 (PT)
Robertico Croes Rosen College of Hospitality Management, University of Central Florida, Orlando, Florida, USA, and
Visitors in a small island destination 2721 Received 9 February 2015 Revised 15 January 2016 21 March 2016 Accepted 25 March 2016
YunYing Zhong Department of Hospitality Management, Family and Consumer Science, California State University, Long Beach, California, USA Abstract Purpose – This paper aims to examine and identify important attributes for mobile applications (apps) that might dictate tourist preferences for the apps on a small island destination. Guided by the Task Technology Fit (TTF) theory, the study considers the tasks performed, technology characteristics and individuals’ characteristics in determining the mobile apps attribute set. Design/methodology/approach – This study uses a conjoint methodology within a case study approach framework. The conjoint analysis allows for assessing preferences from different consumers regarding the objective characteristics of products or services that facilitate the optimal design of product development. Optimal product development is a challenge for destinations, as they strive to achieve and sustain optimal market positions. Mobile apps may empower destinations in this endeavor. The case study approach imparts a context-dependent knowledge that facilitates a more nuanced understanding of consumer preference of use. Findings – The results of the conjoint analysis suggest a strategic mapping of the most important attributes including type of content information, coupons and location awareness in defining apps product development. Within each attribute, the study also identifies the significant characteristics of a mobile application that are preferred by tourists. This ranking exists irrespective of familiarity with the destination (first-time and repeat visitors). Research limitations/implications – The implication is that revealed preferences anchored in conjoint analysis provide a powerful approach to optimize product development in a small island destination. From a practical perspective, the findings suggest that the developments of a mobile app for a destination must concentrate on fostering spending and consider the app as a new marketing channel. From a theoretical point of view, the current study highlights the usefulness of using the conjoint analysis and the TTF theory as an overarching framework in mapping a multi-attribute decision-making space that influences tourist judgment and preference of use. The conjoint method applied in the study enables researchers to clearly identify a combination of various mobile app attributes that are most influential on tourists’ choice and preference of use. The guiding framework, TTF theory, allows the conjoint product designs to go beyond the technology characteristics to include tasks performed by tourists and their individual characteristics. Originality/value – This study is the first to apply a conjoint analysis within the TTF theoretical framework in the context of a small island destination when assessing tourists’ use preferences toward mobile applications, while at the same time investigating whether any differences exist between
International Journal of Contemporary Hospitality Management Vol. 28 No. 12, 2016 pp. 2721-2747 © Emerald Group Publishing Limited 0959-6119 DOI 10.1108/IJCHM-02-2015-0052
IJCHM 28,12
first-time and repeat visitors. The study demonstrates that complementing the nature of the task (traveling) with context-specific interface and interactive features is an important area of inquiry that can benefit from adopting conjoint analysis. Keywords Conjoint analysis, Mobile applications, Aruba, First-time visitors and repeat visitors, Task technology fit, Tourism technology Paper type Research paper
Downloaded by University of Central Florida At 13:48 13 December 2016 (PT)
2722 Introduction As competition for market share among destinations is fierce, it is clear that destinations have a stake in the manner in which they choose to design and develop the means to attract market segments. Thus, destinations are compelled to continuously seek innovative means to advance their market position. Traditionally, tourism-related enterprises and destination marketing organizations (DMOs) relied on mass media channels that were unidirectional in nature (e.g. print media, recordings, cinema, radio and television). However, currently, the marketing landscape has shifted, and the emergence of mobile technology and applications has provided interactive opportunities between tourism destinations and tourists (Hannam et al., 2014; Wang et al., 2012). Smart mobile devices are multi-purpose ubiquitous devices that rest largely on the major activities that application use offers (Theoharidou et al., 2012). Applications (apps) are software that enable smart devices to deliver specific mobile services such as navigation and mapping. Google Mobile Planet Statistics (2013) showed that 69 per cent of smartphone owners used applications. The quality of the apps content, then, is a major player in creating a more personalized experience, as is the tourists’ preference of that content, and the destination’s benefit from that content. However, mobile apps have a short market introduction period that is limited to a few months (Haid et al., 2008). In addition, if an organization desires to ensure that a new mobile tourism service app generates a high amount of attention and acceptance from tourists within a short time frame, then it may become necessary to understand the market’s orientation at the developmental stage of the apps production (Lee and Raghu, 2014). This study investigates tourists’ preferences for mobile application content while at a destination. More specifically, it seeks to ascertain those mobile application attributes that might effectively aid tourists in determining their consumption choices while at the destination. Further, it seeks to reveal those attributes as a means for destinations to forward their advantage in a competitive market. The study is guided by the Task Technology Fit (TTF) theory (Bouwman and van de Wijngaert, 2009; Goodhue and Thompson, 1995), and the current study considers the following three elements suggested by the theory: (1) the individual characteristics that define the type of tourist; (2) the tasks performed (information searches, consumption, activities); and (3) the technology characteristics (hardware and software). Existing studies of mobile devices and apps in the tourism context have mainly focused on the strategic importance and impacts of mobile technology on the tourists’ experience (Neuhofer et al., 2012; Tjostheim and Fesenmaier, 2008; Wang et al., 2014, 2016) and on mobile technology use intention based on the technology acceptance model (TAM) and
Downloaded by University of Central Florida At 13:48 13 December 2016 (PT)
its derivatives (Hsu and Chu, 2014; Kim et al., 2008; Kwon et al., 2013; Rivera et al., 2015). While these studies have advanced the body of knowledge of tourism mobile technology, they might not be able to identify specific task and technology characteristics at the early, beginning stage of designing a tourist-preferred app. For instance, the TAM examines travelers’ intention to use a new technology based on their perceived usefulness and ease of use (Kim et al., 2008). It does not identify specific preferable attributes. As such, this study has three main objectives. First, it identifies the important attributes that comprise a viably advantageous mobile application for a destination. Second, the study uncovers the most important features of the various attributes related to a tourism mobile application for a destination. Third, the study distinguishes whether any differences exist between first-time visitors and repeat visitors with regard to their preferences for mobile app attributes. The study adopts conjoint analysis as a major analytical tool to achieve these three goals. The analysis is based on respondents’ choice among products, which are made up of a combination of attributes, and it assumes that behavior is motivated by rational choice. This means that individuals seek to choose the types of mobile application options that pose the ability to conveniently satisfy their hedonic and ergonomic needs (Hassenzahl, 2001). The study posits that focusing on usage preferences grounded in choices for a combination of attributes may uncover better insights into consumer behavior than would attitudinal perspectives in determining behavior, and thus provides new insights to existing literature. Literature review Mobile app as a value-added innovation The tourism industry is well recognized as a multifaceted industry, which is characterized by the interdependence of multiple stakeholders and fragmented resources (Aldebert et al., 2011; Mistilis et al., 2014). The issue of fragmentation produces challenges for DMOs to coherently coordinate and market their services, offerings and information to tourists across the destination. Buhalis and Amaranggana (2014) have stressed the important role of DMOs in creating a technologically savvy destination as “a smart hub that coordinates all relevant information and makes it easily accessible for users to access real-time information”, as well as functioning as a center that “engages with local communities, tourists, and government in co-creating the tourism experience”. (p. 560). As smart mobile devices gain a wider popularity with tourists, mobile service applications appear to be innovatively viable for DMOs to effectively pool fragmented resources, thus increasing the effectiveness of destination-wide marketing efforts. Mobile technology and its associated services are expected to drive profits by reducing costs and increasing market awareness and promotions (Buhalis and Licata, 2002). Mobile tourism service applications can help a destination drive down operation and administration costs by digitalizing information which has been traditionally presented in print, enabling customers to have direct information access and self-direct their tour, reducing the number and length of personal communications with tourists, and decreasing office labor costs (Buhalis and O’Connor, 2005). Furthermore, mobile service application use brings tourists to a greater awareness of a destination’s offerings
Visitors in a small island destination 2723
IJCHM 28,12
Downloaded by University of Central Florida At 13:48 13 December 2016 (PT)
2724
and promotions and maximizes their purchase propensity by recommending individually relevant services and products (Buhalis and Licata, 2002). In addition, tourism scholars suggest that mobile devices and associated services have a profound impact on the formation of a tourist experience. Mobile technology serves as an innovative way to create interactive tourist-centric experiences (Buhalis and O’Connor, 2005; Neuhofer et al., 2012). The advancement of internet and mobile technology allows destinations and tourists to occupy the center of the technological functionality, enabling them to co-construct a holistic and interactive experience. According to Buhalis et al. (2011), tourists’ choices have been expanded by mobile service applications that showcase the resources and attractions associated with promotional offers. They can also reconfigure the tourists’ sense of place. That is, tourists are not only immersed in the physical environment but also maintain a stream of conversations with tourism enterprises through information exchange in their virtual space (Lamsfus et al., 2015). In short, tourism scholars suggest that mobile technology and its associated services have transformed the physical destination into a “digital destination” of sorts, which is easily accessible and ready for personalization. Thus, DMOs may need to pay attention to the crafting of user-centric experiences in this virtual space. Furthermore, mobile technology provides support to the flexible nature of tourists’ plans (Brown and Chalmer, 2003). Tourists are more likely to improvise and have spontaneous deviations from their original plan such as changes of travel routes, durations and purchases. They are also more likely to postpone their secondary decision-making (i.e. hotel purchases, restaurant reservations and attraction ticket purchases) from the pre-trip stage to the onsite stage (Lamsfus et al., 2015). Wang et al. (2014, 2016) also came to similar conclusions regarding tourists’ behavioral changes as a result of smartphone use. Tourists reported more flexibility during the trip, change of planning and the possible lean toward more future trips. In addition to behavioral changes, the use of mobile services has also been changing tourists’ perceptions and emotions toward a destination. Thus, the value of smart technological design presents a value-added state for tourists. Indeed, many destinations have realized the importance of mobile technology for their strategic development and tourist experience formation and have taken leads in building various mobile tourism information services that add value and enhance their competitive position. For example, the European Union has funded research to create user-friendly mobile services personalized for tourism (Poslad et al., 2001; Schwinger et al., 2005; Zarmpou et al., 2013). In addition, England and Hong Kong have developed a sophisticated mobile travel application aimed at helping tourists create a memorable experience on the go (Neuhofer et al., 2012). Theoretical and analytical framework Understanding the adoption of mobile applications has gained popularity among researchers in a tourism and hospitality context by applying a TAM framework. Kwon et al. (2013) applied a TAM and found that many users had not experienced mobile applications from hospitality firms. Rivera et al. (2015) also applied a TAM framework to investigate the perceptions of owners, renters and exchangers regarding the adoption of mobile technology for the vacation ownership/timeshare industry. More recently, Hsu and Chu (2014) investigated the intentions of a mobile app for tour services at a
Downloaded by University of Central Florida At 13:48 13 December 2016 (PT)
destination using the TAM framework and privacy concern theory. A closer comparison of the findings from those studies currently focuses on how effective the users perceive the technology to be in terms of enjoyment, ease of use and confidence. Although the literature applying the TAM (Davis, 1986) and its extensions has provided the critical factors that predict technology adoption, Bouwman and van de Wijngaert (2009) have indicated several limitations of the theory when analyzing mobile systems. For example, previous TAM research has treated technology as a “black box” rather than taking into consideration the specific characteristics of the technology that might influence its usage. Some of the limitations that are present in the tourism literature using TAM models include the lack of specificity in eliciting particular preferences for the attributes that form a mobile technology (Hsu and Chu, 2014; Rivera et al., 2015), as well as in the use of student samples (Kwon et al., 2013). Therefore, an opportunity exists to capture the optimal combination of attributes and its associated influence on the consumer decision-making process to use a technology. According to Jarvenpaa (1989), one of the major challenges that the design of digital interfaces had was the lack of theoretically based principles. Bearing this in mind, the TTF theoretical framework from Goodhue and Thompson (1995) provided a suitable framework to establish the connection between technology and usage. Goodhue and Thompson (1995) have defined TTF as “the degree to which a technology assists an individual in performing his or her tasks”. More specifically, it has been the “fit” among task requirements, individual characteristics and the functionality and interface of the technology (Goodhue and Thompson 1995). The TTF has been contributing to the success of technology innovations by connecting aspects that are critical to the support of a given task (Junglas and Watson, 2006). This framework provides direction for the design of a technology and has been previously used to build an analytical model for the design of a mobile application. Bouwman and van de Wijngaert (2009) have posited that TTF has provided theoretical grounds for better understanding of the adoption of mobile technologies by bearing in mind the interaction between the environment, the tasks involved and the characteristics of the individuals (users). These three unique tenets of the TTF are described below before introducing the design of this study. The tasks. Goodhue and Thompson (1995) have posited that the individuals’ interaction with technology has been linked to their task behavior. They defined “tasks” as actions carried out by individuals for turning inputs into outputs. Some common tasks that tourists perform when visiting a destination include shopping, going to restaurants and pubs, sightseeing and touring participating activities and events or visiting attractions. These tasks typically require the user to rely on certain aspects of the information technology. For example, tourists depend on an information system’s capacity to find out precise information on a museum, say, its address, operation hours, tickets, review rating and the like (Kennedy-Eden and Gretzel, 2012). Another primary task tourists perform with the assistance of mobile technology is navigation. Some of the early adopters of mobile technologies in tourism expressed preference for mobile guides while on vacation, an area that received much attention in the early literature (Gavalas and Kenteris, 2011; Kramer et al., 2008). The novelty of such technology was that it highlighted the importance of functionality, which included information, mapping, navigation and context-awareness (Zarmpou et al., 2013). These
Visitors in a small island destination 2725
IJCHM 28,12
Downloaded by University of Central Florida At 13:48 13 December 2016 (PT)
2726
are still relevant at present. The information and mapping functions enable tourists to check information on and receive traveling guides to airports, hotels, restaurants, events, attractions and sightseeing opportunities at a destination. Kennedy-Eden and Gretzel (2012) developed a taxonomy of mobile apps in tourism and emphasized the role of navigation in helping visitors find their way around the area. Some of the sub-categories under navigation can also include the Global Positioning System (GPS) and augmented reality. Tourist shopping behavior is also a prominent activity of tourists, and the literature indicates that the tourism industry is considered one of the leaders in developing eCommerce applications for tourists (Werthner and Ricci, 2004). Hui et al. (2013) have found that using mobile promotions, such as coupons, could increase unplanned spending from mobile technology users. Couponing and the type of device used are features that are less discussed in literature but are important in creating a value-added mobile tourism app. Couponing has long been a popular promotional tool in the tourism industry. Anecdotal evidences show that it has the benefits of stimulating demand, filling up occupancy in slow seasons, generating sales leads and new customers, providing price differentiation and incurring controllable and measurable expenses (Sigala, 2013). The efficiency of couponing has also been found to be related to the features of coupons, including their face value and the discount percentage (Sigala, 2013). Mobile couponing is a convergence of traditional coupon promotions and mobile technology. It can be context sensitive, delivering the preferred types of coupons to tourists who are near or inside stores. The potential value to tourism enterprises is obvious. Tourists have been urged to purchase action precisely in real time when they are making decisions (Wehmeyer and Muller-Lankenau, 2005). The need for tourists to answer questions or find information about activities or businesses is contingent upon an information system’s capacity to process queries and present information. Thus, it is important to identify the technical attributes of mobile technologies and how they coalesce by providing users a better representation of the tasks they will experience in terms of usage functionality. The technology. The TTF theory considers technology as the tool individuals use to carry out specific tasks. In the context of mobile apps for a tourism destination, technology refers to hardware or software that will assist the tourists in their tasks. Mobile devices and apps have evolved to become an emerging, changing force of the tourism industry (Aldebert et al., 2011). In the early stages when destinations were exploring the potential offered by mobile devices, Web portals, online media presentations and push messages were often used (Lai, 2015). Nowadays, the new generation of mobile smart devices has evolved to possess more computing powers. The devices are equipped with high-speed data transmission, Wi-Fi capability and various sensors (e.g. GPS and proximity sensor), providing context awareness information (Dickinson et al., 2014; Lai, 2015). The context-awareness functions allow mobile apps to present more relevant information and recommendations to tourists based on their physical surroundings and personal preferences. The two major context-awareness functions discussed in literature are location-based service (LBS) and personalization service (Poslad et al., 2001; Lamsfus et al., 2015). The LBS is a category of service that can identify tourists’ current position and adapt displayed content and services accordingly. It
Downloaded by University of Central Florida At 13:48 13 December 2016 (PT)
not only enables tourists to locate places but also calculates routing between places, searches for nearby businesses and helps the user remain abreast of traveling conditions, such as traffic situations (Berger et al., 2003). Personalization is a similar adaptive function. Information is displayed according to its relevancy to tourists’ personal interests and online search behaviors. Service and product recommendations are given based on the personal preferences or attitudes and are either explicitly input by tourists or inferred from their frequented online sites (Poslad et al., 2001; Hammond, 2013). Both LBS and personalization services present great opportunities not only for tourists to customize their own experiences but also for local service and product providers to capture business opportunities. To ensure a good use experience of mobile tourism applications, the hardware features of mobile devices cannot be ignored. In general, mobile devices have their restrictions in terms of battery life, screen size and processing power (Zarmpou et al., 2013). Technical evaluations on early prototypes of mobile tourism guides noted that the mobile device’s limited screen size could negatively affect user experience, thus requiring app developers to adjust information presentation (Hammond, 2013; Zarmpou et al., 2013). Therefore, the features of various mobile devices (i.e. smartphones and tablets) and the consumer preference toward them need to be taken into consideration during the app development stage. The individual. In the literature, TTF theory emphasizes the role of the individual. For Goodhue and Thompson (1995), the fit of a specific technology may have varied by individual subject to that individual’s abilities, experience and familiarity. In the current study, we equate the tourists with Goodhue and Thompson’s (1995) “individuals” and consider them subjects that may use technologies to assist them in the performance of their tasks – in our case, during a leisure trip. The characteristics of the tourists (for example, first-time vs the repeat tourist) can affect how easily the technology can be used. Previous research had indicated mixed results with regard to travelers’ behavior related to technology usage based on the type of tourists: more specifically, that of familiarity with a destination. Fodness and Murray (1999) found that first-time visitors and repeat visitors had revealed different behaviors when it came to the use of technology while searching for information. Oppermann (1997) and McKercher et al. (2012) also found that first-time visitors were likely to be more exploratory than repeat visitors when using technologies during their vacation, as the latter usually tended to limit the amount of participation in activities and attractions. However, Chen and Gursoy (2000) found that first-time and repeat visitors were equally motivated to use public information sources for their trip. Guided by these three tenets of the TTF theory, the study considers both tasks performed by tourists and mobile device characteristics in our conjoint mobile app design. More specifically, six attributes are included. They are information content (for activities), mapping functions, shopping coupons, personalization, location awareness and types of devices. The study also incorporates individual characteristics by examining potential differences in tourist mobile app preference between first-time and repeat visitors. Consequently, this study aims to answer the following three research questions:
Visitors in a small island destination 2727
IJCHM 28,12
RQ1. Which mobile app attributes are important for tourists? RQ2. Which features under each mobile app attribute are the most desirable by tourists? RQ3. Are there any differences in the preferences for mobile app characteristics between first-time and repeat visitors?
Downloaded by University of Central Florida At 13:48 13 December 2016 (PT)
2728 Methodology The study is applied within a small island destination because market frictions characterize such destinations as places where information flow is a clear challenge to optimal market performance (Croes, 2011). Better understanding of the impact of information flow on choice decisions may make it possible to mitigate market imperfections induced by scale constraints. Keane (1997) claimed that more efficient information flow within a market would enhance quality assessment and protection, as well as increase revenues. Small island destinations are faced with supply constraints and are therefore in constant search for value-added offerings and increased revenues (Croes, 2011). The study uses Aruba as a case study. Aruba is one of the most prominent destinations in the Caribbean region and one of the most tourist dependent regions in the world (Croes, 2011). The World Travel and Tourism Council (2014) reported that tourism accounted for about 83.8 per cent of the total gross domestic product in 2012, suggesting a high degree of tourism specialization for the island. Aruba’s real gross domestic product per capita (2000 ⫽ 100) was US$24,330 in 2012, becoming one of the highest in the region. Recently, Aruba achieved a new milestone with one million arrivals. However, Aruba may not be able to continue to grow the amount of arrivals due to supply constraints as a small island destination. Therefore, searching for ways to increase the spending of tourists while at the destination has become a crucial strategic question for this island destination. Thus, the study assumes that Aruba is a strategic, critical case that allows the researchers to generate inferences that support new research propositions for small island destinations. Conjoint value analysis and measurement This study has used a conjoint value analysis (CVA) to understand the relative importance tourists place on individual attributes and their associated levels of a tourism mobile application. This method has been widely used in understanding consumer preference in different markets such as apparel (Herbst and Burger, 2002), travel (Basala and Klenosky, 2001), telecommunication preferences (Kim et al., 2005), restaurants (Adhikari, 2015), mobile devices (Chuang et al., 2001), technology adoption (Bouwman and van de Wijngaert, 2009) and mobile applications (Head and Ziolkowski, 2010; Koo et al., 1999). By applying a conjoint analysis, tourists are expected to judge the usefulness of a mobile application by means of a multi-attribute, preference-formation framework. According to Bouwman and van de Wijngaert (2009), the conjoint method moves beyond TAM research by embedding the “perception of use” measure in conjoint scenarios, thus the strength of conjoint analysis becomes clear. Conjoint analysis provides a nascent technique based on individual choice theory that can assist
Downloaded by University of Central Florida At 13:48 13 December 2016 (PT)
researchers in identifying the trade-offs individuals make when forming preferences for a product (McFadden, 1986). In a conjoint analysis, a product is described as a combination of attributes and, each of attributes can be further divided into various levels. Conjoint surveys prompt respondents to rate or choose between tasks, defined as a combination of specific attributes and levels. Through this methodology, researchers can assess the relative value each respondent places on each possible level. These estimated level values are referred to as part-worth or level utility. The part-worth data can then be used to calculate the relative importance of each attribute, which is also referred to attribute utility. The part-worth and attribute utility can then be used to predict a respondent’s likelihood of using a product (Sawtooth Software, 1997). In this study, the Sawtooth Software SSI Web programming has been used to generate the survey design and for the analysis of data. A good CVA design requires three steps. First, it is required to clearly state a well-defined research objective that delineates what the study will attempt to measure (Bridges et al., 2011; North and de Vos, 2002). The research objective that delineates this study is to provide an understanding of which mobile application attributes are important for tourists, and to reveal how those attributes differ for tourists who are repeat visitors to a destination compared to those who are first-time visitors. The next required step of the CVA design is to select a set of attributes and levels that realistically and carefully represent the product offered. In this study, a set of tourism mobile app attributes was determined based on the primary objectives of the study and the three tenets of the TTF theory. To generate specific mobile app attributes and levels for the questionnaire, the researchers considered associated literature and consulted experts in the field of tourism and telecommunications in Aruba. This process assured face or content validity and potentially avoided biased responses by considering the type of questions, language used and order of items (Rattray and Jones, 2007). To ensure that the selection of attributes and levels takes into consideration marketing capabilities, possible budget allocation, investment risks, pros and cons of policy options and infrastructure limitations (e.g. network incapability and bandwidth access), it was necessary to incorporate the opinion of prominent tourism stakeholders in Aruba (Siau et al., 2001). A total of six attributes with 17 levels were identified from a combination of the existing literature and from two focus groups comprising experts in Aruba’s tourism and telecommunications industries. The set of six attributes for the study included type of device with two levels (Gu and Tarasewich, 2004), LBS with two levels (Zipf, 2002), coupon type with three levels (Wehmeyer and Muller-Lankenau, 2005), content information with four levels (Gu and Tarasewich, 2004), personalization with three levels (Poslad et al., 2001) and mapping services with three levels (Zipf, 2002). All the attributes and levels are presented below as attributes and level for mobile application conjoint: (1) Attribute #1: Type of device: • smart phone; and • tablet.
Visitors in a small island destination 2729
IJCHM 28,12
Downloaded by University of Central Florida At 13:48 13 December 2016 (PT)
2730
(2) Attribute #2: Types of coupons: • cash off total purchase; • percentage discount of purchase; and • no coupons. (3) Attribute #3: Types of content information: • services (restaurants, pubs and shopping); • events (nightlife and special events); • activities (water activities and land activities); and • attractions (historic and cultural). (4) Attribute #4: Location awareness: • yes; and • no. (5) Attribute #5: Personalization: • Yes, service-based personalization; • Yes, product-based personalization; and • No personalization of products or services. (6) Attribute #6: Mapping options: • street directories; • tourist map; and • business directories. After establishing the attributes and levels, the third step of the CVA design is to form a number of attribute combinations to represent a mobile app product. Based on the proposed number of attributes and levels, the combination of all levels generated a total of 432 profiles (i.e. 2 ⫻ 2 ⫻ 3 ⫻ 4 ⫻ 3 ⫻ 3 ⫽ 432). As it is impractical to ask respondents to rate 432 profiles, the size was reduced to 12 profiles by using the fractional factorial design. According to Kuhfeld (1997, p. 8), a good profile size for an efficient design should be no less than the number of parameters. The number of parameters equates to the number of all levels, minus the number of attributes, plus one for the intercept. The size of 12 is deemed to be sufficient because it is no less than the number of parameters in this study (i.e. 17 – 6 ⫹ 1 ⫽ 12). In addition, the design must maximize the D-efficiency, given the previous conditions and constraints. Kuhfeld et al. (1994) indicate indicated that a D-efficiency is a function of the determinant of the X’X matrix, given by the formula: D ⫺ efficiency ⫽
100 ND ⱍ (X=X)⫺1 ⱍ 1/p
where ND ⫽ number of tasks, p ⫽ number of attributes and X ⫽ the design matrix using orthogonal coding. This formula measures the goodness of the orthogonal design and specifies that a balanced design will result in an efficiency of 1. A final D-efficiency of less than 1 but greater than 0.9 indicates a satisfactory design. The computer-generated report from Sawtooth Software indicates that the design of this study is good with a
Downloaded by University of Central Florida At 13:48 13 December 2016 (PT)
D-efficiency of 0.9187, therefore allowing for the adoption of a single-concept design. The alternatives depicting the attributes and levels that were generated by Sawtooth Software are presented in Table I. Research hypotheses In conjoint analysis, part-worths or level utilities are interval data, and they are scaled to sum to zero within each attribute. A positive part-worth value for a level indicates that its presence adds a higher utility to the mobile phone product. On the other hand, a negative part-worth value does not mean that the level was unattractive. In fact, a negative utility level may have been acceptable to all respondents, but to a lesser degree in the presence of a level with positive values. The attributes’ utility values are represented by a percentage and indicate the relative importance of each attribute. The attribute utility is a ratio of the part-worth difference within an attribute over total difference of all attributes. The attribute utilities of a product add to 100 per cent. (Orme, 2010). With this in mind and to supplement the research questions previously stated, the study follows the recommendation of Bridges et al. (2011): that is, developing hypotheses to statistically confirm any preference variation between and within attributes, as well as between different market segments, i.e. between first-time and repeat tourists. The research hypotheses are:
Visitors in a small island destination 2731
H1. The attribute utilities are not equally important. H2. The part-worths are significantly different from zero. H3. The part-worths are significantly different within each attribute. H4. The attribute utilities are significantly different between first-time and repeat tourists. H5. The part-worths are significantly different between first-time and repeat tourists. H1 is related to tourists’ preference of mobile app attributes (see RQ1). It is used to test the significance of the importance tourists place on the different attributes that make up
Scenario no.
Information
Coupons
Personalization
Mapping
Device
Location awareness
Scenario #1 Scenario #2 Scenario #3 Scenario #4 Scenario #5 Scenario #6 Scenario #7 Scenario #8 Scenario #9 Scenario #10 Scenario #11 Scenario #12
Activities Events Services Activities Activities Attractions Attractions Attractions Events Services Services Events
Cash off Cash off Cash off No % off % off No Cash off % off No % off No
Product Services Product Services None Services Product None None None Product Product
Business directories Street map Tourist map Tourist map Street map Business directories Tourist map Street map Tourist map Business directories Street map Business directories
Phone Phone Tablet Tablet Tablet Phone Tablet Phone Phone Phone Phone Tablet
No Yes Yes No Yes Yes Yes Yes No Yes No No
Table I. Conjoint alternatives
IJCHM 28,12
Downloaded by University of Central Florida At 13:48 13 December 2016 (PT)
2732
a mobile application for Aruba – and to assist the researchers in ranking them in the order of importance. This becomes relevant as, due to the lack of research on mobile application characteristics in a tourism setting, there is no “a priori” knowledge regarding preferences. A significant difference between attributes only exists if the upper confidence interval (CI) for one attribute is greater than the lower CI for another attribute (Manalo, 1990; Wingate, 2011). This means that any attribute comparison with overlapping values in their CI will be considered not statistically different. H2 and H3 are associated with tourists’ preference on the features under each attribute (see RQ2). H2 is designed to infer whether the levels of a particular attribute are statistically significant. The zero-centered part-worth estimates are examined at the 2.5 percentile and the 97.5 percentile to obtain a 95 per cent CI and determine whether they were statistically significantly different from zero (Wingate, 2011). If the CI values for a specific level cross zero, then they are not assumed to be significant. In addition, H3 is designed to identify differences between levels within each attribute of the mobile application. Similar to H1, a significant difference exists across attributes if the upper CI for one level is greater than the lower CI for another level across an attribute. Finally, H4 and H5 are to test the differences in attribute utility and part-worth between first-time and repeat visitors (see RQ3). While existing literature has not reached consensus on the technology preference and usage differences between first-time and repeat visitors, this study proposes that they have significant differences in attribute and level importance (e.g. attribute utility and part-worth). Sample and data collection To test the proposed hypotheses, primary data relating to tourists visiting Aruba have been used. The need for this information is part of an initiative from the Aruba Tourism Authority, the official DMO for Aruba to understand tourists’ preferences for a mobile application for the destination. The researchers have applied an “en route methodology” (Baloglu et al., 2004). This method reduces response error because the information is sought right after the traveling experience, when the visitors are about to depart the destination (Otto and Ritchie, 1996; Rivera and Croes, 2010). Tourists had been approached according to the principles of a heterogeneous purposive sample to ensure heterogeneity (Finn et al., 2000). For the data collection, trained representatives from the Aruba Tourism Authority had identified potential tourists by asking the tourists whether they used a mobile device while vacationing in Aruba. Due to the complexities associated with the intercept survey method, the researchers opted for a paper and pencil data collection process that included 12 different pictorial representations of a mobile phone that depicted the various combinations of levels that resembled the main page in a mobile app for the destination (Hair et al., 1998, pp. 400-436). Respondents were asked to rate each pictorial stimulus on a nine-point scale, with anchor valences from 1 to 9, whereby 1 indicated “definitely would not use”, and 9 indicated “definitely would use”. In addition to the 12 pictorial stimuli described above, this research considered questions to determine the types of mobile devices used (i.e. smartphones and/or tablets) during vacation at the destination, along with the associated demographic information, and the tourists’ perceptions about mobile technology applications in Aruba; related questions were rated on a scale anchored by valences from 1 to 7, whereby 1 indicated “strongly disagree”, and 7 indicated “strongly agree”.
Only tourists who responded that they used a smartphone during their visit to Aruba were considered for completing the survey. In total, 159 individuals satisfactorily completed the questionnaire, which is an appropriate sample size for conjoint analysis (Orme, 2010). All survey interviews were conducted at the departure gate over a four-week period during the summertime at the local Aruban airport, Aeropuerto Internacional Reina Beatrix.
Visitors in a small island destination
Downloaded by University of Central Florida At 13:48 13 December 2016 (PT)
2733 Results Tourist profile The sample consists of slightly more males (52 per cent). The respondents’ average age was 37 years. Financially, the tourists from our sample have high-income levels, 60 per cent of respondents have a house income of US$50,000 or more per year. The respondents are also highly educated; 48 per cent have a bachelor’s degree, and 28 per cent possess a postgraduate degree. The majority of the tourists come from the USA (82 per cent), followed by The Netherlands (6 per cent) and Venezuela (4 per cent). As for the familiarity with the destination, 55 per cent of the tourists were first-time visitors to Aruba. As for the connectivity preferences for the respondents, the most popular places for using the internet included hotels (61 per cent), beaches (20 per cent) and the airport (20 per cent). It seems that the improvements in telecommunication service and infrastructure in Aruba provide added benefits for the tourists. Overall, 66 per cent of the tourists surveyed indicated that the preferred type of service for connectivity is free Wi-Fi, while the remaining 34 per cent pay either for roaming or Wi-Fi access. The respondents demonstrated a high degree of technology awareness and adoption. For example, while vacationing in Aruba, 67 per cent of the respondents indicated they used a smartphone, 50.7 per cent used a laptop computer and 33 per cent used a tablet. The majority of respondents’ smartphone characteristics of ownership included Apple cellular phones (35 per cent), followed by Blackberry cellular phones (29 per cent) and Android cellular phones (23 per cent). In addition, half of the respondents also indicated using a laptop during their vacation in Aruba. When asked whether the infrastructure available for telecommunications in Aruba allows for using mobile devices, 56 per cent were in agreement, 28 per cent were not sure and 16 per cent of the tourists responded with any level of disagreement. The majority of the tourists also indicated a level of agreement (87 per cent) regarding the use of mobile device applications for enhancing their experience. In addition, 36.8 per cent of the tourists indicated that they are willing to pay for a mobile application for Aruba. The tourists also demonstrated a high degree of loyalty toward the destination. When asked about their intention to return to Aruba, 92.7 per cent of the tourists were in agreement. The complete results are presented in Table II. Mobile app preferences The conjoint framework hypotheses for mobile applications were tested via conjoint analysis with Sawtooth Software. To test H1, the first part of the analysis entails calculating the average attribute utilities. The average utilities for all attributes are presented in Table III. The conjoint results indicate that type of content information (which conveys information about the destination) plays the most important role in consumer likelihood to use the mobile application. The relative importance of this
Table II. Tourists’ perceptions about Aruba
Aruba’s infrastructure allows the use of mobile technology Mobile device applications enhance the tourist experience I would pay a fee for an application in Aruba I have an intention to return to Aruba 6.6 1.4 14.0 0
5.1 1.4 19.9 1.5
Disagree (%)
4.3 12.5 0.7
4.4
Somewhat disagree (%)
5.8 16.9 5.1
28.5
Neither agree nor disagree (%)
20.3 11.8 12.4
21.2
Somewhat agree (%)
29.7 8.1 21.2
20.4
Agree (%)
2734
Perception about Aruba
Strongly disagree (%)
Downloaded by University of Central Florida At 13:48 13 December 2016 (PT)
37.0 16.9 59.1
13.9
Strongly agree (%)
IJCHM 28,12
12.22 10.02 18.70 27.45 16.02 15.59
0.12 0.08 0.10 0.13 0.08 0.08
12.75 9.52 17.99 28.81 15.71 15.19
Part-worth utilities Previous SD (%) visit (%) 11.58 10.59 19.53 25.84 16.38 16.05
First time (%)
Notes: * Significance level of ␣ ⫽ 0.05; a Pairwise comparison is between attributes
(a) Device (b) Location awareness (c) Coupons (d) Content information (e) Personalization (f) Mapping options
Attributes
All Tourists (%) 0.640 ⫺0.889 ⫺0.935 1.448 ⫺0.529 ⫺0.650
t-value 10.43 8.84 17.10 25.45 14.78 14.30
14.01 11.20 20.30 29.46 17.25 16.88
Upper (%)
CI (95%) Lower (%)
Downloaded by University of Central Florida At 13:48 13 December 2016 (PT)
(c,d,e,f)* (c,d,e,f)* (a,b,d,f)* (a,b,c,e,f)* (a,b,d)* (a,b,c,d)*
Pairwise comparisona
Visitors in a small island destination 2735
Table III. Mobile application attributes part-worth utility Relative importance of mobile application attributes
IJCHM 28,12
Downloaded by University of Central Florida At 13:48 13 December 2016 (PT)
2736
Figure 1. Zero-centered part-worth utilities for levels
attribute is 27.88 per cent and is significantly higher than all other attributes (p ⬍ 0.05). The second most important attribute included in this study was coupons with a relative importance of 18.70 per cent followed by personalization (16.02 per cent); these two, however, were not significantly different from each other (p ⬎ 0.05). Mapping options (15.59 per cent) was ranked as the fourth preferred attribute. However, this attribute was not significantly different from that of personalization. The device type (12.22 per cent) and location awareness (10.02 per cent) attributes are significantly lower than all other attributes, but there is no statistical difference between these two. The complete pairwise results for the attributes are presented in Table III. These results indicate that we partially support H1, as some of these attributes indicate a relative level of importance to the tourists. The goal for testing H2 was to determine which attribute levels tourists deemed more desirable. The part-worth for levels within each attribute imparts useful and meaningful information for destinations. The part-worths are presented in Figure 1, and only those levels that fall outside the shaded area are considered significantly different from zero. The goal for H3 was to test whether significant differences exist between levels within each attribute. The results for the pairwise comparison are presented in Table IV. Overall, it appears that the presence of several levels of mobile app attributions increases the utility in the eyes of the tourists. Within the attribute of type of content information, the tourists preferred two distinct levels. Overall, tourists showed more interest for information related to the consumption experience than that related to sightseeing or leisure. More specifically, the type of content information levels with significant part-worth were services (restaurants, pubs
36.99 36.99
7.56 ⫺7.56 16.76 3.63 ⫺20.39 20.61 1.71 ⫺0.81 ⫺21.52 1.46 1.02 ⫺2.48 5.25 4.03 ⫺9.28
Location awareness (c) Yes* (d) No*
Types of coupons (e) Cash off total purchase* (f) Percentage discount of purchase (g) No coupons*
Type of content information (h) Services* (i) Events (j) Activities (k) Attractions*
Personalization (l) Yes, service personalization (m) Yes, product personalization (n) No personalization
Mapping options (o) Street directories (p) Tourist map (q) Business directories* ⫺1.83 ⫺2.81 ⫺16.45
⫺6.33 ⫺5.04 ⫺10.01
10.86 ⫺9.05 ⫺11.14 ⫺33.94
7.75 ⫺2.97 ⫺29.43
1.81 ⫺13.31
6.44 ⫺21.52
Lower
12.33 10.86 ⫺2.11
9.24 7.08 5.06
30.37 12.47 9.53 ⫺9.09
25.76 10.23 ⫺11.34
13.31 ⫺1.81
21.52 ⫺6.44
Upper
(o)*
(q)*
(j, k)* (k)* (h)* (h, i)*
(e)*
(g)*
(d)* (c)*
(b)* (a)*
–
– – –
–
Pairwise comparisonb 0.016 0.074 0.017 ⫺0.085 0.017 ⫺0.014 ⫺0.101 0.068 0.258 0.26 0.017 ⫺0.003 0.017 ⫺0.019 0.017 ⫺0.083 0.023
0.54 0.61 0.54 ⫺0.86 0.54 ⫺0.13 ⫺0.71 0.49 0.75 1.75 0.54 ⫺0.02 0.54 ⫺0.20 0.54 ⫺0.90 0.24
Differences (first-time and repeat) t M⌬
Notes: Mobile application utilities comparison (first-time vs Repeat visitor); * Significance level of ␣ ⫽ 0.05; a Part-worth utility scores are estimated with hierarchical Bayes estimation and reported as average zero-centered part-worth utilities; b Pairwise comparison is within each level
45.53 43.96 46.12
50.06 39.01 48.46
62.75 69.22 66.49 79.94
57.94 42.46 58.16
48.5 48.5
13.98 ⫺13.98
Type of device (a) Smart phone* (b) Tablet*
SD
Part-worth
Attribute/Levela
CI (95%)
Downloaded by University of Central Florida At 13:48 13 December 2016 (PT)
Visitors in a small island destination 2737
Table IV. Zero-centered partworth utilities comparison (firsttime vs Repeat visitor)
IJCHM 28,12
Downloaded by University of Central Florida At 13:48 13 December 2016 (PT)
2738
and shopping) and attractions. For the other two levels, events and activities, the results indicate that part-worth estimates are not significantly different from zero (Table IV). At the same time, within type of content information, the part-worth estimates for services were also statistically significant for all other levels except for events. The results for the pairwise comparison are presented in Table IV. Regarding the second most important attribute, coupons, the only part-worth that was not statistically significant was percentage discount of purchase. However, tourists definitely demonstrated significant preference for cash coupons over the option of no coupons at all. Thus, the availability of coupons within an app should be considered an important promotional mechanism to enhance the consumption experience. Personalization as the third most important attribute suggests that the mobile app should model the content profile based on the interests, abilities and characteristics of the users. However, none of the levels were significantly different from zero, nor were they significantly different from each other (Figure 1). The non-significant results for personalization preferences for services and products could suggest that the content profile based on the interests, abilities and characteristics of the tourists is in harmony. The fourth most important attribute included the mapping options. As presented in Figure 1, the only significant preference for this attribute was related to getting to the business, rather than accessing tourist maps or street maps. Regarding the differences within mapping options, the pairwise comparison in Table IV indicates significant differences between business directories and street directories. In terms of type of device, the part-worth for both smartphones and tablets was statistically significant. The tourists also demonstrated a significant preference for smartphone use over tablet use. In summary, the results from the study indicate that in the case of H1, only the attribute type of content information is significantly higher than all others. There are no differences between device and location awareness, and no differences between coupons and personalization, or between personalization and mapping options. The results partially support H2. The following levels are not significantly different from zero: event and activities (type of content information), per cent off (coupons), street maps and tourists’ maps (mapping options) and all levels within personalization. In other words, these levels are not statistically significant predictors of the importance of their associated attributes. Finally, for H3, all the levels that are significantly different from zero are also significantly different from each other across attributes. Differences between first-time and repeat tourists By differentiating between first-time tourists and repeat tourists, and by focusing on the individual, the researchers could test whether familiarity with the destination influenced the tourists’ preferences regarding the various attributes/levels of the mobile app. The goal for testing H4 was to determine whether tourists’ preferences for a specific attribute of a mobile app existed when controlling for a previous visitation to the destination. Therefore, the tourist sample was split according to whether the tourists had made previous visits to the destination. Similarly, for testing H5, the goal was to test whether the part-worth utilities for levels within each of the attributes were significantly different between first-time and repeat tourists. The results in Table IV indicate that no significant differences exist between first-time and repeat visitors. The overall mean for each attribute’s relative importance does not reveal significant differences. Regardless of whether tourists had visited the
Downloaded by University of Central Florida At 13:48 13 December 2016 (PT)
destination before, the utility part-worth demonstrates that they have similar preferences for all attributes. Furthermore, when comparing the importance placed on each of the levels within each attribute, the mean differences presented in Table IV also indicate that no significant differences between the two segments exist. The results also reveal that regardless of familiarity with the destination and to enhance their consumption experience, both types of tourists want access to services, monetary discount coupon deals and mapping options to find businesses. Additionally, the results suggest that regardless of the previous experience at the destination, both tourist segments are interested in a platform that can provide services via a mobile application. In this section, we tested H4 and H5. The results indicate that both hypotheses are rejected. This means there are no significant differences between first-time and repeat tourists in terms of attribute importance and part-worth of levels, respectively. Therefore, an opportunity exists to provide travelers with more information about the destination regardless of their experience. Discussion By applying a conjoint methodology, the current study was capable of gauging usage preference by considering the tourists’ willingness to trade-off attributes of a mobile application in the context of Aruba. The results from this study provide important sources of information for the developers of apps technology, destination marketing professionals and state agencies in Aruba. From the conjoint analysis, we identify that the most important attribute is the type of content information, more specifically related to services (restaurants, pubs and shopping). This, coupled with the fact that the respondents consider coupons as an important attribute, suggests that mobile apps in Aruba can have a major economic impact on business and service providers. The tourists’ preferences also indicate an inclination toward discounts that include a cash value and not a percentage discount. Moreover, tourists expect a certain level of personalization in the offering of products or services. Additionally, the tourists’ interest for consumption capabilities is also evident from the predilection of mapping services for businesses; this could indicate that a need exists to direct tourists toward businesses. Interestingly, the attribute of location awareness services is rated as the least important. Perhaps the wide availability of free Wi-Fi services on the island might be an indicator that this service is expected, as it is readily available. The specific mapping of preferences as a strategic product development approach provides a more focused and targeted opportunity to the destination to generate a more efficient allocation of scarce resources while adding value to its offerings to the tourists. Theoretical implications This study demonstrated a nascent method of analysis to identify the most desired mobile app attributes for tourists using the Tasks Technology Fit Theory in the context of a small island destination. The study has yielded great insights that have complex theoretical corollaries for the tourism literature related to technology preference and acceptance. First, the current study highlights the usefulness of conjoint analysis to map out tourists’ multi-attribute decision-making space that influences their judgment and preference of use. It has distinctive advantages over the traditional method of asking respondents to rate the importance or usefulness of each individual attribute of a
Visitors in a small island destination 2739
IJCHM 28,12
Downloaded by University of Central Florida At 13:48 13 December 2016 (PT)
2740
product. In conjoint analysis, respondents are exposed to realistic mobile apps (a combination of attributes) in realistic competitive situations, and they are asked to make choices or to simulate hypothetical behaviors. By analyzing the preferences between these different mobile apps, the implicit valuation of the individual attributes making up the app can be determined. Therefore, the uniqueness of this method is its ability to account for the psychological tradeoffs that tourists make when evaluating several attributes together. It is also able to uncover real or hidden drivers, which may not be apparent to the tourists themselves (Orme, 2010). Furthermore, conjoint analysis is able to identify specific mobile app attributes that are the most influential for tourists’ preference of use. This is a provision that attitudinal models based on measuring attitudes (e.g. TAM) cannot capture. Second, this study reports an alternate framework to look at technology acceptance based on the three tenets of TTF (individuals, task and technology). In the context of mobile app for a destination, the TTF theory bestows a comprehensive conceptual basis for identifying the important mobile app attributes using conjoint analysis (Goodhue and Thompson, 1995). A large proportion of technology acceptance literature uses TAM and its derivatives, and they share similar core theoretical bases with an emphasis on the technology itself: the usefulness and ease of use of technology predicts user’s attitude toward and intention to use the technology. However, the TTF theoretical framework provides this study a new depth by taking into consideration the contextual and task-related factors of a mobile app when evaluating tourists’ preferences of use (McFadden, 1986). Our study by no means diminishes the contribution of TAM and its derivatives to the tourism literature. Instead, it advocates for tourism scholars to further explore the complex structure of the technology preference construct based on various other aspects. Third, existing technology-related tourism literature has not yet reached a consensus on the technology preference and use between first-time and repeat visitors. Our study adds another piece of empirical evidence that these two groups demonstrate homogenous tastes and preferences, at least when it comes to a mobile app for a destination (Aruba). This finding suggests the small island destination is able to develop a tourism mobile app that has a wide appeal for different segments. Practical implications In the case of Aruba, there are three specific opportunities that mobile app design could provide to small island destination opportunities. First, the statistical significance of type of content information, coupons and mapping options suggests that the development of a mobile app should focus on fostering spending and providing more consumption-specific opportunities. This approach could in turn create a new consumption platform that could start prior to arriving at a destination and could create a new set of backward linkages. That is, the destination and local businesses could benefit from promoting specific product categories through mobile promotions. According to Hui et al. (2013), when mobile coupons have been provided for businesses that might be farther from their consumer planned path, the result could be a substantial increase in unplanned spending. In addition, the inclusion of location awareness can increase the anytime-anyplace potential of commerce opportunities through wireless devices by also allowing tourists to explore the destination while in transit and away from non-mobile computing devices (Steinfield, 2004). Finally, the strategic focus on the three main attributes should
Downloaded by University of Central Florida At 13:48 13 December 2016 (PT)
consider adding coupons to potentially drive mobile payment, or perhaps promote in-app purchases to generate more revenue opportunities (Fields, 2014). Second, as a new marketing channel, the cost related to the development and promotion of a tourism mobile application could be cancelled by seeking benefits from inside the app advertising, inside the app cross promotions and even social gaming platforms. This becomes crucial for the destination to understand which revenue model choices are more applicable for the destination (Voskoglou, 2014). For example, the combination of location-based services and mobility can potentially create target marketing and revenue opportunities through specific context-aware advertising related to the consumption of tourist-related products embedded within the app. This, however, requires the grouping of business and consumer services in a vertical and horizontal sphere, as advertising success is driven by potential traffic (Dhar and Varshney, 2011). Third, when considering the uttered revenue potentials, destination managers would need to take into consideration the choice of mobile device, more specifically its screen size capabilities. Currently, there are more than a few portable mobile devices on the market (e.g. smartphones and tablets). Opportunely for the destination, the research findings suggest that tourists have a significant preference for smartphone devices over tablets. Therefore, the challenge for mobile advertisers, due to intricacies related to exhibiting information that is both rich in content and graphical in nature, can be significantly reduced by planning accordingly during the development phase of a mobile application (Dhar and Varshney, 2011). Fourth, the fact that no significant differences were found suggests that first-time and repeat tourists can be seen as a homogeneous target market of potential users for the app. The combination of high, repeat tourists and high intentions to return to Aruba presents additional opportunities to create a mobile application that maintains the tourist engagement in all phases of their consumption with the destination (before, during and after the visit) (Wang et al., 2014). This is crucial when determining premium content to help monetize the app. Fields (2014) indicates that this also helps generate metrics for monetization by tracking average revenues per user, helps determine acquisition costs and helps estimate lifetime value. Hitherto, this section has emphasized the applied value from this study. As a concluding remark regarding the real-world application of the method used in this study, the authors would like to reference that the results from the conjoint analysis were actually contemplated and put into practice by the Aruba Tourism Board during the development of the mobile application for the destination, which is currently available for tourists (http://app.aruba.com/). Their organization benefited by avoiding unnecessary investments in attributes that were not desirable to tourists. The research also helped the organization’s marketing department team become more efficient and productive with regard to using the mobile app as a communication channel. Finally, the impact of this study is clearly manifested in the marketplace. The results of this study provided a foundation for the development of the mobile app for the destination. This app has already been downloaded more than 50,000 times and rated 4.3 of 5 by at least 400 users (https://play.google.com). If you take into consideration that total arrivals to Aruba is 900,000 tourists, and 50,000 tourists have downloaded the app, then we can agree that the results are valuable to the destination.
Visitors in a small island destination 2741
IJCHM 28,12
Downloaded by University of Central Florida At 13:48 13 December 2016 (PT)
2742
Future research and limitations Future research should consider investigating the tourist perceptions regarding the actual purchase of this type of technology; this might provide additional options for personalization and increase potential revenues. In addition, destinations should also explore the tourist preferences with regard to inside the application purchases for products and services sold at the destination. This could help expand the tourist consumption from “while on location” to “before and after” arriving at the destination (Wang et al., 2014). This could help extend the vacation experience for both first-time and repeat visitors. By replicating this type of research in other contexts or destinations, a contribution to scientific generalization through the replication effect is possible. In addition, this could broaden our understanding of the dynamics of technology preferences for tourists and generalize choice theories. Questions may rise as to the validity of the results when using a case study approach. For example, the results should not be generalized to other destinations, as they are specific to a small island destination. However, a case study approach may contribute to scientific generalizations because its main focus is analytical in that it spawns propositions (Yin, 2009). In this study, besides the propositions listed previously, the methodological model could also serve as a blueprint to other tourism destinations wishing to better understand tourists’ preferences regarding mobile apps at their destinations. Nevertheless, at the development phase of a mobile application for a destination, we recommend that all efforts should be guided toward driving participation and usage instead of revenue, as new potential economic benefits may rise by giving tourists more access to products and services, therefore increasing consumption. References Adhikari, A. (2015), “Differentiating subjective and objective attributes of experience products to estimate willingness to pay price premium”, Journal of Travel Research, Vol. 54 No. 5, pp. 634-644. Aldebert, B., Dang, R.J. and Longhi, C. (2011), “Innovation in the tourism industry: the case of Tourism@”, Tourism Management, Vol. 32 No. 5, pp. 1204-1213. Baloglu, S., Pekcan, A., Chen, S.L. and Santos, J. (2004), “The relationship between destination performance, overall satisfaction, and behavioral intention for distinct segments”, Journal of Quality Assurance in Hospitality & Tourism, Vol. 4 Nos 3/4, pp. 149-165. Basala, S.L. and Klenosky, D.B. (2001), “Travel-style preferences for visiting a novel destination: a conjoint investigation across the novelty-familiarity continuum”, Journal of Travel Research, Vol. 40 No. 2, pp. 172-182. Berger, S., Lehmann, H. and Lehner, F. (2003), “Location-based services in the tourist industry”, Information Technology & Tourism, Vol. 5 No. 4, pp. 243-256. Bouwman, H. and van de Wijngaert, L. (2009), “Coppers context, and conjoints: a reassessment of TAM”, Journal of Information Technology, Vol. 24 No. 2, pp. 186-201. Bridges, J.F., Hauber, A.B., Marshall, D., Lloyd, A., Prosser, L.A., Regier, D.A., Johnson, F.R. and Mauskopf, J. (2011), “Conjoint analysis applications in health – a checklist: a report of the ISPOR good research practices for conjoint analysis task force”, Value in Health, Vol. 14 No. 4, pp. 403-413. Brown, B. and Chalmer, M. (2003), “Tourism and mobile technology”, in Kuutti, K., Karsten, E.H., Fitzpartick, G., Dourish, P. and Schmidt, K. (Eds), ECSCW 2003: Proceedings of the Eighth
Downloaded by University of Central Florida At 13:48 13 December 2016 (PT)
European Conference on Computer Supported Cooperative Work in Helsinki, Finland, Kluwer Academic Press, Dordrecht, pp. 335-354. Buhalis, D. and Amaranggana, A. (2014), “Smart tourism destinations”, in Xiang, Z and Tussyadiah, L (Eds), Information and Communication Technologies in Tourism, Springer, New York, NY, pp. 553-564. Buhalis, D. and Licata, M.C. (2002), “The future eTourism intermediaries”, Tourism Management, Vol. 23 No. 3, pp. 207-220. Buhalis, D. and O’Connor (2005), “Information communication technology revolutionizing tourism”, Tourism Recreation Research, Vol. 30 No. 3, pp. 7-16. Buhalis, D., Leung, D. and Law, R. (2011), “eTourism: critical information and communication technologies for tourism destinations”, in Wang, Y. and Pizam (Eds), Tourism Destination Marketing and Management: Collaborative Strategies, CABI, Oxfordshire, pp. 205-224. Chen, J.S. and Gursoy, D. (2000), “Cross-cultural comparison of the information sources used by first-time and repeat travelers and its marketing implications”, International Journal of Hospitality Management, Vol. 19 No. 2, pp. 191-203. Chuang, M.C., Chang, C.C. and Hsu, S.H. (2001), “Perceptual factors underlying user preferences toward product form of mobile phones”, International Journal of Industrial Ergonomics, Vol. 27 No. 4, pp. 247-258. Croes, R. (2011), “The Small Island Paradox”, Tourism Specialization as a Potential Solution, Lambert Academic Publishing, Saarbrucken. Davis, F.D. (1986), “A technology acceptance model for empirically testing new end-user information systems: theory and results”, Doctoral dissertation, MA Institute of Technology. Dhar, S. and Varshney, U. (2011), “Challenges and business models for mobile location-based services and advertising”, Communications of the ACM, Vol. 54 No. 5, pp. 121-128. Dickinson, J.E., Ghali, K., Cherrett, T., Speed, C., Davies, N. and Norgate, S. (2014), “Tourism and the smartphone app: capabilities, emerging practice and scope in the travel domain”, Current Issues in Tourism, Vol. 17 No. 1, pp. 84-101. Fields, T. (2014), Mobile and Social Game Design: Monetization Methods and Mechanics, CRC Press, Boca Raton, FL. Finn, M., Elliott, M. and Walton, M. (2000), Tourism and Leisure Research Methods: Data Collection, Analysis and Interpretation, Harlow Publishing Company, Longman. Fodness, D. and Murray, B. (1999), “A model of tourist information search behavior”, Journal of Travel Research, Vol. 37 No. 3, pp. 220-230. Gavalas, D. and Kenteris, M. (2011), “A web-based pervasive recommendation system for mobile tourist guides”, Personal and Ubiquitous Computing, Vol. 15 No. 7, pp. 759-770. Goodhue, D.L. and Thompson, R.L. (1995), “Task-technology fit and individual performance”, MIS Quarterly, Vol. 9 No. 2, pp. 213-236. Google Mobile Planet Statistics (2013), “Activities on smartphone (ever used): the US”, available at: http://library.uvm.edu/guides/citation/ElectroAPA2011.pdf (accessed 12 September 2014). Gu, J. and Tarasewich, P. (2004), “Guidelines for handheld mobile device interface design”, The Proceedings of the 2004 DSI Annual Meeting, available at: http://citeseerx.ist.psu.edu/ viewdoc/summary?doi⫽10.1.1., 87.5230 (accessed 20 July 2015). Haid, E., Kiechle, G., Göll, N. and Soutschek, M. (2008), “Evaluation of a web-based and mobile ski touring application for gps-enabled smartphones”, in O’Connor, P., Höpken, W. and Gretzel, U. (Eds) Information and Communication Technologies in Tourism, Springer, New York, NY, pp. 313-323.
Visitors in a small island destination 2743
IJCHM 28,12
Downloaded by University of Central Florida At 13:48 13 December 2016 (PT)
2744
Hair, J.F., Anderson, R.E., Tatham, R.L. and Black, W.C. (1998), Multivariate Data Analysis, 5th ed., Prentice Hall International, London. Hammond, J. (2013), “Nine challenges to your mobile app strategy”, Information Week, available at: www.informationweek.com/mobile/9-challenges-to-your-mobile-app-strategy/d/d-id/11 09754?page_number⫽2 (accessed 12 September 2015). Hannam, K., Butler, G. and Paris, C.M. (2014), “Developments and key issues in tourism mobilities”, Annals of Tourism Research, Vol. 44, pp. 171-185. Head, M. and Ziolkowski, N. (2010), “Understanding student attitudes of mobile phone applications and tools: a study using conjoint cluster and SEM analysis”, paper presented at the 18th European Conference on Information Systems (ECIS), available at: http://aisel. aisnet.org/ecis2010/161/ (accessed 18 October 2015). Hassenzahl, M. (2001), “The effect of perceived hedonic quality on product appealingness”, International Journal of Human-Computer Interaction, Vol. 13 No. 4, pp. 481-499. Herbst, F. and Burger, C. (2002), “Attributes used by young consumers when assessing a fashion product: a conjoint analysis approach”, Journal of Family Ecology and Consumer Sciences/ Tydskrif vir Gesinsekologie en Verbruikerswetenskappe, Vol. 30 No. 1, pp. 40-45. Hsu, S.L. and Chu, F.Y. (2014), “A user study on the adoption of context-aware destination mobile applications”, International Journal of Social, Behavioral, Educational, Economic, Business and Industrial Engineering, Vol. 8 No. 7, pp. 2324-2329. Hui, S.K., Inman, J.J., Huang, Y. and Suher, J. (2013), “The effect of in-store travel distance on unplanned spending: applications to mobile promotion strategies”, Journal of Marketing, Vol. 77 No. 2, pp. 1-16. Jarvenpaa, S.L. (1989), “The effect of task demands and graphical format on information processing strategies”, Management Science, Vol. 35 No. 3, pp. 285-303. Junglas, I.A. and Watson, R.T. (2006), “The u-constructs: four information drives”, Communications of the Association for Information Systems, Vol. 17 No. 26, pp. 569-592. Keane, M. (1997), “Quality and pricing in tourism destinations”, Annals of Tourism Research, Vol. 24 No. 1, pp. 117-130. Kennedy-Eden, H. and Gretzel, U. (2012), “A taxanomy of mobile applications in tourism”, E-Review of Tourism Research, Vol. 10 No. 2, pp. 47-50. Kim, D.Y., Park, J. and Morrison, A.M. (2008), “A model of traveller acceptance of mobile technology”, International Journal of Tourism Research, Vol. 10 No. 5, pp. 393-407. Koo, L.C., Tao, F.K.C. and Yeung, J.H.C. (1999), “Preferential segmentation of restaurant attributes through conjoint analysis”, International Journal of Contemporary Hospitality Management, Vol. 11 No. 5, pp. 242-250. Kramer, R., Modsching, M. and ten Hagen, K. (2008), “Development and evaluation of a context-driven, mobile tourist guide”, International Journal of Pervasive Computing and Communications, Vol. 3 No. 4, pp. 378-399. Kuhfeld, W. (1997), “Efficient experimental designs using computerized searches”, Sawtooth Software Research Paper Series, available at: www.sawtoothsoftware.com/download/ techpap/effdesgn.pdf (accessed 13 August 2014). Kuhfeld, W.F., Tobias, R.D. and Garratt, M. (1994), “Efficient experimental design with marketing research applications”, Journal of Marketing Research, Vol. 31 No. 4, pp. 545-557. Kwon, J.M., Bae, J.I. and Blum, S.C. (2013), “Mobile applications in the hospitality industry”, Journal of Hospitality and Tourism Technology, Vol. 4 No. 1, pp. 81-92.
Downloaded by University of Central Florida At 13:48 13 December 2016 (PT)
Lai, I.K. (2015), “Traveler acceptance of an app-based mobile tour guide”, Journal of Hospitality and Tourism Research, Vol. 39 No. 3, pp. 401-432. Lamsfus, C., Wang, D., Alzua-Sorzabal, A. and Xiang, Z. (2015), “Going mobile defining context for on-the-go travelers”, Journal of Travel Research, Vol. 54 No. 6, pp. 691-701. Lee, G. and Raghu, T.S. (2014), “Determinants of mobile apps’ success: evidence from the app store market”, Journal of Management Information Systems, Vol. 31 No. 2, pp. 133-170. McFadden, D. (1986), “The choice theory approach to market research”, Marketing Science, Vol. 5 No. 4, pp. 275-297. McKercher, B., Shoval, N., Ng, E. and Birenboim, A. (2012), “First and repeat visitor behaviour: GPS tracking and GIS analysis in Hong Kong”, Tourism Geographies, Vol. 14 No. 1, pp. 147-161. Manalo, A.B. (1990), “Assessing the importance of apple attributes: an agricultural application of conjoint analysis”, Northeastern Journal of Agricultural and Resource Economics, Vol. 19 No. 2, pp. 118-124. Mistilis, N., Buhalis, D. and Gretzel, U. (2014), “Future edestination marketing perspective of an australian tourism stakeholder network”, Journal of Travel Research, Vol. 53 No. 6, pp. 778-790. Neuhofer, B., Buhalis, D. and Ladkin, A. (2012), “Conceptualising technology enhanced destination experiences”, Journal of Destination Marketing & Management, Vol. 1 No. 1, pp. 36-46. North, E. and De Vos, R. (2002), “The use of conjoint analysis to determine consumer buying preferences: a literature review”, Journal of Family Ecology and Consumer Sciences, Vol. 30, pp. 32-39. Oppermann, M. (1997), “First-time and repeat visitors to New Zealand”, Tourism Management, Vol. 18 No. 3, pp. 177-181. Orme, B.K. (2010), Getting Started With Conjoint Analysis: Strategies of Product Design and Pricing Research, 2nd ed., Research Publishers LLC, Madison, WI. Otto, J.E. and Ritchie, J.R.B. (1996), “The service experience in tourism”, Tourism Management, Vol. 17 No. 3, pp. 165-174. Poslad, S., Laamanen, H., Malaka, R., Nick, A., Buckle, P. and Zipl, A. (2001), “CRUMPET: creation of user-friendly mobile services personalized for tourism”, paper presented at the Second International Conference on 3G Mobile Communication Technologies, London, 26-28 March, available at: http://ieeexplore.ieee.org/xpls/abs_all.jsp?arnumber⫽923502&tag⫽1 (accessed 31 September 2014). Rattray, J. and Jones, M.C. (2007), “Essential elements of questionnaire design and development”, Journal of Clinical Nursing, Vol. 16 No. 2, pp. 234-243. Rivera, M.A. and Croes, R. (2010), “Ecotourists’ loyalty: will they tell about the destination or will they return?”, Journal of Ecotourism, Vol. 9 No. 2, pp. 85-103. Rivera, M., Gregory, A. and Cobos, L. (2015), “”Mobile application for the timeshare industry: the influence of technology experience, usefulness, and attitude on behavioral intentions””, Journal of Hospitality and Tourism Technology, Vol. 6 No. 3, pp. 242-257. Sawtooth Software (1997), “Conjoint value analysis (CVA): version 3.0”, Sawtooth Software Technical Paper Series, available at: www.sawtoothsoftware.com/download/techpap/cva3 tech.pdf (accessed 31 September 2014). Schwinger, W., Grün, C., Pröll, B., Retschitzegger, W. and Schauerhuber, A. (2005), “Context-awareness in mobile tourism guides–A comprehensive survey”, available at:
Visitors in a small island destination 2745
IJCHM 28,12
Downloaded by University of Central Florida At 13:48 13 December 2016 (PT)
2746
www.wit.at/people/schauerhuber/publications/contextAwareMobileTourismGuides_T echRep0507.pdf (accessed 31 June 2014). Siau, K., Ee-Peng, L. and Shen, Z. (2001), “Mobile commerce: promises, challenges, and research agenda”, Journal of Database Management, Vol. 12 No. 3, pp. 4-13. Sigala, M. (2013), “A framework for designing and implementing effective online coupons in tourism and hospitality”, Journal of Vacation Marketing, Vol. 19 No. 2, pp. 165-180. Steinfield, C. (2004), “The development of location-based services in mobile commerce”, in Preissl, B., Bouwman, H. and Steinfield, C. (Eds), E-Life after the Dot Com Bust, Springer Publishing, New York, NY, pp. 177-197. Theoharidou, M., Mylonas, A. and Gritzalis, D. (2012), “A risk assessment method for smartphones”, Information Security and Privacy Research, Springer Berlin Heidelberg, pp. 443-456. Tjostheim, I. and Fesenmaier, D.R. (2008), “Mobile devices as substitute or supplement to traditional information sources: city tourists, mobile guides and GPS navigation”, in O’Connor, P., Höpken, W. and Gretzel, U. (Eds), Information and Communication Technologies in Tourism 2008, Springer, New York, NY, pp. 324-335. Voskoglou, C. (2014), “Developer revenue models”, available at: www.developereconomics.com/ report/q1-2014-developer-revenue-models/ (accessed 12 December 2015). Wang, D., Park, S. and Fesenmaier, D.R. (2012), “The role of smartphones in mediating the touristic experience”, Journal of Travel Research, Vol. 51 No. 4, pp. 371-387. Wang, D., Xiang, Z. and Fesenmaier, D.R. (2014), “Adapting to the mobile world: a model of smartphone use”, Annals of Tourism Research, Vol. 48, pp. 11-26. Wang, D., Xiang, Z. and Fesenmaier, D.R. (2016), “Smartphone use in everyday life and travel”, Journal of Travel Research, Vol. 55 No. 1, pp. 52-63. Wehmeyer, K. and Muller-Lankenau, C. (2005), “Mobile couponing: measuring consumers’ acceptance and preference with a limit conjoint approach”, paper presented at the 18th Bled Econference-Eintegration in Action, Bled, 6-8 June, available at: https://domino. fov.uni-mb.si/proceedings.nsf/0/b49739ccb14ca7c9c12570140049a49e/$file/20 wehmeyer.pdf (accessed July 30 2015). Werthner, H. and Ricci, F. (2004), “E-commerce and tourism”, Communications of the ACM, Vol. 47 No. 12, pp. 101-105. Wingate, L. (2011), “Evaluating consumer preferences for medicare part D using conjoint analysis”, paper presented at the 13th Annual Joint Conference of the Retirement Research Consortium, Washington, DC, 4-5 August, available at: http://crr.bc.edu/wp-content/ uploads/2011/08/5_Wingate.pdf (accessed 30 November 2015). World Travel and Tourism Council (2014), “Travel and tourism, economic impact 2013-Aruba”, available at: www.wttc.org/-/media/files/reports/economic%20impact%20research/ country%20reports/aruba2014.pdf (accessed 30 January 2015). Yin, R. (2009), Case Study Research, Design and Methods, 4th ed., Sage Publications, Thousand Oaks, CA. Zarmpou, T., Drosopoulou, C. and Vlachopoulou, M. (2013), September), “Mapping the tourism mobile applications: what, how and where”, Proceedings of the 6th Balkan Conference in Informatics, ACM, New York, NY, pp. 206-212. Zipf, A. (2002), “User-adaptive maps for location-based services (LBS) for tourism”, available at: http://citeseer.ist.psu.edu/viewdoc/summary?doi⫽10.1.1., 16.7382 (accessed 30 June 2014).
Downloaded by University of Central Florida At 13:48 13 December 2016 (PT)
Further reading Buhalis, D. and Law, R. (2008), “Progress in information technology and tourism management: 20 years on and 10 years after the Internet – The state of eTourism research”, Tourism Management, Vol. 29 No. 4, pp. 609-623. Croes, R. (2006), “A paradigm shift to a new strategy for small island economies: embracing demand side economics for value enhancement and long term economic stability”, Tourism Management, Vol. 27 No. 3, pp. 453-465. Gustafsson, A., Ekdahl, F. and Bergman, B. (1999), “Conjoint analysis: a useful tool in the design process”, Total Quality Management, Vol. 10 No. 3, pp. 327-343. Hassenzahl, M. (2010), “Experience design: technology for all the right reasons”, Synthesis Lectures on Human-Centered Informatics, Vol. 3 No. 1, pp. 1-95. Kim, Y., Lee, J.D. and Koh, D. (2005), “Effects of consumer preferences on the convergence of mobile telecommunications devices”, Applied Economics, Vol. 37 No. 7, pp. 817-826. About the authors Manuel Rivera (PhD) is an Assistant Professor at the Rosen College of Hospitality Management at the University of Central Florida. His research interests include tourism impacts, consumer behavior and restaurant branding. Manuel Rivera is the corresponding author and can be contacted at:
[email protected] Robertico Croes (PhD) is a Professor, Chair of the Tourism, Events and Attractions department, and an Associate Director of the Dick Pope Sr. Institute for Tourism Studies at the Rosen College of Hospitality Management at the University of Central Florida. His areas of interest include tourist flows, destination management, tourism competitiveness, economic development performance and quality of life in developing countries and small island destinations. Yun Ying Zhong is an Assistant Professor of Hospitality Management in the College of Health and Human Services at the California State University, Long Beach. Her research interests focus on relationship and experience marketing, digital channels and tourism impacts.
For instructions on how to order reprints of this article, please visit our website: www.emeraldgrouppublishing.com/licensing/reprints.htm Or contact us for further details:
[email protected]
Visitors in a small island destination 2747


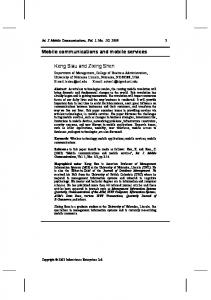


![Mobile [PDF]](https://m.moam.info/img/260x300/mobile-pdf_64a1e25e098a9ee5018b4647.jpg)