Innovare Academic Sciences
International Journal of Pharmacy and Pharmaceutical Sciences ISSN- 0975-1491
Vol 6, Issue 9, 2014
Original Article
DEVELOPMENT AND VALIDATION OF A RAPID AND SIMPLE REVERSED-PHASE HPLC METHOD FOR THE DETERMINATION OF GEMCITABINE IN HUMAN PLASMA HUGO VIDAL1, HELENA GONÇALINHO1, JOAQUIM MONTEIRO1,3, JOSÉ DAS NEVES2, BRUNO SARMENTO2,3, CARMEN DINIZ1, PAULA FRESCO1 1REQUIMTE/FARMA, University of Porto - Faculty of Pharmacy, Department of Drug Sciences, Laboratory of Pharmacology, 2Health Sciences Research Center, Department of Pharmaceutical Sciences, Instituto Superior de Ciências da Saúde -Norte, Gandra, Portugal. Email:
[email protected]
Received: 29 Nov 2013 Revised and Accepted: 01 Mar 2014 ABSTRACT Objective: In order to investigate the human plasma pharmacokinetics of dFdC, the objective of this work was to optimize and validate a rapid reversed-phase (RP) high-performance liquid chromatography (HPLC) method according to the guidelines of the international regulatory institutions: European Medicines Agency (EMA), Food and Drug Administration (FDA) and International Conference on Harmonization (ICH). Methods: Chromatographic runs were performed on a RP-ACE-C18 column. Mobile phase was constituted of sodium acetate buffer (pH 5) and acetonitrile, in gradient mode, at a flow rate of 1 mL/min. Gemcitabine and cytarabine (internal standard) were detected at 290 nm.
Results: The method was shown to be selective, linear in the range of 0.25–10 mg/L (R2=0.9998), accurate and precise within-run and between-run as reflected by the coefficient of variation values (2)were then obtained both for gemcitabine and solvent. The resulting chromatographic performance parameters of the chosen setup for validation are presented in Table 1.
Table 1: Chromatographic performance parameters of the chosen setup Chromatographic parameters Gemcitabine retention time (min) Cytarabine retention time (min) Gemcitabine resolution, R G Cytarabine resolution, R IS Gencitabine Tailing factor, T G Cytarabine Tailing factor, T IS Gemcitabine Number of theorical plates, N G Cytarabine Number of theorical plates, N IS a Presented as mean value ± standard deviation (SD).
Resulta 8.33±0.05 5.27±0.05 8.73±0.50 2.48±0.08 1.03±0.10 1.01±0.04 18522.57±4770.89 2273.75±240.65
Acceptance criteria >2 >2 0.8 - 1.2 0.8 - 1.2 N > 2000 N > 2000
Although the maximum absorption of gemcitabine has been reported to occur at 272 nm[27], as confirmed by others authors [10,11,17,18], we tested a UV wavelength range between 250 and 300 nm. The best detection was verified at a wavelength of 290 nm, where the noise signal was in fact small. The highly polar nature of the analytes causes a rapid elution from reversed-phase columns [24] even with a very low (1%) organic content in the MP.
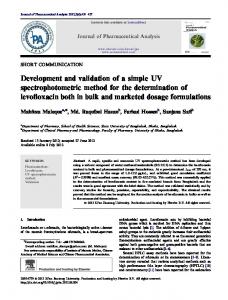
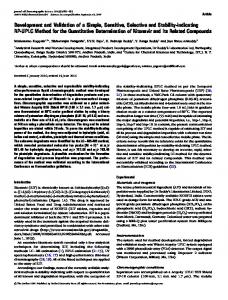
chromatogram of the stock solution of cytarabine (50 mg/L). No peaks at the retention time of gemcitabine (8.33 min) and cytarabine (5.27 min) were observed (fig. 2) and a representative chromatogram showing the separation of the analytes from the matrix is shown in fig. 3.
Therefore, several columns were tested (ACE C18 (250x4.6 mm, 5 μm particle size), Symmetry C8 (250x4.6, 5 μm particle size) and Waters Spherisorb® C18 ODS2 (150x4.6, 5 μm particle size)) and theACE C-18 column appeared to be the most suitable for use in this method. Method validation Selectivity The method selectivity was evaluated by comparing the chromatograms of six blank plasmas to the chromatogram of the calibrator used to determine the LLOQ (0.25 mg/L) and to the
Fig. 2: Representative chromatograms of human blank plasma. 61
Fresco et al.
Int J Pharm Pharm Sci, Vol 6, Issue 9, 59-65
The peak observed at 12 minutes is resultant of the matrix. Most probably being plasmatic proteins since that peak was also present in the blank plasma samples. As acceptance criteria, the absence of interfering components was validated when the signal is lower than 20% of the LLOQ for the analyte and 5% for the IS. The results obtained are presented in table 2. Overall, obtained data provides evidence that the method can be regarded as selective since no potential interfering peaks were observed. Carry-over
Fig. 3: Representative chromatograms of human plasma with internal standard (IS) and gemcitabine standard solution 5mg/L.
Carry over was not detectable in six blank samples, analyzed after the higher concentration standard solution. Carry over absence criterion: noise signal of the blank plasma should be lower than 20% of the LLOQ and lower than 5% of the IS. Obtained results are presented in table 3.
Table 2: Gemcitabine and cytarabine selectivity data Gemcitabine Selectivity
LLOQ (0,25mg/L) area Mean Value (N=6) 5167.50 Cytarabine (Internal Standard) Selectivity IS area Mean Value (N=6) 129196.33 LLOQ: Lower Limit of Quantification
20% of LLOQ area 1033.50 5% of IS area 6459.82
Blank area 657
Result < 20%
Blank Area 627.17
Result < 20%
Blank area 16
Result < 5%
Table 3: Gemcitabine and Cytarabine carry-over data
Gemcitabine Carry-over
LLOQ (0,25mg/L) Area Mean Value (N=6) 5167.50 Cytarabine (Internal Standard) Carry-over IS Area Mean Value (N=6) 129196.33 LLOQ: Lower Limit of Quantification
Lower Limit of Quantification (LLOQ) and Detection Limit (DL) The lowest concentration at which an analyte can be detected (DL) or quantified with adequate accuracy and precision (LLOQ) can be determined by different approaches [20]. In the present study, the LLOQ was firstly defined according to the expected plasmatic concentrations. As the acceptance criterion for LLOQ gemcitabine signal, that should be at least 5 times the signal of a blank sample[21]. The DL was calculated from the standard deviation (SD) of the mean value obtained from the analysis of 20 blank samples and the slope of the calibration curve, as previously described (2.7. Validation Methodology). LLOQ and DL were defined as 0.25 and 0.22 mg/L, respectively.
20% of LLOQ Area 1033.50 5% of IS Area 6459.82
Blank Area 25.17
Result < 5%
correlation coefficient: R2)by the least squares method[23]. Good linearity was considered whenR2 higher than 0.999 were obtained, accordingly to what is internationally accepted[19,24]. In addition, linearity of the regression line was evaluated by a procedure based on the residual sum of squares: taking the regression line as the mean, a RSD was calculated for all data points, revealing values