8 items - Designing a study to produce empirical results. Stage4. ⢠Assessing measurement model validity. Stage5. ⢠Specifying the structural model. Stage6.
DEVELOPMENT AND VALIDATION OF THE INNOVATION RESISTANCE MODEL ACROSS MIDDLE EASTERN COUNTRIES
By Nasir Salari
A thesis submitted to the University of Birmingham for the degree of DOCTOR OF PHILOSOPHY
College of Social Sciences Business School Department of Marketing University of Birmingham January 2013
University of Birmingham Research Archive e-theses repository This unpublished thesis/dissertation is copyright of the author and/or third parties. The intellectual property rights of the author or third parties in respect of this work are as defined by The Copyright Designs and Patents Act 1988 or as modified by any successor legislation. Any use made of information contained in this thesis/dissertation must be in accordance with that legislation and must be properly acknowledged. Further distribution or reproduction in any format is prohibited without the permission of the copyright holder.
ABSTRACT Purpose- The main purpose of this research is to develop and validate the innovation resistance model across Middle Eastern countries.
Design/ Methodology/ Approach- The solar panel is used as an example of a disruptive innovation in the Middle East. Data is collected by distributing questionnaires from 810 houshold decision makers from residential areas across three countries in the Middle East: Iran, Saudi Arabia and Jordan. The main method of analysis is Structural Equation Modeling (SEM). Findings- The results show that fatalism and traditionalism are key cultural indicators of innovation resistance in the Middle East. In addition, the prominent role of consumer innovators in reducing resistance to innovation is approved. Research Implications- None of the previous studies have developed an empirical model of innovation resistance using a wide range of forces, i.e. culture, consumer characteristics, attributes of innovation and socio-demographics. Practical Implications- Fast diffusion of innovations can be challenging within fatalistic and traditional societies. Marketers should position solar panels as a continuous innovation that fits well within the context of past experience. In addition consumer innovators as opinion leaders can influence and advise other members of a society to make a purchase decision and should be targeted by marketers.
Key
Words:
Innovation
Resistance,
Innovativeness, Middle East
II
Disruptive
Innovations,
Consumer
III
ACKNOWLEDGMENTS
I am indebted and grateful to my first supervisor, Dr. Eric Shiu, for his invaluable guidance, encouragement and support. Dr. Shiu has always been highly enthusiastic in reading and challenging my work. Without his supervision and kind support, it would not have been possible for me to carry out my research successfully. I would also like to add a note of thanks to my second supervisor, Professor Robert Cressy, for his guidance during the annual reviews. My many thanks also go to all those who have helped me in so many ways towards the completion of this thesis. Finally, I am indebted to and must thank my parents for their understanding and emotional support throughout my studies.
IV
PUBLICATIONS
Salari, N. (Forthcoming). The effect of cultural dimensions on innovation resistance. In E.Shiu (Ed.), Research Handbook on Innovation and Creativity in Management and Marketing: Routledge.
Salari, N. (2011). Consumer innovativeness and innovation resistance in the Middle East. Academy of Marketing Science Biennial Doctoral Consortium, Reims, France.
Salari, N. & Shiu, E. (2010). Developing a measurement scale for consumer innovativeness in the rarely purchased product situation [Poster]. European Marketing Academy (EMAC). Copenhagen, Denmark
Salari, N., Shiu, E. & Cressy, R. (2009). A preliminary review of the study on consumer innovativeness and innovation resistance across Middle Eastern countries. Academy Marketing Conference, Leeds Metropolitan University
V
Table of Contents ABSTRACT .................................................................................................................. II ACKNOWLEDGMENTS ........................................................................................... IV PUBLICATIONS .......................................................................................................... V LIST OF TABLES .................................................................................................. VIII LIST OF FIGURES ................................................................................................... IX CHAPTER 1- INTRODUCTION .................................................................................. 1 1.1- Introduction ............................................................................................................ 2 1.2- Research subject ..................................................................................................... 8 1.2.1- Background to solar panels............................................................................ 15 1.3- The research objectives ........................................................................................ 17 1.3.1 - Key Research Questions ............................................................................... 18 1.3.2- Research Matrix ............................................................................................. 19 1.4- Contribution to knowledge ................................................................................... 20 Chapter Summary ........................................................................................................ 21 CHAPTER 2- LITERATURE REVIEW ..................................................................... 22 2.1- Introduction .......................................................................................................... 23 2.2- The concept of innovation .................................................................................... 26 2.3- How are innovations diffused? Models of innovation diffusion .......................... 28 2.3.1- The Rogers Innovation Diffusion model ....................................................... 29 2.3.1.1- The innovation decision process............................................................. 31 2.3.1.2- The social system and innovation diffusion ........................................... 35 2.3.1.3 - Limitations of Rogers model ................................................................. 36 2.3.2- Bass model of diffusion ................................................................................. 37 2.3.3- Gatington and Robertson’s (1985) propositional inventory for diffusion ..... 38 2.4- Innovation classifications ..................................................................................... 41 2.4.1- Garcia and Calantone’s typology for identifying innovations ....................... 46 2.4.2- Bessant and Tidd’s innovation typology ....................................................... 49 2.4.3- Identifying solar panels in innovation typologies .......................................... 50 2.5-Consumer Innovativeness ...................................................................................... 50 2.5.1- Definitions ..................................................................................................... 50 2.5.2- Measuring Consumer Innovativeness ............................................................ 54 2.5.3- Critique on previously developed consumer innovativeness measure .......... 69 2.5.4- Characteristics of consumer innovators:........................................................ 71 2.6- Innovation Resistance ........................................................................................... 73 2.6.1- Psychology of innovation resistance ............................................................. 76 2.6.2- Ram’s (1987) model of innovation resistance ............................................... 79 2.6.3- Bagozzi and Lee’s (1999) model of resistance and acceptance of innovations .................................................................................................................................. 80 2.6.4- Kleijnen et al.’s (2009) model of innovation resistance ................................ 85 2.6.5- Strategies to Reduce Innovation Resistance .................................................. 86 2.7- Consumer Behaviour in the Context of Energy Use ............................................ 89 Chapter Summary ........................................................................................................ 94 CHAPTER 3 – THEORETICAL FOUNDATIONS ................................................... 96 3.1- Introduction .......................................................................................................... 97 3.2- Consumer Innovativeness and Innovation Resistance.......................................... 98 3.3- Culture and Acceptance of Innovations .............................................................. 103 3.3.1- Culture: Definitions and operationalisations ............................................... 103
VI
3.3.2- National culture and innovation adoption ................................................... 107 3.3.3- Traditionalism and acceptance of innovations ............................................ 112 3.3.4- Fatalism and acceptance of innovations ...................................................... 114 3.4- Socio-demographic Characteristics and Acceptance of Innovations.................. 115 3.5- Perceived Innovation Characteristics and Innovation Acceptance ..................... 118 3.6- Preliminary Model of Innovation Resistance ..................................................... 121 Chapter Summary ...................................................................................................... 123 CHAPTER 4 – RESEARCH METHODOLOGY ..................................................... 125 4.1- Introduction ........................................................................................................ 126 4.2- Research Philosophy........................................................................................... 127 4.3- Research Design ................................................................................................. 134 CHAPTER 5- DATA ANALYSIS: ASSESSING THE CONSTRUCT VALIDITY OF THE MEASUREMENT MODELS ..................................................................... 151 5.1-Introduction ......................................................................................................... 152 5.2- Exploratory Factor Analysis (EFA) .................................................................... 153 5.3- Confirmatory factor analysis (CFA) ................................................................... 161 5.3.1- CFA results .................................................................................................. 165 5.4- Development, validation and cross-validation of a new consumer innovativeness scale for radical and really new innovations in respective markets of infancy ......... 170 5.5- Measurement invariance of scales ...................................................................... 190 5.6- Final items .......................................................................................................... 192 Chapter Summary ...................................................................................................... 193 CHAPTER 6- HYPOTHESES TESTING ................................................................. 194 6.1- Introduction ........................................................................................................ 195 6.2- SEM analysis approach ...................................................................................... 196 6.3- SEM analysis: Iran.............................................................................................. 197 6.4- SEM analysis: Saudi Arabia ............................................................................... 205 6.5- SEM analysis: Jordan ......................................................................................... 212 6.6- SEM analysis: Middle East................................................................................. 218 6.7- Analysis of national culture on consumer innovativeness and innovation resistance .................................................................................................................... 226 6.8- Analysis of socio-demographics on consumer innovativeness and innovation resistance .................................................................................................................... 232 6.9- Summary of Results............................................................................................ 240 CHAPTER 7- DISCUSSIONS AND CONCLUSIONS............................................ 243 7.1- Synopsis .............................................................................................................. 244 7.2- Culture and Innovation Resistance in the Middle East ....................................... 245 7.3- Consumer Innovativeness and Innovation Resistance........................................ 248 7.4- Attributes of Innovation and Innovation Resistance .......................................... 249 7.5- Socio-Demographics and Innovation Resistance ............................................... 250 7.6- Conceptual, Empirical and Methodological Contributions ................................ 251 7.7- Managerial Contributions ................................................................................... 254 7.8- Limitations and Future Studies ........................................................................... 257 Appendix 1- The Questionnaire (English Version) ................................................... 259 Appendix 2- Assessing Measurement Invariance-Between Iran, Saudi and Jordan . 263 Appendix 3- Chi-Square Table .................................................................................. 266 Appendix 4 – Gender and Innovation Resistance ...................................................... 267 References .................................................................................................................. 269
VII
LIST OF TABLES Table (1) - Previous studies on antecedents of innovation adoption, consumer innovativeness and innovation resistance .................................................................... 11 Table (2)- Research Matrix: Research objectives and research questions ................... 19 Table (3)- Research matrix: literature review and its correspondence with research objectives and research questions. ............................................................................... 25 Table (4) - Innovation classifications (Garcia and Calantone, 2002) .......................... 46 Table (5) - DSI items by Goldsmith and Hofacker (1991) .......................................... 65 Table (6) - Previous consumer innovativeness scales.................................................. 67 Table (7)- Empirical studies on consumer innovativeness and innovation decisions 100 Table (8)- National culture and innovation decisions in previous studies ................. 107 Table (9)- Hofstede’s (1980) index score in the Middle East .................................... 109 Table (10)- Socio-demographics and innovation decisions: empirical results .......... 115 Table (11)- Propositions ............................................................................................ 121 Table (12)- Alternative paradigm names ................................................................... 128 Table (13)- Paradigm features ................................................................................... 129 Table (14)- Research methodologies for propositions ............................................... 138 Table (15)- Measurement scales in the study ............................................................ 142 Table (16)- Factor analysis results on Fatalism measurement scale .......................... 156 Table (17) - Factor analysis results on traditionalism measurement scale ................ 157 Table (18)- Factor analysis on general innovativeness measurement scale .............. 158 Table (19)- Factor analysis results on innovation resistance scale ............................ 159 Table (20)- Factor analysis results on relative advantage measurement scale .......... 160 Table (21)- Factor analysis results on relative advantage measurement scale .......... 160 Table (22)- Comparative CFA results: Fatalism scale ............................................... 165 Table (23)- Comparative CFA results: Traditionalism scale ..................................... 166 Table (24)- Comparative CFA results: General innovativeness scale ....................... 167 Table (25)- Comparative CFA results: innovation resistance scale ........................... 167 Table (26)- Comparative CFA results: Innovation resistance scale .......................... 168 Table (27)- Comparative CFA results: Compatibility scale ...................................... 169 Table (28)- Critical evaluation of domain-specific innovativeness scale (Goldsmith and Hofacker, 1991)................................................................................................... 172 Table (29)- Initial sample of items for the new scale ................................................ 177 Table (30) : Final items of the domain-specific innovativeness scale ....................... 186 Table (31)- Performance of the scale items across the three samples ....................... 189 Table (32)- Final scales’ items for SEM analysis ...................................................... 192 Table (33)- Sequential chi-square difference test: Iran .............................................. 203 Table (34)- Fit indices of innovation resistance model in Iran .................................. 203 Table (35)- Path estimates of innovation resistance model in Iran ............................ 203 Table (36)- Sequential chi-square difference test: Saudi Arabia ............................... 211 Table (37)- Fit indices of innovation resistance model in Saudi Arabia ................... 211 Table (38)- Path estimates of innovation resistance model in Saudi Arabia ............. 211 Table (39)- Sequential chi-square difference test: Jordan ......................................... 217 Table (40)- Fit indices of innovation resistance model in Jordan .............................. 217 Table (41)- Path estimates of innovation resistance model in Jordan ....................... 217 Table (42)- Sequential chi-square difference test: Middle East................................. 224
VIII
Table (43)- Fit indices of innovation resistance model in Middle East ..................... 224 Table (44)- Path estimates of innovation resistance model in Middle East ............... 224 Table (45)- National culture scores in Iran, Saudi Arabia and Jordan ....................... 227 Table (46)- Descriptive results within countries: General innovativeness ................ 228 Table (47)- Descriptive results within countries: Domain-specific innovativeness .. 228 Table (48)- Descriptive results within countries: Innovation resistance ................... 228 Table (49)- One-Way ANOVA results: General innovativeness .............................. 229 Table (50)- One-Way ANOVA results: Domain-specific innovativeness ................ 229 Table (51)- One-Way ANOVA results: Innovation resistance .................................. 229 Table (52) - Post-Hoc test: General Innovativeness .................................................. 230 Table (53) - Post-Hoc test: Domain-specific innovativeness .................................... 231 Table (54)- Post-hoc test: Innovation resistance ........................................................ 232 Table (55)- Regression results: Iran (age and general innovativeness) ..................... 235 Table (56)- Regression results: Iran (age and domain-specific innovativeness) ....... 235 Table (57)- Regression results: Iran (age and innovation resistance) ........................ 236 Table (58)- Regression results: Saudi Arabia (age and general innovativeness)....... 236 Table (59)- Regression results: Saudi Arabia (age and domain-specific innovativeness) .......................................................................................................... 237 Table (60)- Regression results: Saudi Arabia (age and domain innovation resistance) .................................................................................................................................... 237 Table (61)- Regression results: Jordan (age and general innovativeness) ................. 237 Table (62)- Regression results: Jordan (age and domain-specific innovativeness) ... 238 Table (63)- Regression results: Jordan (age and innovation resistance) .................... 238 Table (64)- Regression results: Middle East (age and general innovativeness) ........ 239 Table (65)- Regression results: Middle East (age and domain-specific innovativeness) .................................................................................................................................... 239 Table (66)- Regression results: Middle East (age and innovation resistance) ........... 240 Table (67)- Summary of hypotheses testing .............................................................. 240 Table (67)- Summary of hypotheses testing (continued) ........................................... 241 Table (68)- Summary of key findings ........................................................................ 244 Table (69)- The effect of traditionalism and fatalism on consumers’ behaviour towards innovation. .................................................................................................... 247 Table (70)- Socio-demographics and their influence on innovation resistance and consumer innovativeness across Middle Eastern countries ....................................... 251
LIST OF FIGURES Figure (1) - Innovation diffusion (Rogers, 1995) ........................................................ 29 Figure (2) - Adopter categorisation on the basis of innovativeness ............................. 30 Figure (3) -A model of innovation decision process by Rogers (2003) ...................... 31 Figure (4) - Growth of a new product curve ................................................................ 37 Figure (5)- A model of the diffusion process (Gatington and Robertson, 1985) ......... 39 Figure (6) – Hierarchy of innovativeness .................................................................... 53 Figure (7)- Model of innovativeness by Midgley and Dowling (1978) ....................... 57 Figure (8)- A Typology of Innovation Resistance ....................................................... 78 Figure (9) - A model of innovation resistance (Ram, 1987) ........................................ 80 Figure (10)- Model of consumer resistance to and acceptance of innovations: A goal setting process .............................................................................................................. 83
IX
Figure (11)- Model of consumer resistance to and acceptance of innovations: A goal striving process ............................................................................................................ 84 Figure (12)- Model of innovation resistance (Kleijnen et al., 2009) ........................... 86 Figure (13)- reliminary model of innovation resistance ............................................ 123 Figure (14)- Research paradigms and research process ............................................. 134 Figure (15)- Questionnaire design process (Malhotra and Birks, 2006) ................... 143 Figure (16)- Six stages in Structural Equation Modelling ......................................... 162 Figure (17)- Decision tree framework for the set of sequential chi-square difference tests (SCDTS) ............................................................................................................ 197 Figure (18)- Iran’s initial model ................................................................................ 198 Figure (19)- Final theoretical model in Iran .............................................................. 199 Figure (20)- Saturated model of innovation resistance in Iran .................................. 200 Figure (21)- Constrained model of innovation resistance in Iran .............................. 201 Figure (22)- Final model of innovation resistance in Iran ......................................... 202 Figure (23)- Initial model of innovation resistance: Saudi Arabia ............................ 205 Figure (24)- Theoretical model of innovation resistance: Saudi Arabia .................... 207 Figure (25)- Saturated model of innovation resistance: Saudi Arabia ....................... 208 Figure (26)- Constrained model of innovation resistance: Saudi Arabia .................. 209 Figure (27)- Final model of innovation resistance: Saudi Arabia.............................. 210 Figure (28)- Initial model of innovation resistance: Jordan....................................... 213 Figure (29)- Theoretical (final) model of innovation resistance: Jordan ................... 214 Figure (30)- Saturated model of innovation resistance: Jordan ................................. 215 Figure (31)- Constrained model of innovation resistance: Jordan ............................. 216 Figure (32)- Unconstrained model of innovation resistance: Jordan ......................... 217 Figure (33)- Initial model of innovation resistance: Middle East .............................. 219 Figure (34)- Theoretical model of innovation resistance: Middle East ..................... 220 Figure (35): Saturated model of innovation resistance: Middle East ........................ 221 Figure (36)- Constrained model of innovation resistance: Middle East .................... 222 Figure (37)- Unconstrained (Final) model of innovation resistance: Middle East .... 223 Figure (38)- Innovation resistance model in Middle East: Conceptual Contributions .................................................................................................................................... 252
X
CHAPTER 1- INTRODUCTION
1.1- Introduction The last decades have witnessed tremendous technological changes and seen a vast number of innovations introduced into the market. Being innovative became of highest added values for industries and fierce competition to innovate emerged. As a result of advancements in science, we have seen a large number of inventions and some turned into innovations through commercialisation. According to a report by the OECD 1 (from 2005 to 2007), 28% of firms in the U.S only under five years old registered their patents. Technology and innovations are now key factors to economic improvements and capabilities to create and knowledge exploitation are major sources of competitive advantage. Innovation has always been a path to long-term success and companies that successfully offer new products are more likely to be successful than those that do not (Reinders, 2010); as a result product innovativeness is seeing growing managerial emphasis. Despite the importance of innovations, many companies assume whatever they propose as innovations are necessarily of value and the market should adopt them; but what happens in reality is a high rate of innovation failure. Ram (1989) reports that only 10% of commercialised innovations are successful and even more recent studies confirmed high rates of innovation failure (e.g. Bredhal, 2001; Kleijnen et al., 2009). When an innovation fails, the companies are forced to take the products off the shelves. There have been many popular examples of innovation failure of which Colgate, the toothbrush brand, is one. The marketing managers at Colgate thought that introducing a Kitchen Entrées product was an innovation. The idea was that consumers could eat a Colgate meal and then brush their teeth with Colgate toothpaste
1
- Organisation for Economic Cooperation and Development
2
but it was doomed to failure (Frank and Khadder, 2012). Yet the question is: what makes an innovation a failure? The answer can be given from a variety of perspectives such as managerial capabilities, product functions and performance etc. But sometimes a big gap exists between consumers’ and companies’ perceptions of an innovation. Firms perceive product innovativeness by comparing their technology product content to competitors’ offerings and customers evaluate innovativeness based on their need to alter mental models and behavioural habits. In some instances, the alteration in consumers’ behavioural habits creates resistance and this can be one of the main reasons for innovation failure. Similar to some business practitioners’ perception about innovations, many academic studies also restrict themselves to the adoption and diffusion perspectives (Ram, 1987) or in other words some researchers have been pro-innovation biased (Ram, 1987; Klenjen et al., 2009). These studies are mostly focused on successful innovation adoption and innovation diffusion of successful innovations. There is no doubt that these studies offer value and contribute to knowledge and management but studying the factors of innovation resistance is just as important. Surprisingly, the number of studies on innovation resistance is very few. To the knowledge of the author, only five studies specifically focus on why consumers show resistance. The first is by Ram (1987), presenting a comprehensive conceptual framework on innovation resistance. Ram’s (1987) work is fundamental in understanding the possible factors of innovation resistance, which will be discussed in more detail in Chapter 2. The second relevant study is that by Ram and Sheth (1989) focused on the recommendations to cease innovation resistance. Then, in 1991, Tansuhaj et al. investigated consumer resistance to some examples of incremental innovations in cross-national context and also
3
Bagozzi and Lee (1991) developed a model of decision making process to adopt and resist an innovation. The most recent study on innovation resistance is by Kleijnen et al. (2010) presenting a framework of factors related to innovation resistance using qualitative research. Although, at the beginning, too much emphasis in literature about innovation diffusion and innovation adoption is criticised, it is not intended to assert that innovation resistance is an isolated subject from innovation diffusion and adoption, but rather that they are related and investigating innovation resistance can also contribute to the innovation diffusion literature. Innovation resistance is one of the important elements in successful diffusion of innovations. When resistance to innovations is overcome then the rate of adoption can speed up and the innovation becomes successful. However, it might take several years for an innovation to be accepted by consumers. For example, it took more than half a century for a dishwasher which was introduced in 1893 to become a mainstream product (Garcia et al., 2007). Consumer resistance is an important concept in order to gain further insight into how innovations are accepted and diffused in the market (Reinders and Hilversum, 2010). Overcoming resistance at an early stage of diffusion is crucial and can guarantee the success of innovations. However, it should be emphasised that innovation resistance and innovation adoption, proportionately, do not have an absolute correlation of -1. In other words, a person who is not manifesting resistance to an innovation does not necessarily adopt an innovation. Ram (1989, p:23) explains how studies of innovation resistance and innovation adoption differ:
4
‘The adoption and diffusion perspectives examine how an innovation spreads through the market from the time of introduction. However, if an innovation meets with resistance from consumers, the adoption process can be expected to begin only after this resistance has been overcome. If the resistance cannot be broken down, adoption slows down and the innovation is likely to fail. What the adoption and diffusion theories do not examine is this process of consumer resistance to innovations. This in turn may be attributed to the fact that a majority of the diffusion studies have only looked at successful innovations. Yet. innovation resistance may exist even in the case of successful innovations.’ Resistance to innovation may vary from passive resistance (postponement) or rejection (Baggozi and Lee, 1999 and Szgmin and Foxall, 1998) to active rebellion (or opposition) (Szgmin and Foxall, 1998). However, there is no operational measurement for the mentioned forms of resistance. The decision in this research is to follow what Ram (1989) suggests to define innovation resistance. Based on his proposition, innovation resistance is a special form of resistance to change and when consumers resist adopting an innovation, they are exhibiting resistance to innovation. Resistance to innovation has two facets: perceived risk and habit. Perceived risk is the risk that a consumer perceives when adopting an innovation (i.e. social risk, functional risk, economic risk, psychological risk) and habit refers to the customers’ reluctance to change from the current practice or routine to which he had become accustomed (Ram, 1989). Apart from the fact that overcoming innovation resistance is crucial in the success of innovation diffusion, another interest in this research is investigating how consumer innovativeness contributes to innovation resistance. Researchers have paid insufficient
5
attention to how innovativeness of consumers impacts on the degree of innovation resistance but instead a good deal of effort has been made to investigate the role of consumer
innovativeness
in
the
innovation
diffusion
process.
Consumer
innovativeness is a central element in the early stage of innovation diffusion. If we consider the process of diffusion, it can be described as the initial adoption of an innovation by early adopters and over time, subject to innovation matching the consumers’ needs, the adoption rate takes off and reaches a climax of sales units. In the diffusion process, those individuals who adopt an innovation earlier than others are labelled ‘innovators’ or ‘consumer innovators’ by Rogers (2003). Although ‘the earliness of adoption’ is criticised by some researchers as the method of identifying innovators, the concept is still of crucial importance and no matter of methodology, the innovators can play a vital contribution in speeding up the rate of adoption as they can influence others’ adoption decisions. Given the prominent role of consumer innovativeness in the adoption process, it is of interest in this research to investigate whether consumer innovativeness has an impact on innovation resistance. Investigating the antecedents of innovation resistance has valuable practical implications. For some businesses, slow take-off of innovation is pejorative but slow innovation is not always a bad thing. Slow innovation can give businesses an opportunity to think and respond effectively over time. The lesson which can be learnt is that it takes a long time to accept an innovation (Hoffer, 2009). For instance, the MP3 player took 20 years to challenge compact disc technology. If we can identify and understand the factors of innovation resistance, then appropriate strategies can be used to stop resistance and increase the rate of adoption. Yet the main question is: ‘what factors make consumers resistant?’
6
Consumers’ resistance to innovation is certainly a type of behaviour and it has been suggested as one of the main drivers of human behaviour is culture (Jobber, 2006). It can be asserted that there is almost no study reporting culture as an ineffective factor on behaviour. Thus it is logical to assume that culture is of course one of the influential factors on the innovativeness and resistance of consumers. So, what is meant by culture and what aspects of culture are influential? Detailed explanations about cultural definitions and operationalisations are given in Chapter 3 but to explain this briefly here, one reason for resistance is rooted in the conservativeness of individuals which can be manifested in traditions and beliefs in fate; so in the case of innovators, traditionalism and fatalism are looser than others. The national culture of a country also contributes to the degree of individuals’ innovativeness and resistance. This will be discussed more in Chapter 3 to enable a comprehensive view, considering culture at both national and individual levels. Culture is of the most significant drivers of consumer behaviour toward innovative products (also known as innovation decisions) but it is not the sole factor. Previous studies have identified other related factors in innovation decisions (i.e. innovation adoption, innovation resistance) such as the characteristics of innovations, the personality of consumers and socio-demographic elements. Whether an innovation can offer more advantages than similar products together with the degree of complexity and compatibility can determine the success of innovation. Consumers can show resistance if the innovation is complex, not compatible with their lifestyle and traditions and has no superiority to existing products. Personality traits and demographic characteristics are other factors in innovation decisions. For example, consumer innovativeness is a personality trait (Baumgartner
7
and Steenkamp, 1996; Raju, 1980; Vandecasteele and Geuens, 2010) and can be influential in resistance behaviour. Innovativeness of consumers is the most studied characteristic of consumers in innovation adoption. Those who are innovators are manifesting high exploratory behaviour toward innovation (Raju, 1980); show more openness to new experiences (Leavitt and Walton, 1975); manifest risky and innovative product purchases and have extensive knowledge about new products (Baumgartner and Steenkamp, 1996). With these personality characteristics of consumer innovators, it is expected that consumer innovativeness can be a driver of innovation resistance. Yet this relationship has neither been studied empirically nor even conceptually. Instead, a good deal of effort has been devoted to test the relationship between consumer innovativeness and adoption of products. One of the purposes of this research is the investigation of the relationship between consumer innovativeness and innovation resistance. Finally, in terms of demographic characteristics, innovators are proclaimed to be young, high income, highly educated and residing in cosmopolitan areas (Rogers, 2003); this is discussed further in section 2.7.4. Regarding the scarcity of research in the field of innovation resistance, it is worth excavating our understanding of why consumers show resistance towards innovation by establishing a model to investigate all mentioned possible factors contributing to innovation resistance. Further explanations are presented in the following section.
1.2- Research subject Existing models of innovation resistance are either purely conceptual or in the case of the existence of empirical models, such as Kleijnen et al. (2009), only qualitativebased. Ram’s (1987) model of innovation resistance is a conceptual comprehensive
8
model consisting of three main factors of innovation resistance: consumer characteristics, innovation characteristics and propagation characteristics. Despite the usefulness of model in understanding innovation resistance, it has never been empirically examined. Practically, empirical examination of Ram’s (1987) model is very difficult as it consists of 32 variables (Figure 9 in Chapter 2). Bagozzi and Lee’s (1991) model, although very valuable in understanding the mental process by which individuals make decisions toward innovation, cannot be considered as a model of innovation resistance but rather a decision making model. Moreover, it is again purely conceptual. The model will be presented in Chapter 2 as it provides a good understanding into how resistance can occur in each stage of the decision making process. Later, Kleijnen et al. (2009) developed a model of innovation resistance using literature review and qualitative method. The model is a very well attempted empirical model but it has three major drawbacks: (1) the model considered only two factors for innovation resistance, one is the degree of change required and the other is innovation’s conflicts with consumers’ prior belief structure. The first relates to habits of consumers and the second relates to their traditions. Thus the model uses only consumer dependent variables and ignores the perceived attributes of innovation; (2) the relationship between variables in the model has never been tested by quantitative technique. The sample size in qualitative method is rather small and developing a model only based on this does not guarantee validity; (3) cultural dimensions are not fully captured in their model. Although tradition is an important aspect of culture, it is not enough to explicate culture. Culture is a very complex subject and using only one dimension cannot solve this issue.
9
This calls for a comprehensive and also a practical model of innovation resistance which can be tested empirically using quantitative methods with reasonably large sample size. In order to have a better statistical estimation it is better to develop a model which can simultaneously examine a series of interrelated dependence relationships between the constructs. This method of analysing is called Structural Equation Modelling (SEM) (Hair et al., 2006). Though the main concern in this research is innovation resistance, reviewing the literature in the innovation adoption subject can be helpful in developing a conceptual framework for innovation resistance. Based on Table (1), in general, consumers’ decisions toward innovations are categorised into three general categories: (1) whether consumers show an actual adoption of a product (innovation adoption); (2) whether consumers are willing to enquire, learn about, try and/or adopt new products (consumer innovativeness); and (3) whether consumers show resistance to innovations (innovation resistance). Almost the same categories were suggested in the Bagozzi and Lee (1999) innovation decision model which will be presented later. Among the three mentioned categories, as evident in Table (1), most previous studies focus on positive decision making toward innovations and so much focus was given to study innovation adoption.
10
Table (1) - Previous studies on antecedents of innovation adoption, consumer innovativeness and innovation resistance Year
1991
Author(s)
Tansuhaj et al.
Predictors
Dependent
Product
variables
example
Perceived risk,
Innovation
Technical
Canonical
fate, religious
resistance
products,
Correlation
commitment and
media
tradition
products,
Methodology
entertainment products, fashion products 1981
Labay and
Perceived
Comparing
Solar panels
Multivariate
Kinnear
attributes of
adopters and non-
nominal scale
innovation and
adopters
analysis and
demographic
multiple
variables
discriminant function
1999
Steenkamp et al.
Socio
Consumer
N/A
Hierarchical
demographics,
innovativeness in
Linear
Personal values,
general
Modelling
National culture 2003
Im et al.
Socio-
New product
10 consumer
SEM
demographics,
adoption
electronic
innate consumer
behaviour
products
Socio-
Innovation
Online
Logistic
demographics,
Adoption
banking
Regression
Consumer
N/A
ANOVA
innovativeness 2004
Lassar et al.
domain-specific consumer innovativeness 2006
Singh
National culture
innovativeness in general 1974
Ostlund
Perceived
Consumer
Self-layering
Discriminant
attributes of
Innovativeness
dessert mix
analysis
Consumer
Innovation
N/A
Conceptual
characteristics,
Resistance
innovation, personal characteristics 1987
Ram
innovation characteristics,
11
study
propagation characteristics 2009
Hoffmann and
Specific need for
Domain-specific
Automotive
SEM
Soyez
cognition,
Innovativeness
interior
Demographics,
Intention to adopt
N/A
Meta-analysis
perceived
innovations
SEM
frequency of use, usage of specific media, domainspecific opinion leadership 2011
Arts et al.
characteristics of innovation, innovativeness 2006
Hirunyawipada
Consumer
New product
Electronic
and Paswan
innovativeness,
adoption
products
N/A
perceived risk 2010
Bartels and
Innate and
Innovative
Reinders
domain-specific
behaviour
Conceptual study
consumer innovativeness 2009
Kleijnen et al.
Degree of change,
Innovation
conflict with
resistance
N/A
Conceptual study
consumers’ belief structure 1982
Tornatzky and
Characteristics of
Innovation
Klein
innovation
adoption
N/A
Meta-analysis
Reviewing Table (1) leads to a conclusion that the predictors of whether consumers adopt or resist innovation can be categorised into four factors: (1) perceived characteristics of innovation, (2) socio-demographics (3) national and individual culture and (4) personality traits (consumer innovativeness). None of the previous studies investigated all four factors in one study and in a structural model. So it is worth carrying out research investigating the relationship of all mentioned four factors simultaneously in a structural model with innovation resistance.
12
The next question is what product category and target population should be selected. Examples of products in Table (1) are all incremental: innovations that possess small improvements in existing products, with the exception of Labay and Kinnear (1981) which used solar panels as a really new/disruptive innovation; innovations that are developed as a result of discontinuity in either technology or marketing aspects (Garcia and Calantone, 2002). Using the term, Really New Innovation, despite academic support (e.g. Garcia and Calantone’s work), may cause uncertain understanding for the readers. In author’s belief, the term ‘very new innovation’ can be more comprehensible. In this thesis, both really new and disruptive innovations are sometimes used intercheangably. More discussions are presented in section 2.6. Despite this argument, the innovation studies on really new/very new and radical innovations are rare. Moreover, the context of most studies is within the U.S. or Europe; given the fact that cultural variables are to be used in this study, choosing a target population other than the U.S. and Europe can provide a new perspective in studying consumer behaviour toward innovative products. The Middle East is chosen in this research because studies on consumer behaviour in this area are very limited. In terms of product category, the solar panels is selected for three reasons: first, this product is a good example of a very new innovation (based on Garcia and Calantone’s typology) and studies in this product category are rare; second this product is in its infancy in the Middle East and consumer innovativeness and innovation resistance has never been studied for really new (or even radical) innovations in their infancy (Goldsmith and Hofacker, 1991); third, the degree of discontinuity of really new innovation is higher than incremental innovations (Garcia and Calantone, 2002) and using really new (or radical) innovations requires more change in lifestyle of
13
consumers, thus choosing this product can be a good example to investigate why consumers show resistance rather than choosing an incremental innovation such as mobile phones. There are several differences between this study and Labay and Kinnear (1981), who used a similar product. Firstly, this study uses innovation resistance instead of a comparison between adopters and non-adopters. A solar panels in the Middle East is very new for residential purposes and it is not easy to measure the actual adoption in these countries. Moreover this study takes the negative side of decision making toward innovation and prefers to study innovation resistance than innovation adoption. Secondly, this study assumed more predictors than Labay and Kinnear (1981) who used only socio-demographics and innovation characteristics. Thirdly, the methodology in this study is structural equation modelling and it offers more advantages than the methodology in Labay and Kinnear (1981). Given the product example that is to be used in this research, which is a very new innovation, a gap exists in the literature in the lack of an appropriate scale capable of measuring consumer innovativeness in this product category at the infancy stage. All product categories used in the studies of consumer innovativeness are incremental innovations (i.e. mobile phones, rock albums, fashion products) and innovativeness of consumers within incremental innovations is measured using the actual and anticipated behaviour (Goldsmith and Hofacker, 1991), therefore existing consumer innovativeness scales cannot be applied in the case of products which are at the very early stage of the life cycle with no history of purchase (i.e. solar panels in the Middle East). Consequently, a suitable consumer innovativeness scale will be developed and
14
validated. The process of scale development and validation will be explained in Chapter 5. To sum up, a conceptual model of innovation resistance will be developed in this research and the following variables will be used: (1) perceived innovation characteristics as independent variables (relative advantage, compatibility and complexity); (2) national and individual culture as independent variables (individualism, uncertainty avoidance, traditionalism and fatalism); (3) sociodemographics (age, gender, education) as independent variables; (4) consumer innovativeness as a personality trait at general and domain-specific levels acting as both independent and dependent variables and (5) innovation resistance as a dependent variable. The conceptual model to be established takes concepts from different areas in marketing, such as consumer behaviour (innovation resistance as a special type of consumer behaviour) and innovation diffusion (innovation adoption and the role of consumer innovativeness). 1.2.1- Background to solar panels A solar panels is a packaged, connected assembly of photovoltaic cells which uses energy from the sun to generate electricity. The package has applications in industrial and residential purposes. In this study, only the residential purposes are considered. Two types of solar panels can be used for home applications. One is solar photovoltaic (Solar PV) which uses energy from the sun to generate electricity at home and which can also be exported to the grid. Another type is solar water heating which uses energy from the sun to heat up water. The average estimated cost of a Solar PV is £7000 and for solar hot water is £3000 in the UK, however the price might vary depending on size and manufacturer. Each solar PV panel typically has an
15
area of around 1.2 to 1.8 square meters, depending on the manufacturer, and will produce about 180-250 Watts. The advantages of using solar panels are using clean energy and saving energy bills but the disadvantages are high initial setup costs and maybe a large installation area is required. According to what producers of solar panels claim, the panels can withstand wind and rain and are durable for at least 25 years. According to the U.S. Department of Energy, the discovery of the photovoltaic (PV) effect came in 1839 by a French scientist; the idea was then further developed in laboratories until 1954 when photovoltaic technology was born in the U.S. In 1955, early products were developed which included PV-powered dollar bill changers and devices that decoded computer punch cards and tape. From the 1970s onward, the use of solar energy became more widespread and solar panels were used for residential purposes in the U.S. The use of solar energy in Middle Eastern countries began later than in the U.S. and European countries. The renewable energy organisation in Iran, known as SUNA, was registered in 2000 as a government company aimed at developing energies from renewable resources. Leading energy companies in Iran, such as FARAN, introduced solar products in 2003; however the main market is industries. Solar panels for residential purposes is a very new concept and it is at the very early stage of the product life cycle. This situation is almost the same in the Arab countries in the Middle East. Saudi Arabia, as the largest producer of crude oil, is seeking investors to invest $109 billion to create a solar industry that generates a third of the nation’s electricity by 2032. According to a report by Bloomberg (2012), Persian Gulf oil producers are seeking to reduce their reliance on fossil fuels for power generation to
16
maximize exports of valuable crude. Saudi Arabia’s peak electricity demand will reach 121,000 megawatts in the next 20 years.
1.3- The research objectives The overall aim of this study is to develop a new model of innovation resistance to be examined in the Middle East based on the solar panels as an example of a very new innovation. Starting from this overall aim, the following research objectives are introduced, which arose from review of contemporary literature about innovation diffusion, consumer innovativeness and innovation resistance. The research results provide a platform on which a practical and examined model of innovation resistance can be developed and which fill a gap in the research. In particular, the research objectives are formulated as follows: 1- To identify and critically evaluate the factors influencing consumer resistance to innovation in the Middle East. 2- To develop and validate a scale to measure consumer innovativeness for very new/ really new products in the case of respective market infancy. 3- To propose appropriate strategies to overcome innovation resistance. Referring to objective one, based on findings in previous studies, a conceptual model of innovation resistance is developed and considered the following variables as antecedents: (1) culture at national and individual level; (2) attributes of innovations; (3) consumer innovativeness; and (4) socio-demographic variables. In the model, consumer innovativeness is considered as an antecedent of innovation resistance but it is also considered as a dependent variable where conceptual links to it will be established from cultural and socio-demographic variables. This will be elaborated
17
further in Chapter 3. The conceptual model will be empirically examined across three countries in the Middle East, namely Iran, Saudi Arabia and Jordan then the results compared between countries to observe the differences between them. The selection of these countries is made in light of both economic and cultural factors. Since the product choice of this research deals with resistance to adopt a new energy system, it is deemed to be important to select both oil producer and non-oil producer countries so that the results can reflect the input of both sides. Iran and Saudi Arabia are oil producing countries while Jordan does not produce oil. Apart from economic differences, these countries, despite many similarities, are different in some cultural aspects. Specifically, the interpretation of fatalism between Shia and Sunni individuals might be different. Therefore two Sunni countries and one Shia country are selected to reflect diversity of cultures. After witnessing a partial invariance between measures in the model, it is permissible to combine all data in three countries and examine the model representing all three countries. Referring to objective two, a scale will be developed to measure consumer innovativeness for really new innovation scenarios in the respective markets of infancy so that scale can be used in the model. The scale is tested for reliability and validity. Finally, for the third objective, based on the identified factors of resistance toward innovation, appropriate solutions are given to cease the resistance and this is presented in the concluding chapter. 1.3.1 - Key Research Questions The abovementioned research objectives lead to the following research questions: 1- What factors are influential in making consumers resistant toward innovations? 1.1- Does consumer innovativeness impact on resistance to innovation?
18
1.2- Do innovativeness and resistance of consumers to an innovation differ based on national cultural characteristics? 1.3- How does culture contribute to the model of innovation resistance? 1.4- How do socio-demographic characteristics of consumers contribute to the model of innovation resistance? 2- How does consumer innovativeness in really new/very new innovations differ from other types of innovations? 3- Which implications can be derived to overcome innovation resistance? 1.3.2- Research Matrix In Table (2), a research matrix is provided explaining the different stages of the research carried out. The research matrix presents a road map for the research interlinking the formulation of the overall aim and objectives, the definition of propositions, the identification of the contribution to knowledge, the selection of adequate research methods and techniques as well as the links to the final model factors. Additionally, it will be a guideline for readers following the research process. In the first research matrix, the linkage between research objectives and research questions is illustrated. This matrix will be updated through the chapters. Table (2)- Research Matrix: Research objectives and research questions
Overall Research Aim
Research objectives
Key Research Questions
To identify and critically evaluate crucial factors influencing consumer resistance to innovation in the Middle East.
1
What factors are influential in making consumers resistant toward innovations in the Middle East?
2
To develop and validate a scale to measure consumer innovativeness in case of really new/radical innovation in the
2
How does consumer innovativeness in really new innovations differ from other types of innovations?
To develop a model of innovation resistance based on solar panels as an example of a really new innovation to be examined across Eastern Middle countries.
1
19
3
respective markets of infancy. To propose appropriate strategies to overcome innovation resistance.
3
Which implications can be derived to overcome innovation resistance?
1.4- Contribution to knowledge It is a fact that the rate of innovations introduced to the markets is high but product innovativeness, in contrast to many public beliefs, does not guarantee success. In most scenarios a gap exists between companies’ perception of innovations and consumers’ perception. Companies assume that their innovation is distinguished from other similar products and provides added value but consumers do not always have the same perception. Sometimes, an incremental innovation which is developed as a result of trivial improvements over the previous version is perceived as a radical change by consumers. Companies’ unfamiliarity with consumers’ belief structure is problematic and this situation becomes worse when a new product is intended to be introduced into a foreign market, given the cultural complexities. In the case of introducing solar energy products into a completely new market like the Middle East, the vital question is whether consumers are resistant to this product or not. This study endeavours to contribute to business practitioners aiming to introduce disruptive innovations into new markets by investigating the conceivable factors of resistance and in the end providing recommendations. Theoretically, this study could add insights to the findings in the innovation studies by performing the following: (1) The final proposed model of innovation resistance is the first one which is examined empirically using the SEM technique. This model is also validated
20
cross-nationally in the Middle Eastern area and regarding its cultural differences compared to Europe and U.S, the results can provide new insights. (2) Unlike previous empirical models of adoption Table (1), this study conceived more constructs and dimensions in the model. There is no study to investigate the effect of cultural variables, attributes of innovations, socio-demographics and consumer characteristics simultaneously in an innovation decision model. (3) The lack of scale to measure consumer innovativeness in really new/disruptive innovations at an infancy stage propelled an effort to develop and validate one. The author encourages this scale to be applied in similar product scenarios.
Chapter Summary In this chapter the topic of the research was introduced. It was discussed why the chosen topic is worthy of PhD research and how it can contribute to knowledge. It was identified that a practical and empirical model of innovation resistance is required to identify what factors contribute to innovation resistance. The research objectives will be examined as a form of conceptual model across three countries in the Middle East and furthermore how the factors of innovation resistance differ across Middle Eastern countries.
21
CHAPTER 2- LITERATURE REVIEW
22
2.1- Introduction The purpose of this chapter is to review the relevant previous studies to the research topic. The ultimate goal of this research is to develop and validate a model of innovation resistance and, to accomplish this goal, relevant streams of research should be used. This chapter begins with the concept of innovation and how innovations are classified. Then the literature review process moves to how innovations are diffused and what the elements of diffusion are. The concept of consumer innovativeness and its operationalisation will be the third stream of literature and finally this chapter will end with the concept of innovation resistance and previous models. For the first stream of literature, it is necessary to embark on with the concept of innovation, how this term was conceptualised in previous studies and what the characteristics of innovative products are. By exploring the concept of innovation, it will be possible to verify whether the product example which will be used in this study is consistent with the definition of innovation. Another important question is to know how innovations are classified and identified in the literature. Knowing this is useful since types of innovations have different influences on consumer behaviour and dispositions. Moreover, a justification should be made on categorizing solar panels as a ‘really new/very new’ innovation so it is related to the second research objective in Chapter 1 which is developing a consumer innovativeness scale for really new innovations in a respective market infancy scenario. In the second step, the review of literature will be shifted to how innovations are diffused. When an innovation is introduced to a market, it is crucial to understand how, why and at what rate the innovation spreads through cultures. A good deal of
23
effort has been made in the last four decades to answer this important issue from a variety of perspectives. The issue was addressed by Rogers (1962) with his theory of innovation diffusion. In his definition, diffusion is the process by which an innovation is communicated through certain channels over time among the members of a social system. Therefore there are four elements in the innovation diffusion: (1) an innovation; (2) communication channels; (3) time/rate of adoption; and (4) members of a social system. So, in the case of low rate or slow adoption of an innovation (which refers to innovation resistance), it should be scrutinized how each of the other elements of diffusion contributes to this. Do the characteristics of an innovation (the first element) have an impact on resistance of consumers? Or is the innovation not communicated through appropriate channels in the society? (Second element). Or are the characteristics of consumers (fourth element) influencing in resistance? Or maybe all of these elements? In particular, the influence of some elements of innovation diffusion on innovation resistance has been of interest to researchers (i.e. Ram, 1987 and 1989; Ostlund, 1979) and this makes it more clarified how innovation diffusion literature can contribute to the ultimate goal of this research, that of developing and validating a model of innovation resistance. In this study, the effect of communication channels on innovation resistance is not investigated in the proposed model. This decision is made based on the grounds that enough consideration is given by previous scholars to this topic (e.g. Mahajan, 1984; Richins 1983; Ram, 1987; Bayus et al., 1985; Midgley and Dowling, 1993; Price et al., 1987). Moreover, inclusion of this element will oblige more variables in the conceptual model resulting in complexity and achievablity of the research. The more variables, the larger the sample size and as a consequence more effort and budget are required.
24
The effect of the other two elements – innovation characteristics (the first element) and consumer characteristics (the fourth element) – is a specific interest in this study. Three models of innovation diffusion will be discussed in this chapter. Rogers (1962), Bass (1969) and Gatington and Robertson (1985) are examples of innovation diffusion models providing fundamental understanding on how innovations are diffused in a system. Some conceptual relationships in Rogers and Gatington and Robertson’s model provide useful directions in developing the conceptual model in this research. Also, through Bass’s (1969) model, justifications can be made as to why current measurement scales of consumer innovativeness cannot be applied to the solar panels category. Thirdly, the concept of consumer innovativeness will be introduced. Innovativeness of consumers has been shown to be one of the main drivers of innovation decision behaviour. There are some issues in defining and operationalizing consumer innovativeness which will be discussed in this chapter. Finally, this chapter will conclude with relevant studies to model innovation resistance. There are fewer studies on innovation resistance than on innovation adoption, but there are some valuable studies on the conceptual model of innovation resistance which will be presented in this chapter. Table (3) explains how each stream of literature corresponds to research objectives and research questions.
Table (3)- Research matrix: literature review and its correspondence with research objectives and research questions. Overall Research Objectives Key Research Questions Relevant Research Aim Literature
25
To develop a model of innovation resistance based on solar panels as an example of a really new innovation to be examined across Middle Eastern countries.
1
To identify and critically evaluate crucial factors influencing consumer resistance to innovation in the Middle East.
1
What factors are influential in making consumers resistant toward innovations in the Middle East?
2
To develop and validate a scale to measure consumer innovativeness in the case of really new/radical innovation in the respective markets in infancy. To propose appropriate strategies to overcome innovation resistance.
2
How does consumer innovativeness in really new innovations differ from other types of innovations?
3
Which implications can be derived to overcome innovation resistance?
3
Innovation diffusion literature (i.e. Existing models of innovation diffusion and innovation decision process); innovation resistance literature Consumer innovativeness literature.
Innovation resistance literature
2.2- The concept of innovation Certainly a scientist’s view of innovation is different to that of normal individuals. In most members of the public’s belief, innovations is about the occasional spark of brilliance. Anthony (2009) says people mistakenly believe that innovation is synonymous with creation and they may not distinguish between invention and innovation. Invention is something that did not exist before and innovation is about putting an invention to work. Therefore invention does not become an innovation until it has processed through production and marketing tasks and is diffused into the marketplace; thus innovation provides economic value. The following equation shows the relationship between innovation and invention: Innovation = theoretical conception + technical invention + commercial exploitation (Trott, 2008).
26
A plethora of definitions exists for innovation in the extant literature. Some scholars define innovation as ‘an idea, practice or object that people see as different’ (Zaltman & Wallendorf, 1983; Rogers, 1983; Ram, 1987). Therefore what determines the reaction of individuals towards innovation is their perceived newness of the idea. Luecke and Katz (2003) wrote that: ‘Innovation . . . is generally understood as the successful introduction of a new thing or method . . . Innovation is the embodiment, combination, or synthesis of knowledge in original, relevant, valued new products, processes, or services’. The term ‘new’ is further clarified by Rogers and Shoemaker (1972) as follows: ‘It matters a little, as far as human behaviour is concerned, whether or not an idea is ‘objectively’ new as measured by the lapse of time since its first use or discovery …. If the idea seems new and different to the individual, it is an innovation’. Koulopolos (2009) believes that innovation is about taking something that exists and aligning it with market needs. It is also about how you understand the behaviour of the marketplace and not sticking to your business model when the market resists. OECD defines innovation as ‘An iterative process initiated by the perception of a new market and/or new service opportunity for a technology based invention which leads to development, production, and marketing tasks striving for commercial success of the invention’. What is meant by iterative process is that products will be developed over time in a predictable manner with initial emphasis on product performance, then emphasis on product variety and later emphasis on product standardisation and costs (Utterback and Abernathy, 1975). The iterative process implies varying degrees of product innovativeness which leads to different innovation types. The innovation types will be discussed in section (4). Product Innovation is defined as a “good or
27
service that is new or significantly improved” (Garcia and Calantone, 2002). This includes significant improvements in technical specifications, components and materials, incorporated software, user friendliness or other functional characteristics. Technological innovations are those that embody inventions from the industrial arts, engineering, applied science and/or pure science. What is clear from all the definitions proposed above is that innovations should be viewed as a process not simply as an outcome or an event, because the process starts with the invention or new discoveries and the innovations are eventual outputs from the invention (Trott, 2008).
2.3- How are innovations diffused? Models of innovation diffusion After conceptualisation of the term ‘innovation’, the next step is to discuss how innovations are diffused and what the elements of diffusion are. Innovation diffusion is perhaps the most widely researched area in the social science phenomena (Mahajan and Peterson, 1985). The diffusion process of innovations was first introduced by Rogers (1962) and then further enhanced and modified by Bass (1969) and Gatington and Robertson (1985). These models are instrumental in understanding how innovations are diffused and are useful in this study. First, the Rogers (1962, 2003) model will explain how innovations are diffused, what the elements of diffusion are how innovations are diffused in a society. Then the diffusion model of Bass (1969) and Gatington and Robertson (1985) will be provided. It will be discussed how innovation resistance and consumer innovativeness are placed within these models.
28
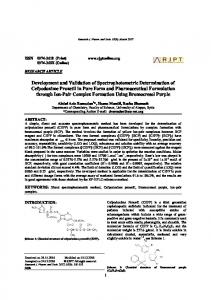
2.3.1- The Rogers Innovation Diffusion model Based on the model presented in Figure (1), if the temporal pattern of innovation diffusion is plotted, the result can be generally described in the form of an ‘S’ shaped (sigmoid) curve. The reason is due to the fact that initially only a few members of society adopt an innovation. Over time, as the process continues to unfold, more individuals adopt the innovation. In the end, the trajectory of the innovation curve slows and begins to level off and it reaches an upper asymptote where the diffusion is complete at this point (Mahajan and Peterson, 1985). Figure (1) - Innovation diffusion (Rogers, 1995)
The two dependent variables used in this study, consumer innovativeness and innovation resistance, are central in the innovation diffusion process. Innovativeness of consumers, which will be further explained in section (2.7), is mainly about consumers’ willingness to adopt or try innovation earlier than others in this model (Rogers, 2003). Innovativeness can be depicted at the early stage of diffusion. Rogers
29
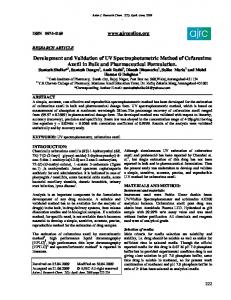
explains that adopters can be categorised into five categories that are named innovators, early adopters, early majority and laggards (Figure (2)). Figure (2) - Adopter categorisation on the basis of innovativeness
Source: Rogers (2003) Based on Figure (2), the diffusion of innovations is normally distributed due to personal interaction with other members of a social system. Rogers (2003, p.244) states that: ‘Many human traits are normally distributed, whether the trait is physical characteristics, such as weight or height, or a behavioural trait such as intelligence or the learning of information. Hence, a variable such as innovativeness might be expected to be normally distributed’. According to Figure (2), innovators can be depicted in the beginning of the bell shaped curve, which is the first 2.5% of adopters. This approach of identifying innovators has some limitations which will be further discussed in detail in section (2.7.2). However, consumer innovators, regardless of the methodology to identify them, are still important. Companies can rely on the revenue generated from innovators when they introduce an innovation. Innovation resistance is also key in the diffusion process. Based on the definition of innovation diffusion when a society shows a resistance against an innovation, this
30
means that the innovation is negatively communicated between members of societies as diffusion is ‘a special type of communication’ (Rogers, 1995: p.6) and the rate of adoption is low resulting in slow take off of the curve. Now the question is: how do individuals make decisions about innovations? This is a complex phenomenon in human behaviour; however Rogers (2003) tried to conceptualise the decision process as follows. 2.3.1.1- The innovation decision process The innovation decision process is the process by which an individual passes from the first knowledge of an innovation, to the formation of an attitude toward the innovation. Rogers (2003) conceptualised five stages in the innovation decision process as in Figure (3): Figure (3) -A model of innovation decision process by Rogers (2003)
In Rogers’ explanations, the innovation decision is not an instantaneous act but rather a process occurring over time and comprising different actions. Rogers (2003) defines the innovation decision as 31
“The process through which an individual (or other decision maker unit) passes from gaining initial knowledge of an innovation, to forming an attitude toward the innovation, to making a decision to adopt or reject, to implementation of the new idea, and to confirmation of this decision”. The process consists of a series of choices over time. While dealing with uncertainties associated with the newness, individuals evaluate the innovation and make their final decision: 1- Knowledge: occurs when individuals realise that the innovation exists and they get information about how it functions. The knowledge is gained through communication channels. Unusually, individuals do not expose themselves to messages about an innovation unless they feel a need for the innovation or even if they are exposed, the messages will have little effect on them (Hassinger, 1959). This process is called “selective exposure” which is the tendency to communicate messages that are consistent with the individual’s existing attitudes and beliefs. When individuals feel a need for an innovation, then it can precede the awareness of the innovation. Also innovation can create needs. Therefore, change agents or other marketer controlled communication channels can create needs among their clients. Compared to later knowers of innovation, early knowers have higher education, have higher social status, have more exposure to mass media channels of communication, have more exposure to interpersonal channels, have more contact with change agents, have more social participation and are more cosmopolitan. Rogers (2003) explained that the characteristics of earlier knowers of innovation are similar to the characteristics of innovators and early adopters but being an early knower does not necessarily lead to being a consumer innovator.
32
2- Persuasion: persuasion occurs when an individual forms a favourable or an unfavourable attitude towards the innovation. In this stage the general perception about the innovation is developed. The difference between persuasion stage and knowledge stage is that the mental activity in the knowledge stage is mainly cognitive or knowing, whereas in the persuasion stage, the main type of thinking is affective or feeling. In this stage, individuals are more psychologically involved with the innovation and seek actively for information about the innovation. Some characteristics of the innovation such as relative advantage, compatibility, complexity, trailablity and observability are very important in this stage. The innovation resistance model by Ram (1987) explains how these characteristics affect the individuals to resist against an innovation (Section 6.2) Before making a decision about the innovation, an individual anticipates a future situation if deciding to accept the innovation: What if I adopt this innovation? The individuals at this stage have some uncertainties about the innovation and they may not know how the innovation functions, therefore at this stage they evaluate the information they receive from mass media, change agents and friends and make a judgment to see if it is convincing. After that a favourable or unfavourable attitude towards innovation will be formed but sometimes having a favourable or unfavourable attitude does not necessarily lead to innovation adoption. 3- Decision: Decision occurs when an individual is involved in activities leading to a choice to adopt or reject the innovation. Adoption is a decision to make full use of an innovation as the best course of action available. Rejection is a decision not to adopt an innovation. Rejection can occur at any stage of the innovation decision process.
33
For example, a rejection can occur at the knowledge stage by simply forgetting about the innovation after gaining the initial awareness knowledge. According to Rogers (2003), there are two types of rejections: (1) Active Rejection which is about considering adoption of an innovation but then deciding not to adopt it. (2) Passive Rejection which is about never really considering the use of innovation. Most individuals do not adopt an innovation without trial experience. The trial stage is a very important part of the decision process and it is effective to reduce the uncertainties of the product. The distribution of free samples of a new product can speed up the rate of adoption but there are some innovations that cannot be used at a probationary stage so they must be adopted or rejected. 4- Implementation: Implementation happens when an individual puts a new idea into use. In the previous stages, the process has mostly been a strictly mental exercise of thinking and deciding. In the implementation stage, the new idea is put into practice and the behaviour changes. In this stage, there is still a degree of uncertainty about the innovation and individuals still have some questions about the function and technical aspects of the product. The role of change agents and technical assistants in this stage is to provide useful information for the customers. 5- Confirmation: This stage occurs when an individual seeks reinforcement of an innovation decision already made, but he or she may reserve this previous decision if exposed to conflicting messages about the innovation. This means that the decision to adopt or reject is not the final stage in the innovation decision process. In the confirmation stage, individuals try to reduce the state of dissonance.
34
2.3.1.2- The social system and innovation diffusion Among the elements of the Rogers diffusion model, the social system is the most relevant and important one for this research because showing innovativeness or resistance from consumers highly depends on the characteristics of the social system. The social system is defined as ‘a set of interrelated units that are engaged in joint problem solving to accomplish a common goal’ (Rogers, 2003, p.23). The units can be individuals, groups or organisations. Diffusion occurs within a social system, therefore there are some aspects of a society affecting innovation diffusion. These aspects are social structure, system norm, opinion leaders and change agents. Social structure is the patterned arrangements of the units in a system. The structure of a society is effective in the regularity and stability to human behaviour in a system. The structure provides some information to predict the behaviour with some degree of accuracy. System norms are the established behaviour patterns for the members of a social system. Norms define a range of tolerable behaviour and serve as a guide or standard for the behaviour of members of a social system. The norms of a system tell individuals what behaviour they are expected to perform (Rogers, 2003). The norms of societies can be a source of resistance to change. For example, Muslims’ and Jews’ dietary habit of not eating pork is a kind of religious norm of food habits. Norms can be operated at national level, religious community, an organisation or a local system. Opinion leaders and change agents are also influential on diffusion. There are some people who act as opinion leaders in societies; these people provide information and provide advice for other people in the system. The definition of opinion leadership by Rogers is the degree to which an individual is able to influence others’ attitudes or overt behaviour informally in a desired way with relative frequency. Opinion leaders
35
are often: (1) exposed to more cosmopolitan; (2) have higher socioeconomic status, (3) and are more innovative than followers. Opinion leaders have a unique and influential position in the system and they are the centre of interpersonal communication networks, thus their opinion can influence a society to try or reject a new idea. Sometimes in literature opinion leadership is a synonym of consumer innovativeness. 2.3.1.3 - Limitations of Rogers model Rogers’ theory of diffusion is undoubtedly fundamental in understanding how innovations are diffused but later some limitations are identified by other researchers. One of the main limitations is the method of identifying innovators. It seems that innovators are only 2.5% of adopters (Figure (2)) no matter what their personality, demographics and socioeconomic status. To identify the first 2.5% of adopters, the process of diffusion should be complete; this has no practical use for marketers as they cannot predict who the innovators are and what characteristics they have (Wright and Charlett, 1995). Another limitation is the assumption that targeting innovators will speed up the diffusion rate due to personal influences that innovators have on other individuals. This assumption is not always true. In case of low involvement products that receive low word-of-mouth or in societies where interpersonal communication is limited, targeting a small target of innovators is likely to be ineffective; instead targeting the mass market would be more appropriate. The Bass (1969) model of diffusion could solve some limitations in Rogers’ model.
36
2.3.2- Bass model of diffusion In 1969, Frank Bass developed a model for the timing of initial purchase of new products in consumer durables. The model is based on the assumption that the timing of initial purchase is related to the number of previous buyers. The Bass model performs as a good prediction tool for sales before launching new products. Unlike the Rogers (1962) model that considers diffusion as a normal curve, Bass (1969) illustrates diffusion to a peak which then level off at some magnitude lower than the peak (Figure (4)). Figure (4) - Growth of a new product curve
Source: Bass (1969) Mathematically, the model can be expressed as follows: P (t) = P (0) + (q/m) Y (t) where P (t) is the probability of purchase at time t. P (0) is the initial probability of trial and it reflects the propensity to innovate without external influence (Mahajan et al., 1990; Wright and Charlett, 1995). P (0) reflects what Rogers referred to as innovators. ‘m’ represents the total number of potential buyers and ‘q’ is the rate of diffusion. Therefore q/m reflects the social interaction effect. Y (t) is the total number of people who have ever purchased the innovation. Therefore q/m times Y (t) means
37
that the number of purchases is magnified by the social interaction effects and personal influences. Innovators take no influence from others in a social system; so this pressure operates on imitators as the number of previous buyers increases. In the Bass model, innovators are present in the whole diffusion process, whereas in Rogers’ model, innovators are defined only as the first 2.5% of adopters. To make estimations using the Bass model, the values of p, q and m should be identified. This can be done by using historical data, market research, managerial judgments or secondary data. In section 2.7.2 we discuss how and why the Bass model cannot be used to predict innovativeness of consumers and adoption rate of solar panels in the study. 2.3.3- Gatington and Robertson’s (1985) propositional inventory for diffusion Gatington and Robertson (1985) provided a comprehensive and updated conceptual model of innovation diffusion directly relevant to consumer behaviour. The model is presented in Figure (5) and consists of Rogers’ model plus two more elements: the role of marketing (change agent) actions and the role of competitive actions.
38
Figure (5)- A model of the diffusion process (Gatington and Robertson, 1985)
The relationship between elements of diffusion is presented and there are 29 propositions in the model. Gatington and Robertson (1985) explain the foundations of their model as follows: ‘Diffusion occurs within the boundaries of the social system or market segment. The diffusion pattern at the social system level is an outcome of the distribution of individual adoption decisions. These individual adoption decisions are influenced by personal characteristics, perceived innovation characteristics, personal influence, and marketing and competitive actions. The latter also has an influence in defining the perceived innovation characteristics and affecting the personal influence processes. Explaining all 29 propositions in the model makes it very long and it is not necessary but some propositions which are useful in understanding innovation decision making
39
can be briefly explained. For example, the level of cognitive processing is very important in the adoption process. Cognitive processing can be under conditions of high level and low level. High cognitive processing requires high consumer learning, high innovation costs or high switching costs, high social imitation and adoption decisions involved with multiple persons in families or organisations. The adoption process in higher cognitive processing can be envisaged as: awareness, knowledge, attitude formation, trial, and adoption. Low cognitive processing exists when there is low consumer learning, low innovation costs or low switching costs and low social imitations. The adoption process in low cognitive process is: awareness, trial, attitude formation, and adoption. Adoption of a highly innovative product such as solar panels can be explained in high cognitive processing. The Gatington and Robertson model provided an appropriate framework for researchers to perform empirical research on the proposed relationships. Some examples of these researches are Lassar et al. (2005) (personal characteristics and online banking adoption); Luthje (2004) (characteristics of consumers and adoption of sport-related products); Hirunyawipada and Paswan (2006) (innovativeness of consumer and technology adoption); Lee et al. (2002) (marketing communications and technology adoption); and Im et al. (2003) (personal characteristics and adoption behaviour). Gatington and Robertson (1985) propositions are helpful and will be used for hypotheses development in this research. This research also borrows some propositions
from
the
model (i.e.
characteristics
characteristics).
40
of innovation,
personal
2.4- Innovation classifications After defining the concept of innovation and explicating how innovations are diffused, another important issue arises, that of how innovations should be classified. Innovations, based on their degree of newness, are different and thus researchers and practitioners should have consistent criteria for identifying them. A critical investigation by Garcia and Calantone (2002) revealed that this consistency does not exist and varieties of labels have been used in the literature from a variety of perspectives. Garcia and Calantone (2002) stated that: ‘The innovation process has been identified for radical, incremental, really new, continuous, discontinuous and imitative innovations, as well as for architectural, modular, improving, and evolutionary innovations…. Yet, one has to ask, what is the difference between a radical innovation, a really new product innovation, and a discontinuous innovation? What is the difference between an incremental innovation and an imitative innovation? Just as important, does it matter how innovations are labelled?’ (p. 110) Garcia and Calantone’s (2002) article is used in this research as a main guideline in how to identify and classify innovations. Their article has to date received over 1400 citations and is instrumental in providing a clear picture of innovation typologies. However, the work of Bessant and Tidd (2011) should also be considered to further understand the different types of innovation. This section focuses on Garcial and Calantone’s (2002) review of innovation classifications and their consistent framework for identifying innovations will be presented at the end.
41
According to Garcia and Calantone (2002), inconsistencies in labelling innovations will contribute to ‘a lack of academic advancements regarding the new product development process of different types of innovations’. In previous studies, the terms “Incremental”, “Continuous” and “Evolutionary” were often used interchangeably. This is the same for the terms “Radical”, “Discontinuous” and “Revolutionary” but they all refer to generally the same concepts. The abundance of typologies of innovation can be confusing for researchers and this has resulted in the same name being used for different types of innovation and the same innovation being classified under different typologies. The degree of product innovativeness is the criteria used to classify innovations but the main issue is how and from whose perspective the innovativeness should be investigated. There are many constructs used by previous researchers to model product innovativeness and according to Garcia and Calantone (2002) these are radicalness, newness to firm, technical content, newness to market, newness of the technology, newness to customer, product uniqueness, product superiority, synergy, product/market fit, marketing task similarity, product complexity, development complexity, and product type. It is clear that the variety of viewpoints on product innovativeness is the reason of inconformity of innovation typologies. Therefore Garcia and Calantone (2002) proposed a ‘parsimonious conceptualisation of the overarching factors of interest’. The consistent criteria used in the literature to identify innovations were based on discontinuities occurring in marketing and/or the technological perspective as well as the macro/micro perspective. More explanations are presented as follows:
42
Macro and micro perspective: At the macro level the concern is how the characteristics of product innovation are new to the world, the market or industry (Atuahene-Gima, 1995, Lee, Na, 1994, Maidique and Zirger, 1984, Mishra and Kim, 1996, Schmidt and Calantone, 1998, Yoon and Lilien, 1985) and at the micro level the concern is to measure how innovation is new to the firm or customer (More, 1982). Garcia and Calantone (2002) state that from the macro perspective ‘innovativeness is evaluated based on factors exogenous to the firm, such as familiarity of the innovation to the world and industry or creation of new competitors from the introduction of new innovations.’ Discontinuities at the macro level are felt worldwide, industry wide or market wide. Few products have these characteristics, such as the world wide web, the steam engine or the first camera. These innovations have made a significant breakthrough in the industry and worldwide. Discontinuities at the micro level are felt in the firm or the firm’s customers: ‘Discontinuities can occur in a firm’s marketing or R&D strategy, in a firm’s supplier or discontinuous chains, or in its sales approach’ (Garcia and Calantone, 2002). However, this depends on the capabilities and competencies of the firm. For one company, designing a new product might be a disruptive effort but not for another company. Marketing/technological discontinuities: A discontinuity in the marketing aspect means that product innovation requires a new marketplace to evolve, and/or new marketing skills in the firm. There are three primary sources of marketing discontinuities: (1) customers; (2) competitors; and (3) market environment. A market discontinuity is a shift in any of the market forces or their interrelationships that
43
cannot be predicted by the continuation of historical trends. If it occurs, it can dramatically affect the performance of a firm or an industry (Mahajan and Wind, 1989). Customer demographics, values, lifestyle and consumption behaviour are one the major sources of marketing discontinuity (Mitchell, 1983). This means that a major shift in customer demographics, consumption behaviour and lifestyle will make companies realign their product and business strategy and therefore an innovative product (or service) can be developed. Competitors also generate market discontinuity in two ways (Mahajan and Wind, 1989 restructuring of industries such as mergers and industry acquisitions (i.e. airlines or financial services); and (2) offensive and defensive changes in the marketing mix such as changes in the product offering, price, distribution channels, or the promotion and advertising strategy. Innovative products (or services) can also emerge as a result of discontinuities generated by competitors. Relevant market environment is another factor in marketing discontinuities (Mahajan and Wind, 1989). The market environment comprises five local and global components: 1) the marketing institutions and infrastructure; 2) the socio-cultural environment; 3) the economic environment; 4) the political/legal environment; and 5) the technological environment. Any changes within these factors are influential in marketing discontinuities and may result in innovation. Examples of discontinuity in marketing institutions and infrastructure are new retailing concepts such as hypermarkets, shopping at home via TV channels, shopping by internet or any other dramatic changes brought by information technology. Discontinuities in the sociocultural environment can be as a result of globalisation and heterogeneous society.
44
Examples of economic environment are the credit crunch or any crash in the stock market and so on. Discontinuity in the political and legal environment is also an influential factor in innovation. Deregulation, privatisation and relaxing of antitrust enforcement are examples of discontinuity in industries. These changes can cause open borders and create a different competitive environment. Discontinuities in the technological aspect of a product refer to a paradigm shift in the state of science or technology embedded in a product, new R&D resources and new production process for the firm (Garcia and Calantone, 2002). Technological discontinuities can be classified into two types – competence destroying or competence enhancing (Tushman and Anderson, 1986) – because they either destroy or enhance the competence of existing firms in an industry. A competence destroying discontinuity either creates a new product class (e.g. automobiles) or substitutes for an existing product (diesel versus steam locomotives). Competence enhancing discontinuities are about improvements in price and/or performance that build on existing products. Examples of competence enhancing discontinuities are a new series of laptops or personal computers with improvements in price, performance and features over their prior models. As discussed by Garcia and Calantone (2002), one of the ways in the identification of technological discontinuities and radical innovations is the technology S-curve at Foster (1986): ‘…. The technological product performance moves along an S-curve until technical limitations cause research effort, time, and/or resource inefficiencies to result in diminishing returns. New innovations replace the old technology and a new S-curve is
45
initiated’ (Garcia and Calantone, 2002). A radical innovation can occur as a result of the initiation of new S-curves at the marketing and technological level.
2.4.1- Garcia and Calantone’s typology for identifying innovations Now, it is clear that identifying innovations by comparing the micro versus macro and the marketing versus technology perspective is a consistent method. Based on this, there are eight possible combinations of innovation types (Table 4). According to Table (4), radical innovations account for 1 out of 8 total combinations. Really new innovations represent 4 out of 8 and the remaining are incremental innovations.
Table (4) - Innovation classifications (Garcia and Calantone, 2002)
46
Radical Innovations: Radical innovation is defined as innovations that entail discontinuities at technology and market level. These discontinuities also occur on both a macro and micro level. This means that if an innovation causes discontinuities at a world, industry or market level will automatically cause discontinuities at the firm and customer level. Sometimes a new industry can be developed from radical innovation such as the world wide web. New firms and new customers are also the result of radical innovation. Radical innovations are rare in occurrence. According to Table (1), one eighth of innovations are radical. Sometimes people may not be able to imagine why they need a radical innovative product. For example, many households could not imagine a reason why they would need a computer before the invention of the computer but now this new demand has resulted in new industries, new competitors, firms, distribution channels and new marketing activities (Garcia and Calantone, 2002). Therefore, radical innovations sometimes do not address a recognised demand but it creates a demand previously unrecognised by the consumer. Really new innovations: Really new innovations comprise the majority of innovations. According to Table (1), fifty percent of innovations are really new. Really new innovations can be equal to moderately innovative products for which the definition was given in the literature. Really new products can be misclassified as radical innovations and radical innovations can be misclassified as really new products. At a macro level, discontinuities occur in marketing or technological aspects of the product but this does not incorporate both. If both do occur, it should be classified as a radical innovation and if no discontinuity occurs at the macro level, it should be classified as incremental innovation. At a micro level, any marketing or
47
technological discontinuity can occur in the firm. Really new products can evolve from a new technology embedded in the product which is a discontinuity in the world or industry (e.g. the electron microscope, Canon laser jet), or they can evolve as a result of marketing discontinuities at the macro level (e.g. Sony walkman). Really new products entail some characteristics that distinguish them from other kinds of innovations. Really new products involve advanced capabilities that do not exist in current products and cannot be achieved through mere extension of an existing technology (Veryzer,1998). Moreover, consumers are not familiar with the product at the time of its introduction and in order to use these products, they should change their old behavioural routines. For example, personal computers or internet provided major technological developments and they caused significant changes in customer thinking and usage patterns. The adoption of really new or radical innovation is highly dependent on a variety of product characteristics such as relative advantage, initial cost, product complexity, social approval and so on (Dhebar and Anirudth, 2005; Gatington et al., 1985; Kotler, 1994). Some factors, such as advertising and distribution, are influential in the success of most products but Veryzer (1998) believes that the key factors that affect customers’ evaluations of really new products might be different from those that are important for incremental products. There are additional concerns for really new and radical innovations that are not present for incremental innovations such as technological uncertainty, unfamiliarity with the products and risk associated with really new and radical products. Incremental innovations: incremental innovations can be defined as products that provide new features, benefits, or improvements to the existing technology in the existing market. Incremental innovation can also be synonymous with the term,
48
continuous innovation. Incremental innovations are the result of discontinuities in marketing and/or the technological aspect only at the micro level. If discontinuities occur at the macro level, the product should be classified as really new or radical. “Incremental innovations are important on two main counts: first as a competitive weapon in a technologically mature market; and second, because streamlined procedures based on existing technology can help alter a business in good times to threats and opportunities associated with the shift to a new technological plateau” (Johne FA and Snelson PA, 1988). Incremental innovations can occur at all stages of the new product development process. 2.4.2- Bessant and Tidd’s innovation typology In addition to Garcia and Calantone’s (2002) work, Bessant and Tidd’s (2011) view of innovation can also be considered to add further understanding of the different types of innovation. Unlike Garcia and Calantone, Bessant and Tidd identify only two types of innovations: ‘steady-state’ or ‘continous’ and ‘discontinous’. In their view steadystate innovation is about ‘doing what you do but better’. This term is equivalent to incremental innovation used by Garcia and Calantone (2002). In steady state innovations, companies make minor improvements over existing innovations over time. This type of innovation tends to favour the established players in the market. In contrast, discontinuous innovations occur as a result of technological shifts in the industry. The aftermath of technological shift is the emergence of new markets. Compared to Garcia and Calantone, discontinuous innovation, defined by Bessant and Tidd, gives consideration only to technology shift and not market shift. In Garcia and Calantone’s typology, sometimes a really new innovation can be introduced not as a result of a major shift in technology but due to innovative marketing of an existing
49
technology. The best example is the Sony Walkman (Jobber and Chadwick, 2012). It seems, in the view of the author of this thesis, that Garcia and Calantone’s (2002) work is following more clear structure in identifying innovations and considers both technology and marketing shift when developing their argument. 2.4.3- Identifying solar panels in innovation typologies As Garcia and Calantone comment, the categorisation of a product should be based on both the macro/micro perspective and marketing/technology perspective. Solar panels are a packaged interconnected assembly of solar cells which use light energy from the sun to generate electricity and they also have residential applications. From the macro/micro perspective, the characteristics of this innovation are new to the energy industry, so a discontinuity has occurred at the macro level. When a discontinuity occurs at the macro level, it is also felt at the micro level (firms and customers). From a technological perspective, a discontinuity has occurred in the energy technology as there is a significant improvement in the exploitation of alternative types of energy. The history of solar panels and technological changes was explained in Chapter 1. We can conclude here that solar panels, based on the Garcia and Calantone’s (2002) innovation classification, is at least a really new innovation.
2.5-Consumer Innovativeness 2.5.1- Definitions The prominent role of consumer innovators is apparent in the diffusion process of innovations. Consequently, since the 1970s researchers have put a good deal of effort into constructing the concept of consumer innovativeness. The concept has been viewed from a variety of perspectives, which has resulted in many measurement 50
scales being introduced by researchers. Identifying consumers who are expected to engage in a certain kind of innovative behaviour has many managerial implications for the way in which a new product is introduced: companies should recognise consumer similarities and differences across markets, which is an essential instrument for effective market segmentation. Moreover companies need to know the individual markets’ propensity for new product adoption, and this becomes very important during the early stages of a product’s life cycle. Therefore the success of a product depends on consumer innovativeness (Tellis et al., 2009). Consumer innovativeness has been approached at three levels of abstractions, namely innate innovativeness, domain-specific innovativeness and actualised innovativeness (also known as innovative behaviour) (Bartels and Reinders, 2011). Innate innovativeness was used for the first time by Midgley and Dowling (1978) and it is identified as a personality trait. Consumer innovativeness as an innate trait is not expressed as an explicitly observable behaviour. Midgley and Dowling (1978) believe that innovativeness is a function of human personality and ‘all members of society possess a greater or lesser degree of innovativeness’ (p. 235). Innate innovativeness has other synonyms in the literature as general, exploratory or global innovativeness and they will be used interchangeably in this research. For those researchers viewing consumer innovativeness as a personality trait, this is viewed as an attraction to new products and the propensity to buy them. For example, Steenkamp et al., (1999) define innovativeness as the predisposition to buy new and different products and brands rather than remain with previous choices and consumption patterns. A similar definition is proposed by Tellis, Yin and Bell (2009). Hirschman (1980) conceptualised innate innovativeness as consisting of three types: (1) vicarious
51
innovativeness, meaning that consumers acquire knowledge about products through learning and imagination; (2) adoptive innovativeness which is about consumers’ acquisition or adoption of new products; (3) use innovativeness which is about consumers who ‘tinker with’ and solve novel consumption problems with the products they use. Innate innovativeness is different from actualised innovativeness in the sense that actualised innovativeness is a measurable property related to the actual adoption of the product, whereas innate innovativeness does not necessarily lead to actual innovativeness. The empirical evidence will be provided in Chapter 3. Similar to general innovativeness, consumer innovativeness at domain-specific level is a personality trait but it is about the tendency to learn about and adopt new products within a specific product category (Goldsmith and Hofacker, 1991). As is clear from this definition, innovativeness should be viewed as: (1) a tendency, not as an actual buying; and also (2) in a specific product category, not in every product category. Goldsmith and Hofacker (1991) used this term for the first time as they proved that consumer innovativeness at domain-specific level can better predict actual behaviour than innate/general innovativeness. The stronger predictive validity of domainspecific innovativeness (DSI) has been supported by many other authors (e.g. Bartels and Reinders, 2011; Mudd, 1990; Roerich, 2004; Citrin et al., 2000). Finally, actualised innovativeness or innovative behaviour describes a measure of early adoption. As mentioned before, one of the earliest definitions of consumer innovativeness was presented by Rogers as ‘the degree to which an individual is relatively earlier in adopting an innovation than other members of his system’. It was mentioned in Chapter 1 that this method of identifying innovators has some
52
limitations. Instead some other methods were suggested in the literature to measure actualised innovativeness such as a cross-sectional method (Midgley and Dowling, 1978) or ownership of a new product (Lee, 1990) but again these methods have some limitations which will be discussed later. What is clear is that after nearly four decades of research debate and discussion, there is still no consensus on the definition, perception and operationalisation of consumer innovativeness. Kotler (1991, p.343) states that: ‘No one has demonstrated the existence of a general personality trait called innovativeness. Individuals tend to be innovators in certain areas and laggards in others’. To sum up this section, based on the explanations provided, consumer innovativeness is considered as a hierarchy ranging from: (1) innate innovativeness which is also termed global and general innovativeness in the literature; (2) domain-specific innovativeness (DSI); and (3) actual innovativeness. The hierarchy of innovativeness is supported in the literature (Hoffmann and Soyez, 2010) (Figure 6) Figure (6) – Hierarchy of innovativeness
53
Whether domain-specific or innate innovativeness should be used to predict the actual behaviour (the actual behaviour in this research is innovation resistance), will be discussed more in Chapter 3 where the theoretical model will be explained. 2.5.2- Measuring Consumer Innovativeness Because of varieties of definitions and viewpoints, there are many measurement scales for this construct. A summary of previously developed scales is discussed here: Leavitt and Walton (1975): Leavitt and Walton view innovativeness as a psychological trait underlying the adoption of new ideas, services and products. In their paradigm of designing an innovativeness scale, innovativeness is viewed as a trait that underlies the intelligent, creative and selective use of communication for solving problems. Leavitt and Walton define innovativeness as follows: ‘A person high on the trait of innovativeness is open to new experience and often goes out of his way to experience different and novel stimuli particularly of a meaningful sort (not just thrill-seeking). Most important, he tends to make constructive use of information received whether sought or accidently encountered’. Leavitt and Walton’s scale taps the innate abstraction of innovativeness. Craig and Ginter (1975) tested the predictive validity of this scale in distinguishing between adopters and non-adopters of the latest model cars at the time of study. The results showed that the Leavitt and Walton scale has predictive validity. However, Roehrich (2004) disapproves this and reports that this scale has good psychometric properties but shows low predictive validity. Craig and Ginter’s (1975) innovativeness scale: The scale was developed to measure the trait of innovativeness and its relationship with the adoption of the Mustang Kit Car. There are seven factors constituting innovativeness: (1) the idea that
54
‘new is wasteful’, (2) social desirability, (3) novelty-seeking, (4) risk aversion, (5) style consciousness, (6) satisfaction with status quo, (7) other directedness. The results show that some components of the scale – social desirability, risk aversion and satisfaction with status quo – are distinct between adopters and non-adopters of the Mustang Kit Car. Kirton’s (1976) adaptors and innovativeness scale: Similar to Leavitt and Walton’s (1975) scale, Kirton (1976) views innovativeness as an innate personality trait. From his viewpoint, everyone can be located on a continuum ranging from an ability to do things better to an ability to do things differently, and the ends of this continuum are labelled adoptive and innovative respectively. Those who do things better (adaptive individuals), support existing paradigms and norms of the group and they are bureaucratic in organisations. Those who do things differently, (innovative individuals) break patterns of accepted modes of thoughts and action. Kirton’s Adaption-Innovation scale (KAI) has 32 items and it is multidimensional. The dimensions of the KAI scale are Originality which contains items that describe creativity, Methodical Weberianism which describes a person that, according to Weber (1948), is precise, reliable and disciplined and Metronian Conformist which is a description by Merton (1957) about the person who fits well into a bureaucracy and has proper respect for authority and rules. Similar to other innate innovativeness scale, KAI also suffers from low predictive validity (Mudd, 1990; Roerich, 2004). Midgley and Dowling’s Innovativeness scale (1978): Midgley and Dowling were the first authors who distinguished between innate and actual innovativeness and they proposed a model for innovativeness. Midgley and Dowling (1978) argued that innovativeness should be conceptualised at a higher level of abstraction and that
55
explicit recognition should be given to the complex communication processes intervening between this construct and observable behaviour. They defined consumer innovativeness as the degree to which an individual is receptive to new ideas and makes innovation decisions independently of the communicated experience of others. This is similar to Bass’s (1969) model of diffusion that conceives of innovators as those who receive no influence from others. Communicated experience means that individuals pass their usage experience of their products verbally between each other. The difference between innate and actual innovativeness is that innate innovativeness is the function of communicated experience creating a predisposition within consumers to try new products but actualised innovativeness is the function of time and it is a temporal concept. Innate innovativeness does not necessarily turn into actual innovativeness. The following model (Figure 7) was proposed by Midgley and Dowling on the basis of this assumption that there is a positive correlation between high receptivity to new ideas and low dependence on communicated experience.
56
Figure (7)- Model of innovativeness by Midgley and Dowling (1978)
In this model, psychological traits are some variables such as empathy, dogmatism, achievement motivation, self-monitoring, intelligence etc. Sociological traits can be social participation, social integration, cosmopolitism, social character etc. Psychological and sociological traits are in the construct field of the model and they are non-observable behaviour. If we move to the phenomena plane, which concerns observable behaviour, the first intervening variable is interest in the product category; this shows that interest to products can be dependent on social and psychological characters. The next intervening variable is communicated experience in which consumers receive interpersonal messages about the product. Situational effects are about a variety of situation-specific and person-specific factors. For example, the situation in which the individuals discuss the product or financial situation is important. After these steps, the consumer decides whether or not to adopt the innovation.
57
Midgley and Dowling propose cross-sectional technique to measure actualised innovativeness which involves determining how many of a pre-specified list of new products an individual has purchased at the time of the survey. There are two main problems in Midgley and Dowling’s approach: one is the criteria of identifying innovators based on independence of communication experience. This approach is problematic as there might be some individuals who do not rely on communication but have lower propensity to try new ideas. It is also possible that later adopters do not use communication sources because of their social isolation and therefore might be misclassified as innovators. The second problem is the crosssectional method and a list of purchased pre-specified items as indicators of innovativeness. Goldsmith and Hofacker (1991) criticise this and state: ‘…which product category would be selected, which products in the category would be chosen, and how does the researcher determine which products are new? ......’ Therefore the reliability and predictive validity of Midgley and Dowling’s approach is under question. Raju’s (1980) scale: Raju’s innovativeness scale was introduced in 1980 to test the relationship between Optimum Stimulation Level and Exploratory Behaviour. What is meant by optimum stimulation level (OSL) is a property characterising the individual in terms of his general response to environmental stimuli. Through this study he said that exploratory tendencies are most likely to be manifested as risk taking and innovativeness. Raju (1980) says that: ‘In psychology, OSL refers to the concept that every organism prefers a certain level of stimulation. When the environmental stimulation which is determined by novelty, ambiguity, complexity, etc is below optimum, an individual will attempt to increase
58
stimulation and when it is above optimum he/she will attempt to reduce it. The behaviour aimed at modifying stimulation from the environment is termed “exploratory behaviour’. Exploratory behaviour and OSL are useful in: (1) studying the response to stimulus characteristics such as novelty and complexity; (2) studying the information-search behaviour of consumers; (3) studying the effects of stimulus (e.g. advertising) repetition; and (4) studying individual differences in exploratory behaviour. In general, individuals with high OSLs will be more likely to explore new stimuli and situations because of a higher need for environmental stimulation. Comparing this with innovativeness definition reveals that innovators can be those who manifest more exploratory tendencies towards innovation than others because they search for information about products to reduce their uncertainties. Raju’s (1980) scale also taps innovativeness at a general level consisting of 10 items. The predictive validity is higher than other general innovativeness scales and Roerich (2004) reports it as average predictive validity. Baumgartner and Steenkamp (1996) modify this scale, which will be discussed later in the sub-section. Price and Ridgway (1983): Their scale is to measure use innovativeness, which represents variety-seeking in product use (Hirschman 1980). Use innovativeness is described at two levels. The first level is the use of a previously adopted product in a single, novel way and the second level is using a currently owned product in a wide variety of ways. The scale has four dimensions: creativity/curiosity, voluntary simplicity and creative re-use, risk preference, and multiple uses potential. Use innovativeness cannot be a predictor of actual/adoptive innovativeness. As a result there is no predictive validity test for this scale.
59
Baumgartner and Steenkamp’s (1996) scale: Similar to Raju (1980), Baumgartner amd Steenkamp (1996) conceptualised exploratory consumer buying behaviour but the difference between their research and that of Raju (1980) is that they distinguished two facets of exploratory behaviour, exploratory acquisition of products (EAP) and exploratory information seeking (EIS), and tested their relationships with trying new products. Baumgartner and Steenkamp believed that Raju’s differentiation of seven facets of exploratory behaviour has overlapping problems. For example, they mentioned that repetitive behaviour proneness is closely related in an inverse fashion to brand switching and there is an absence of clear boundaries of the seven facets. Another problem is that Raju’s approach in assessing the relationship between exploratory behaviour and other constructs seems to be impractical because Wahlers et al. (1986) and Baumgartner and Steenkamp (1991) had difficulties in obtaining good psychometric properties and meaningful associations through Raju’s scale. Besides the factors mentioned above, Baumgartner and Steenkamp (1991) believed that there are some problems in previous studies for exploratory behaviour: (1): there has been a lack of clear conceptualisation of the construct of exploratory consumer behaviour: “Up to seven facets of exploratory behaviour in the consumer have been distinguished, and few attempts have been made to integrate the evidence and to propose a coherent conceptual framework that could serve as a basis for theory development and empirical research”. (2): apart from the relationship between exploratory behaviour with OSL, relatively little is known about the relationship of exploratory buying tendencies with other constructs and actual exploratory consumer behaviours.
60
(3) Attempts at measuring individual differences in consumers’ tendencies to engage in exploratory buying behaviour have led to disappointing results (Wahlers et al., 1986; Baumgartner and Steenkamp, 1991). EAP is defined by Baumgartner and Steenkamp (1996) as: ‘Consumer’s tendencies to seek sensory stimulation in product purchase through risky and innovative product choices and varied and changing purchase and consumption experiences. Consumers who are high on EAP enjoy taking chances in buying unfamiliar products and they like to try out new and innovative products, value variety in making product choices, and change their purchase behaviour in an effort to attain stimulation consumption experiences’. EIS is defined as: ‘A tendency to obtain cognitive stimulation through the acquisition of consumption relevant knowledge out of curiosity. Consumers who are high on EIS like to go browsing and window shopping, and are interested in ads and other promotional materials that provide marketing information, and enjoy talking to other consumers about their purchases and consumption experiences’. The developed EBBT (Exploratory Buying Behaviour Tendency) scale had 10 EAP and 10 EIS items. Baumgartner and Steenkamp tested the relationship between EBBT with other constructs such as optimum stimulation level (OSL) and other personality scales. They found that OSL had significant effects on both EAP and EIS and the effect of OSL on EAP was stronger than the effect of OSL on EIS. The predictive validity of the scale was tested in the following categories:
61
(1) Innovative Behaviour: Since sensory stimulation seeking through risky and innovative product choices is a major component of EAP, therefore it is rational to expect that choice of innovative products would be significantly correlated with EAP. They chose a scratch-off lottery ticket called Kraslot which was new at the time of their research in the Netherlands and the results showed that subjects who scored high on EAP were significantly more likely to purchase lottery tickets than subjects who scored low on EAP. Therefore EAP was positively related to innovative behaviour and this relationship was stronger than EIS. (2) Variety-seeking behaviour: What is meant by variety-seeking behaviour is the manifestation of consumers’ desire for exploration. Baumgartner and Steenkamp argued that OSL and variety-seeking behaviour are positively correlated. Also variation in self-reported food consumption behaviour is positively correlated with a scale measuring variety-seeking tendencies with respect to foods (Van Trijp and Steenkamp, 1992), therefore it is possible to expect that actual variety-seeking behaviour would be positively related to EAP and it would be more strongly related with EAP than EIS. The hypothesis was tested by inviting some participants to watch a TV programme and while watching the programme they were invited to drink coffee and eat a variety of cookies. The plate of cookies contained eight different cookies. After watching TV, they filled out the EBBT scale and, in addition, they were required to indicate which of nine potential attributed of cookies (crispy, soft, high in calories, sweet, good testing, unhealthy, light, contains many additives, special) were applicable to a given cookie. At the end of the experiment, the experimenter recorded the number of cookies of each type that each subject had consumed. The result
62
indicated that EAP was significantly correlated with variety-seeking behaviour whereas the correlation for EIS was non-significant. (3) Cognitive responses to ads: Another facet of exploratory behaviour is cognitive activity, especially curiosity-motivated thinking (Berlyne, 1978; Oslon and Camp, 1984; Pearson, 1970). Since curiosity-based thinking primarily satisfies consumers’ cognitive stimulation needs (Pearson, 1970), it was expected that the number of curiosity-motivated thoughts generated in response to an ad would be positively correlated with EIS and that the relationship with EIS would be stronger than one with EAP (Baumgartner and Steenkamp, 1996). The authors tested this by inviting participants to watch an ambiguous TV commercial which had a potential to stimulate curiosity and they were asked to write down all the things that had gone through their minds while watching the ad. After that they filled out the EAP and EIS scale. Results showed that EIS was significantly correlated to the number of curious thoughts generated by subjects whereas the correlation with EAP was not significant. (4) Information seeking: Consumer information seeking may be motivated by either willingness to make better purchase decisions or by a more general interest in learning more about the environment (Steenkamp and Baumgartner, 1992). The extent of information search should have a positive correlation with EIS, which reflects a general tendency to obtain cognitive stimulation through acquisition of consumptionrelated knowledge. It is expected that the amount of information searched would be related to EIS than EAP.
63
To test the hypothesis, the authors presented the information of six brands of hypothetical automobiles described on seven attributes to participants. To stimulate curiosity, participants could browse through product information about real brands of automobiles whose names had been disguised, and in the process they might learn some new and interesting facts about cars. The results showed that EIS had positive correlation with the amount of searched information and EAP did not. Lee’s (1990) National Innovativeness Scale: Lee introduces the concept of national innovativeness, which is the degree to which a country adopts an innovation relatively earlier than other countries. Ownership of a new product is the criterion for national innovativeness and the product example was black and white television. National Innovativeness Scale can be explained by four variables: 1- gross national product (GNP); 2- Literacy rate; 3- the ratio of manufacturing and service sectors to total GNP; and 4- the number of scientists and engineers per head of population. Lee’s (1990) definition of national innovativeness is criticised by Lynn and Gelb (1996), as they argue that extent of adoption and the earliness of adoption cannot be combined without creating an indefinite and immeasurable construct. Instead they propose a new definition for national innovativeness: ‘the extent to which a nation’s consumers adopt innovative, new products’ (Lynn and Gelb, 1996, p. 46). Therefore, similar to Rogers’ criteria, earliness of adoption is problematic in defining innovativeness. Goldsmith and Hofacker’s (1991) domain-specific scale (DSI): Goldsmith and Hofacker (1991) believe that innovativeness should be measured at product-specific level because innate innovativeness suffers from low reliability and predictive validity. Domain-specific innovativeness (DSI) is a tendency to buy and learn about
64
new products within a specific domain of interest. This implies that an individual can be an innovator in the case of a particular product, but not necessarily in other product types. The scale is one-dimensional and shows high reliability and validity. The DSI scale consists of six items which are presented in Table (5). Some items of DSI will be kept for the scale development process and will be explained in detail in Chapter 4. Table (5) - DSI items by Goldsmith and Hofacker (1991)
Items in DSI Scale Compared to my friends, I own few rock albums. In general, I am the last in my circle of friends to know the titles of the latest rock album. In general, I am among the first in my circle of friends to buy a new rock album when it appears. If I heard that a new rock album was available in the store, I would be interested enough to buy it. I will buy a new rock album, even if I haven’t heard it yet. I know the names of new rock acts before other people do. Pagani (2007), vicarious innovativeness: Pagani (2007) modifies Goldsmith and Hofacker’s DSI scale and integrates it with psychological and cognitive items. The scale is designed to measure innovativeness for 3G mobile phone services. The scale is unidimensional and a domain-specific scale integrated with psychological and cognitive items can be used to predict consumer behaviour in mobile services. The problem with Pagani’s scale is the high error variance (RMSEA=0. 12). Tellis, Yin and Bell’s (2009) global innovativeness scale: Tellis, Yin and Bell (2009) criticise innovativeness scales in the literature on the grounds that they have not been validated for use across countries. They define consumer innovativeness as the propensity to adopt new products. The developed scale has three factors: openness, enthusiasm, and reluctance; predictive validity is tested with penetration of the 16 new products from Euromonitor’s market data but only the reluctance dimension is a predictor of adoption.
65
Vandecasteele and Geuens’s (2010) motivational innovativeness scale: These authors believe that innovativeness scales disregard the multitude of motivational sources of behaviour in buying innovations. They argue that innovativeness should not be measured at product-specific and this limits the practical implications. There are four types of motivation which underline consumer innovativeness: functional, social, hedonic and cognitive. Innovators have multiple motivations for buying innovations. Motivated consumer innovativeness (MCI) presents high reliability and the predictive validity is tested by the propensity to adopt four different (non-existent) innovation packs for mobile phones. Vandecasteele and Geuens (2010) believe that their general innovativeness scale is better than DSI because using domain-specific level limits the practicality: ‘Domain-specific Innovativeness scale developed by Goldsmith and Hofacker (1991), which should score better in terms of predictive validity but is product specific and thus not very practical' (p. 316) The authors of the thesis disagree with the claim that measuring innovativeness at domain-specific level is impractical, because many studies used DSI scale in different product categories and the results demonstrate the practicality. The examples are Wang et al. (2006), Goldsmith and Flynn (1992), Mudd (1990), Citrin et al. (2000), Hoffmann and Soyez (2010), Hirunyawipada and Paswan (2006), Bartels and Reinders (2011). Therefore, to predict innovation resistance, innovativeness will be measured at domain-specific level in this research. More detail will be explained in Chapter 3.
66
A summary of all the major consumer innovativeness scales introduced and discussed in previous literature is presented in Table 6: Table (6) - Previous consumer innovativeness scales Author(s)
Dimensions innovativeness
of
Criteria for identifying innovators
Product example
Level
of
abstraction
Leavitt and Walton (1975)
Innovativeness as a psychological trait underlying adoption of new ideas.
Openness to new experience.
No predictive validity test
General
Carig and Ginter (1975)
Same as Leavitt and Walton (1975).
Same as Leavitt and Walton (1975)
Ownership of new Mustang IT.
General
Kirton (1976)
Innovativeness as a personality trait.
Innovators are those who do things differently, and break patterns of accepted modes of thoughts and action.
No predictive validity test.
General
Midgley and Dowling (1978)
Innovativeness as a hierarchy from general to actualised.
Innovators are those who are receptive to new ideas and make innovation decisions independently of the communicated experience of others.
No predictive validity test.
Actualised
Raju (1980)
Exploratory behaviour.
Innovators are those who manifest more exploratory tendencies towards innovation than others.
Predictive validity was tested with optimum stimulation level (OSL).
General
Price and Ridgway (1983)
Use innovativeness.
Innovators use a currently owned product in a wide variety of ways.
Calculator
General
67
Lee (1990)
National innovativeness.
Innovative countries adopt innovations relatively earlier than other countries.
Ownership of black and white television.
Actualised
Goldsmith and Hofacker (1991)
Domain-specific innovativeness (DSI).
Innovators are those who like to try new products in a specific category.
Rock albums.
Domainspecific
1. Innovators are those who manifest risky and innovative product purchase.
1- Lottery tickets.
2. Innovators are those who have extensive knowledge of product consumption to satisfy their curiosity.
3- Varietyseeking behaviour(using biscuits consumption as an example)
Baumgartner and Steenkamp (1996)
Exploratory acquisition of product (EAP). Exploratory information-seeking (EIS).
Fashion products.
General
2- Cognitive response to advertisements.
4- Information seeking of hypothetical automobiles 3G Mobile Services
Pagani (2007)
Vicarious innovativeness using psychological and cognitive items integrated with DSI scale.
Innovators are those who have more consumption knowledge.
Tellis, Yin and Bell (2009)
Global innovativeness.
Propensity to adopt new products.
Penetration of the 16 new products from Euromonitor’s market data.
General
Vandecasteele and Geuens (2010)
1- Functional
Innovators have multiple motivations for buying innovations.
Four different non-existent innovation packs for mobile phones.
General
2- Hedonic 3- Social 4- Cognitive
68
Domainspecific
2.5.3- Critique on previously developed consumer innovativeness measure Now the critical question is: which scale should be used in this research. Although consumer innovativeness has been researched from a variety of perspectives, previous conceptualisations and measures have paid insufficient attention to the characteristics of innovators and their cognitive styles in the really new and/or radical innovations especially in their infancy stage. Using really new/radical innovations (also known as discontinuous innovations) requires some changes in lifestyle; therefore the impact of consumers’ cognitive styles on buying behaviour is different from incremental innovations (also known as continuous innovations). Previous scales have measured innovativeness simply in incremental innovations (i.e. food, fashion products, mobile phones) (Table 6). The recent arguments in the literature elucidate that measuring consumer innovativeness at the domain-specific level can predict actual buying behaviour (actualised innovativeness) better than at the general level (Roehrich, 2004; Mudd, 1990; Goldsmith and Hofacker, 1991; Wang et al., 2006, Bartels and Reinders, 2011). Yet most innovativeness scales at the general level (e.g. Kirton, 1970; Leavitt and Walton, 1975; Raju, 1980) suffer from low reliability and predictive validities (Mudd, 1990; Roerich, 2004). The only available scale to measure consumer innovativeness at domain-specific level is that of Goldsmith and Hofacker (1991) but the scale cannot be used for really new/radical innovations in their respective markets of infancy as most consumers have no attitudinal or behavioural repertoire to reflect upon. Solar panels in the Middle East are an example of a really new innovation in the markets of infancy: ‘The self-report scale is most suitable for product areas where consumers purchase often and can thus report on their actual or anticipated behaviour. Rarely purchased
69
products may not be predicted as well because there is no behavioural and attitudinal repertoire for consumers to draw upon and report’ (Goldsmith and Hofacker 1991, p. 219). Similar to Bass’s (1962) model, using the DSI scale requires a purchase history of a product or a resembling one to predict innovativeness but in case of solar panels introduced into a new market such as Middle East, the problem is the infancy of the product and also a lack of similar products to report the behavioural repertoire. This problem reveals a gap in the previously developed scales to measure consumer innovativeness in radical and really new innovations in the respective markets of infancy. It was discussed in section 2.4.2 that solar panels is at least a really new innovation; the gap in the scales also exists in radical innovations. So the new scale which is to be developed can be tested in any radical or really new innovation which is in infancy markets. For example, the electric car can also be classified in the same category as solar panels. How do the marketers identify the propensity of consumers to adopt this kind of innovative product in the respective infancy markets? What are the characteristics of innovators in the rarely purchased really new/radical innovation scenarios? It should be noted that the categorisation of innovations does not depend on consumers’ perceived newness. It is true that a radical or really new innovation may be perceived by some societies as incremental but this does not lead to changing the categorisation of innovation. The criteria are Garcia and Calantone’s (2002) categorisation of innovations which was explained in section 4: ‘A product’s innovativeness classification is never dependent upon the viewpoint of the customer. This is an error of reversal of causal inferences’.
70
(Garcia and Calantone, 2002, p.125). Therefore one of the objectives of this research is development, validation and crossvalidation of a new consumer innovativeness scale for radical and really new innovations in the respective markets of infancy. The process of scale development will be explained in Chapter 5. 2.5.4- Characteristics of consumer innovators: Before ending this section, it is better to review if consumer innovators possess some general characteristics, as mentioned several times within the text, that consumer innovativeness is a personality characteristic; so what these characteristics are. How do innovators differ from non-innovators? Is it possible to identify innovators based on some general characteristics? Some researchers attempted to answer this question from a variety of characteristics; the results are not necessarily consistent in every situation. For example, if some support exists that innovators are younger, this does not imply that in every situation and product the innovators are always younger, so this is not a universal rules but it is possible to summarise some general characteristics. Foxall et al. (1998) summarised some characteristics of innovators as follows: 1- Socioeconomic status: Innovators have a higher level of income than late adopters or the rest of the population. Standards of living, education and literacy have a positive relationship with the tendency to innovate. For example, at the time of the introduction of touch-tone telephones ‘the innovators showed a higher level of income and self-perception of wealth than non-innovators. They were less concerned about cost; but while they were over privileged within their social class,
71
they did not belong to a higher social class or have a higher income level than non-innovators (Robertson 1967, Zielinski and Ward, 1984). 2- Social interaction and communication: Innovators are different in terms of their exposure to mass media, contact with change agents, group participation and interpersonal communication compared with others in the social system (Rogers, 1995). Innovators prefer different television programmes and magazines. They are also likely to show selective perception of advertisements for particular innovations providing value for them. Early adopters can be opinion leaders and they can influence others by communicating their findings. Innovators tend to use professional communication sources such as sellers, governments and other third parties than imitators and non-imitators (Bayus, Carroll, and Rao, 1985; Midgley and Dowling, 1993; Price, Feick and Higie, 1987). Also potential adopters of a product have a propensity to use various sources of information such as marketers, independent third parties or interpersonal networks (Rogers, 1995; Carroll and Rao, 1985). They seem to use professional communication sources such as sellers, governments and other parties than noninnovators (Bayus, Carroll, and Rao, 1985; Midgley and Dowling, 1993). Innovators are also heavy users of interpersonal communications (Carroll, and Rao, 1985; Gatington and Robertson, 1985). 3- Personal traits and characteristics: Consumer innovators are regarded as more experienced than others, have more knowledge about the product class than others, they are more receptive to change, show achievement motivation, and a pro-business orientation (Foxall et al., 1998).
72
Research showed that innovativeness and self-monitoring are positively correlated. Self-monitoring is the tendency some individuals have to adapt to their social surroundings by observing and controlling their own behaviour. This will lead to trying new items more often than low self-monitors (Goldsmith, 1987). Another factor differentiating innovators from non-innovators is venturesomeness which is the capacity to cope with high levels of risk and uncertainty. Innovators are more willing to take risks in trying unknown products. 4- Purchase and consumption behaviour: The buying behaviour pattern of innovators is different to non-innovators. Previous studies showed that early adopters of new products and brands are heavy users of the product class. For example, the innovator of a brand new tea is likely to be a heavy tea drinker. Innovators for touch-tone telephones can also be interested in adopting other domestic appliances such as colour TVs, electric toothbrushes and electric carving knives (Robertson, 1967). In another study by Tylor (1977), a positive relationship was found between the usage rate and innovative trial in continuous innovations of fast-moving products. Innovators initiate markets by communicating innovations to later adopters; they also consume a disproportionate volume of products they adopt, they are less price sensitive (Goldsmith and Newell, 1997), but they may show lower levels of brand loyalty than other consumers (Goldsmith and Hofacker, 1991).
2.6- Innovation Resistance Innovation resistance is a relatively neglected concept in new product management as the previous studies mostly concentrated on innovation adoption and diffusion; as a result, innovation resistance used to be traditionally measured indirectly by looking at 73
individuals’ innovativeness (Tansuhaj et al., 1991). The adoption and diffusion perspective examines how an innovation spreads through the market from the time of innovation while the innovation resistance perspective focuses on why consumers are unwilling to accept newness (Tansuhaj et al., 1991, Ram, 1989). Why is there a need to study innovation resistance? Ram (1987) believed that there is a pro-innovation bias in previous studies such as Rogers’ (1983) classification of late adopters as “laggards”. He argued that not all innovations are good for the consumer and they do not necessarily entail a significant improvement over existing products. Innovations are about a disruption in consumption and usage pattern and not all change is good, so resistance to a change is a normal response (Klein, 1967; Stiles and Robinson, 1973): ‘The vast majority of people who have no priori desire to change may be more typical and even more rational than a small minority of individuals who seek change for its own sake rather than, or in addition to, the intrinsic value of the innovations. Therefore, it is about time we paid respect to individuals who resist change, understand their psychology of resistance and utilise this knowledge in the development and promotion of innovations rather than thrust upon them preconceived innovations’ (Sheth, 1981, p.281). There are many new products introduced in the market each year but only a small fraction of them are commercially successful (Sheth 1989, Kleinjnen et al., 2009). One of the major reasons for product failure is resistance by consumers. Studying innovation resistance is also important for innovation adoption because the probability of adoption is higher when the initial resistance from consumers is overcome (Ram, 1989). It is very important to understand what factors are influential in making
74
consumers resistant against newness. If the resistance towards innovation is too high, then innovation dies. Innovation resistance is a special type of resistance to change which can be defined as ‘any conduct that serves to maintain status quo in the face of pressure to alter the status quo’ (Zaltman & Wallendorf, 1983) and it is associated with the degree to which individuals feel themselves threatened by change. The proposed definition of innovation resistance is ‘the resistance offered by consumers to an innovation, either because it poses potential change from a satisfactory status quo or because it conflicts with their belief structure’ (Ram and Sheth, 1989). Such a definition is broad as it essentially defines innovation resistance as ‘resistance to innovation’ (Kleijnen et al., 2009). Another drawback of such a definition is that, ‘not trying the innovation’ is not necessarily an indicator of innovation resistance as the initial objections toward an innovation can sometimes be overcome by offering consumers to try innovation for a certain period of time (Rogers, 2003). More comprehensive conceptualisation was suggested by Szmigin and Foxall (1998) in the way that innovation resistance was further narrowed down into three distinct types of behaviour: rejection, postponement, and opposition. As mentioned in Chapter 1, Szgmin and Foxall’s (1998) forms of innovation resistance have no operational measurement scale as they used qualitative research to identify the forms of resistance; therefore innovation resistance cannot be conceptualised within the abovementioned three forms in this research. Instead, Ram’s (1989) conceptualisation of innovation resistance will be used in this research. According to Ram’s definition, ‘when consumers resist from adopting an innovation, they are exhibiting resistance to the innovation. This resistance is behavioral and may
75
thus be referred to as behavioural resistance’ (p. 23). Innovation resistance, based on Ram’s (1989) suggestion, is a function of high perceived risk and habit of using current product or system. Therefore, high innovation resistance in this research refers to high perceived risk from consumers toward using innovation (solar panels) and reluctance to change as a result of habit of using current product (current energy consumption pattern). Although several authors acknowledge the importance of innovation resistance (e.g. Bredahl, 2001, Kozinets and Handelman, 1998), there has been much less devotion to the conceptualisation of innovation resistance and in the case of existence of such models (e.g. Ram, 1987; Kleijnen et al., 2009), little effort has been made to empirically validate the model. Continuing in this section, first the psychology of innovation resistance by Sheth (1981) will be discussed and then this will be followed by presenting three conceptual models of innovation resistance by Ram (1987), Bagozzi and Lee (1999) and Kleijnen (2009). 2.6.1- Psychology of innovation resistance In understanding why consumers show resistance, Sheth (1981) suggests that two psychological constructs are useful in understanding the psychology of innovation resistance: (1) habit toward an existing practice or behaviour; and (2) perceived risks associated with innovation adoption. Habit is believed to be the most influential factor in generating resistance to change and showing resistance is more common than innovativeness among individuals: ‘An individual is not likely to voluntarily pay attention to innovation communication or to voluntarily commit himself to try it out. In fact, his perceptual and cognitive
76
mechanisms are all likely to be tuned in to preserve the habit because the typical human tendency is to strive for consistency and status quo rather than to continuously search for, and embrace new behaviours’ (Sheth, 1981: p.275). Resistance to change is stronger when habit toward routine behavioural pattern or practices exists and those innovations incurring more change for the total behavioural stream (i.e. shopping, procuring and consuming) will be resisted more than those innovations generating change for a single behavioural act. Perceived risk is the second source of resistance to change. According to Sheth, there are three major types of risks: (1) aversive physical, social or economic consequences; (2) performance uncertainty; and (3) perceived side effects associated with the innovation. When the perceived risk on innovation is high, the resistance also becomes high and discontinuous innovations pose higher perceived risk than continuous innovations. Now based on the habit-risk constructs, it is possible to create a typology of innovation resistance which is presented as follows (Figure 8).
77
Figure (8)- A Typology of Innovation Resistance
Source: Sheth (1981)
Dual Resistance Innovations are those facing the strongest resistance from individuals because of both strong old habits and high risk perception about the innovations. Examples of this kind of innovations are social change or social programmes such as education, welfare, population control, nutrition and conservation. Habit Resistance Innovations are low risk but they require changes in existing habits. Examples of these innovations are continuous innovations which offer very little advantage beyond the existing products and consumers may reject them. Some innovations such as electronic calculators, light beer or low-tar-and-nicotine cigarettes are successful because they could improve existing habits rather than changing them by providing better advantages. Risk Resistance Innovations are those creating a high risk in consumers’ perception. Radical and highly discontinuous innovations are examples of this type of innovation. No Resistance Innovations are those with either no risk or no attempt to change existing habits. Fads and fashions are
78
examples of this type of innovation. This type of innovation offers high relative advantage and low risk. There are two models of innovation resistance in the literature which are by Ram (1987) and Kleijnen et al. (2009). 2.6.2- Ram’s (1987) model of innovation resistance In 1987, Ram proposed a conceptual model of innovation resistance based on three sets
of
factors,
namely
Perceived
Innovation
Characteristics,
Consumer
Characteristics and Perceived Innovation Propagation Mechanism. The model is shown in Figure (9). The process of making consumers resistant to innovations is explained by Ram (1987) as follows: ‘A consumer is exposed to an innovation through direct contact with the innovation and through one or more of several propagation mechanisms. If the consumer perceives a high degree of change in using the innovation, then he resists it. If the innovation encounters consumer resistance, then it needs to be modified by the firm to suit consumer needs and reduce resistance’ (p. 208) If the innovation is amenable to modification, then this process is repeated again until the modification is successful and innovation is accepted. If the innovation is not amenable to modification, then it is condemned to failure. For example, if the resistance is due to its adversity to a society’s beliefs and values then the modification should be consistent with the target market values and beliefs.
79
Figure (9) - A model of innovation resistance (Ram, 1987)
Ram’s (1987) model of resistance is commendable for providing a good understanding of innovation resistance but this model is only conceptual. Empirical examination of this model is difficult as the number of variables is too many. 2.6.3- Bagozzi and Lee’s (1999) model of resistance and acceptance of innovations Bagozzi and Lee (1999), on the basis of psychological action, provided a conceptual framework for the consumer decision making process toward innovations. Two general processes can be conceived in the decision process, which are goal setting and goal striving. Goal setting refers to ‘various appraisals and related information processing activities directed at the innovation and ends with a decision to adopt or not’ (p. and goal striving ‘consists of volitional processes transforming goals into goal attainment (e.g. planning and implementation activities) and ends with actual adoption 80
or not’ (p. 218). So the consumers’ decision making process is goal-oriented as they want to ‘achieve or experience or things they want to happen to them’ (p. 218). In the goal setting process, five stages are happening in decision making. In stage 1, a consumer is exposed to an innovation. The sources of communication such as advertising, word-of-mouth or opinion leaders can create motivation for consumers. Sometimes a consumer becomes aware of innovation through exploratory shopping or by using similar products. The initial response of a consumer is either resistance or openness to communication of an innovation. Resistance can occur actively, such as boycotting a product due to adversity to personal beliefs or values, or passively which is a consequence of habit (Sheth, 1981). If a consumer does not show resistance in the first stage, then the second stage occurs which is evaluation of the innovation. An evaluation will be made of the attributes of the innovation (i.e. relative advantage, compatibility, complexity). Sometimes, it is possible that consumers do not continue information processing beyond this stage and jump to the final stage of adoption or rejection. In case of adoption, this happens as an impulse purchase, and in case of rejection is because of the high perceived risk for consumers. In the third stage, positive or negative emotions occur in response to perceived opportunity and threat. Emotional acceptance of an innovation occurs as a result of joy, hope, pride or any other reward/results that one is expecting. In contrast, emotional resistance to innovation comes from negative emotions; in this situation individuals do not consider achieving what they expected by choosing the innovation. Other cognitive processes, such as self-efficacy and outcome expectations can influence emotional responses. Self-efficacy is defined by Bagozzi and Lee (1991) as ‘the confidence one has that he or she can do what it takes to adopt an innovation’ and
81
outcome expectations refer to ‘likelihood judgments that, if one acts, one’s goals will be achieved’ (p.221). Stage 4 is coping responses which is about ‘integration of the feelings and cognitive responses generated in stage 3 and felt action tendencies associated with these’ (p. 221). The coping responses can be in two forms: problem-focused coping and emotion-focused coping. In problem-focused coping, people use responses to ameliorate stress that arises from decision making. For example, by persuading family members that to adopt an innovation to achieve a desired result (i.e. achieving financial goals by adopting a new investment plan offered by company X). In emotion-focused coping, people use ‘thinking or cognitive-centred strategies to manage their emotional responses. For example, such classic psychological reactions as avoiding thinking about painful topics, denial that a problem exists, or distancing oneself from the thought of punishing consequences are sometimes used by decision makers to cope with negative emotions’ (p. 221). In the final stage, four types of decision can be made with respect to innovations. Consumers can decide to adopt or try innovation, to resist adoption, or to keep the decision open (undecided). Adoption, trying and resistance has been explained enough in this text and they are familiar subjects. Indecision occurs when information is not fully integrated; so making a decision is complex. The goal setting process is presented in Figure (10).
82
Figure (10)- Model of consumer resistance to and acceptance of innovations: A goal setting process
Source: Bagozzi and Lee (1991)
In the goal striving process the concern is how a decision, once made, is implemented. The process can be explained in five stages: appraisal and choice of mean for goal striving, action planning, initiation of goal pursuit, control of goal pursuit and actual adoption or not. In the first stage, three kinds of appraisals will be made by consumers: the first consists of ‘self-efficacy or confidence one has that he or she can execute the means in one’s means choice set’; the second is ‘the means-outcome expectancy for each possible means’; and the third is ‘the effect or degree of liking or disliking for each mean’ (p. 222). After a choice of means, consumers should decide how, when, where and how long to make action planning. Stage three is about the execution of the plan by performing the goal directed behaviours; an example would be a decision to buy a
83
HD TV when the price drops below £4000. In stage four, various control activities should be performed; these activities include: any impediments encountered along the way, resisting goal thwarting temptations that might arise, maintaining one’s motivation and commitment to goal attainment, and re-evaluating one’s goal, means and alternative goals during pursuit (p.223-224). In the final stage, successful choice and implementation of means will result in adoption, trial or failure to adopt innovations. When a decision to adopt or reject an innovation happens, the discrepancy between desired and actual outcome will be appraised and it leads to adoption-outcome emotions. The goal striving process is presented in Figure (11): Figure (11)- Model of consumer resistance to and acceptance of innovations: A goal striving process
Source: Bagozzi and Lee (1991)
84
2.6.4- Kleijnen et al.’s (2009) model of innovation resistance Kleijnen et al.’s (2009) model of innovation resistance is not as comprehensive as Ram’s (1987) model but unlike Ram’s model, which is only based on literature review, Kleijnen et al. (2009) used qualitative techniques to develop the model. In addition, the resistance is not considered solely as a simple obverse of adoption. Mostly in the literature, innovation resistance is considered only as ‘non-adoption’ which is not an appropriate approach. Innovation resistance in this model is considered to be a hierarchical construct manifesting itself in three forms of rejection, postponement and opposition. Two main groups of antecedents are identified for innovation resistance which are: (1) degree of change required; and (2) conflicts with the consumer’s prior belief structure. Postponement is the weakest form of innovation resistance in such a way that consumers in general find the innovation acceptable in principle but they decided not to adopt it at that time. This type of decision is not final but is delayed. Kleijnen et al. (2009) found that respondents in their focus group show postponement of innovation adoption as a result of changes in their usage pattern and economic risks. These consumers wait for the innovation to become a mainstream product and then make a final decision. Rejection is a stronger form of resistance than postponement and it occurs when consumers actively evaluate attributes of innovation which results in a strong unwillingness to adopt an innovation. Rejection can occur in some examples of unproven innovations such as McDonald’s ‘Arch Deluxe’ burger with the slogan ‘Burger with grown up taste’:
85
‘While McDonalds positioned this new burger as a more sophisticated food product for adults, consumers did not really consider McDonalds as a provider of sophistication but of convenience’ (Kleijnen et al., 2009: p.345). Opposition is the strongest form of resistance and it occurs when consumers are so convinced that the innovation is not suitable at all and decide to launch an attack. Negative word-of-mouth is very influential for opposition against an innovation. Opposition behaviour can be activated when functional and social risks are combined with a poor perceived image of innovation and a conflict with existing traditions and norms. The model is presented in Figure (12). Figure (12)- Model of innovation resistance (Kleijnen et al., 2009)
2.6.5- Strategies to Reduce Innovation Resistance It is useful to review what strategies are suggested to overcome innovation resistance. However, a common mistake might exist that the approaches to increase innovation adoption can also be used to offset innovation resistance. Kleijnen et al. (2009) clarify this as: ‘Innovation adoption research generally focuses on emphasising the benefits
86
of the innovation. With resistance, consumers appear to focus on adverse consequences as essential factors in their consumer decision making’. Following Ram’s work in modelling innovation resistance in 1987, he published a paper in 1989 which was about using strategies to reduce consumer resistance. To reduce innovation resistance, Ram (1989) suggested two strategies. One of them is the use of communication methods aimed to target consumers (Ram, 1989; Lee et al., 2002). The second type is modification of innovation to make it more acceptable for consumers (Ram, 1989). Ram (1989) studied how marketer control communication methods can reduce innovation resistance and Lee et al. (2002) studied the effect of both non-marketer control and marketer control on technology adoption (such as electronic banking). Using communication strategies is useful to reduce resistance caused by social or psychological risk (Ram, 1989). Scheunig (1974) described the importance of communication: ‘While the way in which individual consumers perceive a new product determines whether or not it is an innovation, there is still a great difference between consumer perception of an innovation and its market success. Even if consumers perceive differences, they do not develop preference. This is where communication enters into the picture’. At the early stage of the life of the innovation – from the concept testing stage to the market introduction stage – the marketer is the initiator of communication about the innovation; thus the marketer transfers the message to the consumer by change agents or mass media which are the two types of marketer controlled communication methods. Change agents have significant roles in reducing innovation resistance as they establish information exchange, motivate consumers and build a relationship
87
with consumers. For example, Lee et al. (2002) empirically showed that there was a positive relationship between receiving messages from financial institutions and adopting internet banking. Mass media is another method employed by firms to increase the rate of consumer adoption. There is a positive relationship between media expenditure and the rate of adoption (Horsky et al., 1983). Firms can communicate to their target customers in the form of advertisements, publicity releases or media reports on the positive features of the innovation after sensitising them to the utility of the product (Ram, 1989). It was suggested by Lee et al. (2002) that for each type of consumer – innovators, imitators or non-adopters – a right communication message through a suitable communication source should be transmitted. For example, innovators are interested to receive information in both written and conversational format from different channels, thus reinforcing the intended message through multiple channels is recommended. Word-of-mouth and interpersonal communication was shown to be effective for imitators; so the right communication strategy for diffusion change agents can be promoted not only by talking about the innovation to potential adopters but also encouraging them to make recommendations to their close family and friends. There are also some recommended strategies to influence non-adopters. According to Lee et al. (2002), non-adopters do not seem to receive sufficient information from communication sources and they need more assistance to adopt innovations. Therefore there is an uneven distribution of information and lack of communication. Midgley and Dowling (1993) proposed that even non-adopters could adopt a technology at the early stage of diffusion when they are exposed to the right communication. Conversational communication is very effective for non-adopters as
88
they do not perceive written information as useful when learning about technological innovations. This means that technological innovations require a rich conversational mode enabling instant feedback and personalised learning for the consumers. Apart from the role of communication in reducing innovation resistance, innovation modification is another strategy to reduce resistance. Innovation modification consists of altering the product concept to make it more acceptable to the consumer (Ram, 1987). If consumers resist against an innovation solely because of their unfavourable opinion about it, convincing them to change their opinion is not easy through only communication strategies. Midgley (1977) suggests that a manufacturer may first try to make modifications to the innovation to see if consumers make favourable changes in their response to the product. Innovation modification is not always a feasible strategy because it depends highly on the integration level between R&D and marketing team.
2.7- Consumer Behaviour in the Context of Energy Use Since this research is mainly focused on the adoption of alternative energy sources and sustainability driven innovation, reviewing relevant previous studies can further add insights to this topic. Faiers et al. (2007) investigated what major factors contribute to the adoption of energy efficiency products. They believe that other studies focus only on one single factor (for example, demographics) when investigating consumer behaviour in alternative energy use. Therefore, they endeavoured to fill this research gap by addressing a broader range of factors such as individuals’ cognitive abilities, values and attitudes, social networks, marketing, and products and services. Using a wide range of consumer behaviour theories, Faiers et
89
al. (2007) suggest that the following theories should be considered when aiming to develop a model of efficient energy use. 1- Consumer choice theories These theories provide insights into principles that direct or influence consumer choice. For example, the Behavioural Economic Theory (BET) by Diclementa and Hantula (2003) suggests that individuals purchase goods for maintenance, to accumulate, for pleasure and for accomplishment. Maintenance products are involved with basic needs wheareas accumulation products are standard items but of better quality. Pleasure products would be luxury items and accomplishment items are innovative products setting out the consumer as a leader. Individuals’ ‘needs’ are different between needing core products, necessary for everyday living, and peripheral products, which are luxuries and based on ‘want’. Purchasing an expensive energy efficient product such as solar panels can be explained by BET theory as a way in which to satisfy consumers’ ‘wants’ of pleasure and accomplishment. 2- Needs, values and attitudes influencing choice Individuals’ purchase decisions to some extent are influenced by their values and attitudes. Values are defined as ‘beliefs that an individual holds and which will guide their behaviour; for example self respect, or the maintenance of good health’ (Faires et al., 2007: p.4384). It has been suggested that demographics may provide subtle indications of a person’s values (Salmela and Varho,2006) . For example, Samela and Varho (2006) support the findings that ‘green consumers’ can be found within particular professions, such as the social and healthcare sectors. Attitude is defined as ‘the way that an individual views or behaves towards an object, often in an evaluative way’ (Moore, 2001 in Faires et al., 2007, p.4384). It has been suggested that attitudes
90
such as environmental concern, political orientation and perceived consumer effectiveness (PCE) have direct relationships with behaviour (Roberts, 1996; Lee and Holden, 1999). PCE is about the concept that ‘individuals who are confident that their individual action will lead to positive consequences for the environment will be motivated to act if they realise that they are part of a collective effort to achieve a certain goal’ (Faires et al., 2007, p.4285). Marketers need to pay particular attention to this fact when promoting social and societal messages about green products as this will give consumers a confidence that their action of purchasing a sustainable driven innovation will have a positive effect on the environment. Previous studies support that attitudes are excellent predictors of environmentally friendly behaviour (Laroche et al., 2001). However, it should be emphasised that consumers do not always purchase environmentally friendly products despite their stated intention to do so. 3- Learning, dissonance and cognitive complexity influencing choice Another main question is whether individuals with more knowledge or concern about a particular environmental issue are willing to pay a higher price for alternative products such as solar panels. Faires et al. (2007) highlight that the existence of higher levels of knowledge is an important predictor of pro-social and pro-environmental behaviour. Individuals analyse the content and structure of products and services in order to gain learning about them. Content of a product is about the mental evaluation of a product wheares structure is concerned with how the individual cognitively places the product in relationship to other products. The degree of evalution of a product by an individual depends on his or her ‘cognitive complexity’. If the degree of cognitive complexity is high, an individual utilises higher product information and marketing messages on the decision to adopt or reject a product. An individual will
91
normally accumulate knowledge over time but only employ a fraction of his or her knowledge at any one time. This will help them to reduce dissonance when purchasing a sustainable driven innovation. 4- Social learning Seeking advice from a social network is an alternative way of reducing dissonance. Individuals seek advice to increase their justification for a decision and learn from the social network. When presented with advice, they have the options to ignore, accept it in part or accept it unconditionally. This highly depends on the distance between the opinions of the advise seeker and the advisor. Individuals try to select appropriate social networks which are consistent to their values and opinions. According to the Balance Theory by Heider
in 1946, individuals will develop positive attitudes
towards those with whom they have had previous association. Social exchange theory suggests that individuals choose their relationships based on the demographic characteristics, personality attributes and their attitudes. For example, if both people believe that using solar panels is an efficient and environmental friendly source of energy, they are more likely to influence the purchase decision and exchange information. 5- The buying process and categorisation of consumers The buying process has been widely documented in the literature and most studies mainly follow the process of rational choice. Rational choice is about the evaluation of alternatives based on an evaluation of costs against benefits. Faires et al. (2007) highlight that rational choice is compatible with the innovation decision process suggested by Rogers (2003). Sufficient summary and explanations have been presented about Rogers’ decision making process and the categories of consumers
92
making purchase decisions who are innovators, early adopters, majority adopters, later adopters and laggards. Since this research is about innovation resistance, Rogers’ (2003) rationalisation about different types of innovation adoption decisions can add further insights. Given the innovation decision process explained in section 2.3.1.3, three types of innovation decisions are assumed by Rogers (2003). Two factors determine the type of a particular decision: (1) Whether the decision is made voluntarily and freely; and (2) who makes the decision. Based on these considerations, three types of innovation decision can be identified during innovation diffusion: (1) optional innovation decision, the decision of adoption or rejection is made by an individual independent of the decisions by other members of a system; (2) collective innovation decision, the decision to adopt an innovation is made collectively by all members of a group or social system; (3) authority innovation decision, the decision is made for the entire social system by a few individuals in positions of power or influence. In conclusion, the decision to behave in a certain way towards sustainability driven innovation is influenced by a wide range of internal and external forces. Any model aimed to explain the adoption of sustainability driven innovation should consider the theories explained above. Faires et al. (2007) suggest that three central forces should be considered in the study of efficient energy adoption that are attributes of the product (refers to Rogers’ attributes of innovation), the individual and the environment in which they are placed. Consistent with Faires et al.’s (2007) suggestion, this research develops and validates a model of innovation resistance towards using solar panels by considering all mentioned forces.
93
Chapter Summary This chapter focused on the study of literature around three main streams which are indispensable in establishing an appropriate foundation for this research. Firstly, this research is centred on innovation studies; therefore, the chapter began with the concept of innovation and the innovation diffusion process. It is important to understand what an innovation is and how innovations diffuse in societies. Three major models of diffusion were presented and it was discussed how consumer innovativeness and resistance of consumers can affect the diffusion speed. It was realised that Rogers’ theory of diffusion, despite its valuable contributions, has some limitations in its methodology of identifying consumer innovators; however the elements of the diffusion model such as the social system is no doubt influential in adoption or resistance of innovations and will be considered in this research. Then the focus was centred on two main dependent variables used in this study: consumer innovativeness and innovation resistance. It was discussed how consumer innovativeness has been defined and measured in previous studies and what the issues are in operationalization of this construct. A gap was identified for the developed consumer innovativeness scales in really new/radical innovation in the respected markets of infancy, so in Chapter 5 the process of scale development and validation will be discussed. What became clear after reviewing all consumer innovativeness scales was that measuring innovativeness at domain-specific level is preferred as it has higher predictive validity. The chapter ended with the concept of innovation resistance and its definitions. Three models of innovation resistance were presented and discussed and it was realised that existing models of innovation resistance are conceptual and have never been tested
94
empirically by quantitative methods. The next chapter will discuss what elements are influential in consumers’ innovation decisions and will build a theoretical framework for consumer innovativeness and innovation resistance.
95
CHAPTER 3 – THEORETICAL FOUNDATIONS
96
3.1- Introduction The core of this chapter is the development of theoretical foundations in relation to innovation decisions. Conceptualisation of a new model, explaining factors which influence innovation resistance of consumers, is presented. This will be a contribution to knowledge and management through proposing a practical model of innovation resistance through
introducing:
(1)
culture
related factors;
(2)
consumer
characteristics; (3) attributes of innovation; and (4) socio-demographic elements. Chapter 2 was mainly focused on the conceptualisation and operationalization of two main dependent variables of the research, i.e. consumer innovativeness and innovation resistance. This chapter will explore how each of the abovementioned four factors is influential on innovativeness and resistance of consumers. The developed models in previous studies in relation to innovation decisions and related factors can be categorised into four: (1) Decision process models: these models conceptually explain the process by which individuals make decisions in adopting or not adopting the innovation. Popular examples of these models are Rogers (2003) (which was presented in Chapter 2) and Bagozzi and Lee (1991). (2) Innovation adoption models: these models have been presented both conceptually and empirically in the literature. The empirical models are quite diverse using different methodological approaches but did not consider all four factors mentioned above in their model. Examples are: (1) Im et al. (2003) and Lassar et al. (2004) who considered two factors: sociodemographics and innovativeness; (2) Hirunyawipada and Paswan (2006)
97
considered two factors of innovativeness and perceived risk; and (3) Singh (2006) who considered cultural factors only. (3) Consumer innovativeness models: as consumer innovativeness itself is an important element in innovation adoption, it has been an interesting subject to investigate the antecedents of innovativeness. Examples of these models are: (1) Steenkamp et al. (1999) investigating three factors of national culture, personal values and socio-demographics; (2) Raju (1980) investigating personal characteristics and demographics; (3) Bartels and Reinders (2011) presenting a conceptual framework of consumer innovativeness using hierarchy of innovativeness and demographics, psychological characteristics as predictors of innovativeness; and (4) Ostlund (1974) using perceived attributes of innovation and consumer characteristics as predictors of innovativeness. (4) Innovation resistance models: these models were presented in Chapter 2 and as explained, they are either conceptual (although comprehensive) or, in the case of the empirical model (Kleijnen et al., 2009), qualitative-based only. To establish a foundation for the proposed conceptual model, the relationships between culture, socio-demographics, consumer characteristics and attributes of innovation will be presented in following,
3.2- Consumer Innovativeness and Innovation Resistance In Chapter 2, it was explained why consumer innovativeness is important in the diffusion of innovations but the main question in this research is how consumer innovativeness contributes to innovation resistance. Unfortunately there is no study to suggest the relationship between consumer innovativeness and innovation resistance 98
either conceptually or empirically, but there are many studies focused on the contribution of consumer innovativeness to innovation adoption. The importance of personal characteristics and specifically the innovativeness of consumers in understanding of innovation acception are expressed by Barlers and Reinders (2011) as follows: ‘… the failure of innovations is most often due to a firm’s lack of understanding of consumer needs. In this respect, a vast amount of literature on the acceptance of new products by consumers has focused on personal characteristics…more specifically; much attention has been paid to the concept of consumer innovativeness’ (Barlers and Reinders, 2011, p.601). As mentioned in Chapter 2, consumer innovativeness can be measured as a hierarchy of innate (general), domain-specific and actualised innovativeness. Actualised innovativeness is about the actual adoption of a product, so the argument is which form of innovativeness, innate or domain-specific, can predict actualised innovativeness better. So it is about the predictive validity of innate/general innovativeness vs. domain-specific innovativeness. What about the relationship between innate/general innovativeness with domain-specific? In other words, can we expect that a person who is innovative at a general level should also be innovative for specific innovations? Both questions were addressed in the literature and the predictive validity of general innovativeness especially is rather controversial as the empirical results show contradictory evidence. Some researchers reported general innovativeness with low or lack of predictive validity while some believe that measuring innovativeness in general can predict actual innovation decisions. There are also some results reporting
99
that both general and domain-specific innovativeness can predict actual innovative behaviour but using domain-specific is a better measure. Table (7) can clarify this further by presenting the empirical results of the relationship between consumer innovativeness in general and domain-specific with adoption of innovations. Table (7)- Empirical studies on consumer innovativeness and innovation decisions
Criterion variable
Dependent
Result(s)
Source
Foxall (1988)
variable(s) General
Overall number of
The correlation was
innovativeness using
adoption of 13 new
non-significant.
KAI measure
brands in
However, adopters of
supermarkets
continuous products were significantly different to adopters of discontinuous products on their KAI score
General
Willingness to adopt
innovativeness using computing
No predictive
Dershimer (1980)
validity is supported
KAI measure General
Adoption
of
food No predictive
innovativeness using products
validity is supported.
KAI measure
KAI is only
Goldsmith (1983)
correlated with brand awareness not adoption. Global
Personal computers
innovativeness
Global
Foxall and Bhate
innovativeness is
(1991)
significantly related to frequency of use General and domain- Clothing and
Domain-specific has
Goldsmith
specific
higher correlation
(1995)
innovativeness
electronic products
than general innovativeness with
100
et
al.
adoption of new products General
Online banking
General
innovativeness and
adoption
innovativeness is
domain-specific
negatively related
innovativeness
with adoption of
Lassar et al. (2005)
online banking. Domain-specific innovativeness can predict online banking adoption. Domain-specific
High technology
Domain-specific
Hirunyawipada and
innovativeness
product concept
innovativeness
Paswan (2006)
enhances the actual adoption of new products General
Ownership of
General
innovativeness
consumer electronics
innovativeness does
Im et al. (2003)
not have predictive validity Domain-specific
Internet shopping
innovativeness
Domain-specific
Cirtin et al. (2000)
innovativeness moderates the relationship between internet usage and internet shopping
Domain-specific
Website loyalty
innovativeness
Consumer innovators
Wang et al. (2006)
are significantly different in their website loyalty from non-innovators
General
Four different (non-
General
Vandecasteele and
innovativeness
existent) innovation
innovativeness is a
Geuens (2010)
packs for mobile
predictor of
phones
innovation adoption
101
Domain-specific
Fashion products
innovativeness
Domain-specific
Goldsmith and
innovativeness can
Hofacker (1991)
predict the adoption of fashion products
The results in Table (7) provide concrete evidence that, firstly, consumer innovativeness is related to innovation adoption and secondly, using innovativeness at domain-specific level (a tendency to buy and learn about new products within a specific domain of interest) can predict the adoption of innovations (actual behaviour) better than general innovativeness. Therefore it is logical to use domain-specific innovativeness in the theoretical model to predict innovation resistance. However, the relationship between domain-specific innovativeness and innovation resistance has never been empirically tested but having the evidence of the effect of domain-specific innovativeness on innovation adoption, it is possible to assume that those who are innovators at domain-specific level should manifest low innovation resistance, and therefore the proposition would be: P1: Consumer innovativeness at domain-specific level (DSI) has negative impact on innovation resistance. Although the use of domain-specific innovativeness is preferred than general innovativeness, this does not imply that general innovativeness will not be used in the model. The place of general innovativeness in the adoption process can be recognised at the knowledge stage of Rogers (1962) model as Goldsmith et al. (1995) found that those who are willing to try newness in general show high awareness of brands in food products but this does not necessarily lead to the adoption of new food products. Instead Goldsmith and Eastman (1995) proposed a model entailing the idea of general innovativeness, domain-specific innovativeness and actual innovative behaviour as 102
follows and they believe that this model can explain the relationship between consumer innovativeness as a personality trait with actual innovative behaviour better: Global Domain Specific New product purchase The model was tested empirically by Goldsmith and Eastman (1995) using fashion and electric products and it was shown that global or general innovativeness has a positive correlation with domain-specific innovativeness. Also global innovativeness has a weak correlation with new product purchase. It is plausible to propose the following: P2: Consumer innovativeness at general level is positively related to consumer innovativeness at domain-specific innovativeness.
3.3- Culture and Acceptance of Innovations 3.3.1- Culture: Definitions and operationalisations Culture has a profound influence on the innovative capacity of a society. A society’s cultural attributes and values provide direction to the process of technological development. Societies’ culture can either foster or inhibit innovation development. Culture is one of the most important determinants of consumer behaviour, including consumers’ reaction toward innovative products or any kind of newness. However, one of the main issues in cultural studies in marketing is how to define and operationlise culture. The abundant definitions and views about culture pose a challenge in all areas of marketing including innovation studies. In 1952, Kroeber and Kluckhohn combined a list of 164 definitions of culture. The way that culture should be measured and operationalised has always been a challenge but this has never overshadowed the attempts to study the influence of culture on consumption behaviour. According to the
103
report by Lenartowicz and Roth (2001) almost 10% of the articles published in 10 renowned journals from 1996 to 2000 used culture as an independent variable. What is culture and how does it influence consumer behaviour including consumer’s willingness to adopt innovative products? One of the earliest definitions of culture was provided by Tylor in 1871 (in McCort and Malhotra, 1993) as ‘the complex whole which includes knowledge, beliefs, art, morals, custom and any other capabilities and habits acquired by man as member of society’. Kluckhohn (1954) defines culture as part of the human makeup which is learnt by people as the result of belonging to a particular group, and is that part of behaviour which is shared by others; cross-cultural studies have traditionally used Hofstede’s (1980, 1997) definition of culture as ‘the collective programming of the mind which distinguishes the members of one group or category of people from another’. This approach defines culture from an etic perspective; an idea focusing on universal theories and concepts, and measures the values of subjects in a sample that identifies cultural characteristics based on the aggregation of these values (Soares et al., 2007; Luna and Gupta, 2001). The etic approach views culture and values at national level and it is referred to as something dispositional (Briley et al., 2000). The most used and famous proponents of the etic approach are Hofstede (1980) and Schwartz (1992). Hofstede (1980) proposed that cultures are comparable on five dimensions; he suggested this on the basis of statistical analyses of a multi-country sample on work-related values. These dimensions are individualism/collectivism, uncertainty avoidance, power distance, masculinity/femininity and long-term orientation. On the other side, culture can be studied using an emic approach. This approach views culture as a dynamic concept rather than a dispositional one. Defining culture
104
emically is acting like ‘the lens’ through which all phenomena are seen. It determines how these phenomena are apprehended and how individuals use culture to make decisions (Briley et al., 2000; Luna and Gupta, 2001). Unlike the etic approach, the emic focuses at individual level. Emic and etic approaches view culture from two sides of the same coin. The etic approach has been widely used in consumer behaviour and new product adoption (e.g. Mattila, 1999; Steenkamp, 2001; Henry, 1976; Yenyurt and Townsend, 2003) and this provides a major contribution to cross-cultural research because culture is a complex and multidimensional concept. Using dimensions to identify a culture, similar to Hofstede, can provide an opportunity for a marketer to discover how cultures are different or similar to each other. Nonetheless, it should be noted that the etic approach has been criticised for its inability to fully capture all relevant aspects of culture. Using national culture as the predictor of willingness to try new products is very prevalent but this cannot explain individuals’ cultural differences within a society. Briley et al. (2000) argue that using national culture is like a chronic dispositional trait and suggest that culture should be viewed more dynamically: ‘It would be a triumph of parsimony if many diverse cultural differences in decision making could be explained in terms of a single cultural disposition, such as individualism-collectivism. For this reason, the dispositional approach has attracted many advocates……Proponents of the individualism-collectivism construct have arrayed a number of country difference findings, but others studying similar kinds of decisions have observed no country differences’ (Briley et al., 2000, p.159).
105
In the emic approach or individual level, cultural differences are consistent with individual differences within each of the cultures included in the cross-cultural comparison (Leung, 1989). A further clarification of the term individual level analysis of cultural differences is provided by Berry and Dasen, 1974, p.19 in Leung (1989): ‘The individual-level approach to cross-cultural differences in psychological data is sometimes termed subsystem validation, in which hypotheses are examined both intraculturally and cross-culturally, so that explanatory variables may be tested at two levels’. In other words, if we assume that Y is the outcome of X and the average score of X and Y is higher in country A than country B, then the differences of Y can be interpreted as produced by differences in X. If the individual analysis of cultural differences is taken into account, then the analysis should further show that a higher level of X is related to a higher level of Y in each of the cultures (Leung, 1989). The variety of approaches in the definition and measurement of culture make it clear that culture is a very complex and broad concept and it is difficult to administer. With regard to the use of cultural dimensions as the antecedents of innovation decisions (i.e. consumer innovativeness, innovation adoption), the most prevailing aspect of culture is Hofstede’s (1980) national culture. Few studies used other aspects of culture such as individual values used by Henry (1976) in automobile ownership, traditionalism and fatalism used by Tansuhaj et al. (1991) in the willingness to try new products and personal values (resultant conservation and resultant self-enhancement) by Steenkamp et al. (1999) in consumer innovativeness. Now the main question is: what aspects of culture should be investigated in this research? Like many other studies, the national culture of Hofstede (1980) will be
106
used in this research. This research is cross-national and the single best method of cross-national investigation is Hofstede’s cultural dimensions. However, Hofstede’s cultural dimensions can never be used at individual level (see the official website of Geert Hofstede). Apart from national culture, two other aspects of culture, namely traditionalism and fatalism, will be used in the conceptual model. These two dimensions were only used by Tansuhaj et al. (1991) but their methodology and conceptualisation are problematic, an issue which will be explained in more detail later. Traditionalism and fatalism will be investigated at individual level. 3.3.2- National culture and innovation adoption National cultural dimensions of Hofstede (1980, 2003) are widely used in innovation adoption studies. Those researchers who used national culture were interested to investigate whether the nations’ characteristics of culture are influential in the adoption of innovation. Examples of these studies are presented in Table (8). Table (8)- National culture and innovation decisions in previous studies
Author (s) (Year)
Cultural
Dependent variable Results
variable(s) used Yeniyurt and Townsend (2003)
Individualism Uncertainty avoidance Power distance Masculinity
Diffusion rate of new products (Internet, mobile phones, PC usage)
Lynn and Gelb (1996)
Individualism Uncertainty avoidance
National innovativeness
107
- Uncertainty avoidance and power distance hinder the acceptance of new products - Individualism has a positive effect on new product adoption - Masculinity has no effect Individualism is positively and uncertainty
Steenkamp et al. (1999)
Individualism Uncertainty avoidance Masculinity
Consumer innovativeness
Singh (2006)
Individualism Uncertainty avoidance Power distance Masculinity
Consumer innovativeness
avoidance is negatively correlated with national innovativeness of countries Individualism and masculinity positively and uncertainty avoidance negatively affect the innovativeness of consumers Cultures characterised by small power distance, weak uncertainty avoidance and masculinity will demonstrate innovativeness.
Hofstede (1980, 2001) identified five dimensions of cultural variations based on four problems which societies face: (1) the relationship between the individual and the group; (2) social inequality; (3) social implications of gender; and (4) handling of the uncertainty inherent in economic and social processes. These dimensions are named in order as individualism/collectivism; power distance; masculinity/femininity and uncertainty avoidance. Although these values were developed in the work-related context, it is being used increasingly in business and marketing studies (Soares et al., 2007; Shamkarmahesh et al., 2003). Individualism refers to the degree to which the goals of individuals take precedence over the goals of the group. Power distance is about a country’s acceptance of differences in power. Uncertainty avoidance is a country’s intolerance of change, risk
108
and uncertainty. Masculinity refers to a country’s tendency to value masculine goals (i.e. money and achievements) over feminine goals (i.e. social relationships and services). Individualism and uncertainty avoidance are the most used dimensions of national culture and will be used in this study (Lynn and Gelb, 1996). Hofstede (1983) developed national scores on these dimensions for four different countries. The scores of cultural dimensions for countries in the Middle East are presented in Table (9). Table (9) - Hofstede’s (1980) index score in the Middle East Country Power Uncertainty
Individualism
Masculinity
Distance
Avoidance
Index
Rank
Index
Rank
Index
Rank
Index
Rank
Iran
58
24-25
59
20-21
41
27
43
17-18
Arab countries
80
44-45
68
24-25
38
25
53
28-29
According to the official website of Geert Hofstede, the investigation of cultural dimensions in the Arab world – which includes Egypt, Iraq, Kuwait, Lebanon, Libya, Saudi Arabia and the United Arab Emirates – reveals that the Muslim faith plays a significant role in people’s lives. Power distance and uncertainty avoidance are high in these countries. This means that these countries are highly rule-oriented to reduce uncertainty avoidance while unequal power and wealth exist in the societies. Masculinity is the third highest index in the Hofsted’s cultural dimension which shows that women have limited rights in the Arab world. Arabs are collectivist societies which mean that individuals have long-term commitment to the members of their family and the goals of the group take higher priority than the individual’s goals. Iran’s lowest Hofstede index score is individualism but this score is higher than Arab countries. The problem of using the Hofstede score is that these score were developed almost 30 years ago and the culture of a country changes over time. All the studies in
109
Table (7) which used national culture in their studies used the old scores of Hofstede and no attempt was made by them to update the scores in their research. In this research using the guidelines stated in the official website of Geert Hofstede, the updated scores of individualism and uncertainty avoidance will be calculated. Individualistic people tend to be independent from others and their individual goals take precedence over the group they belong to. In contrast, in collectivist societies, the goals of the group (e.g. family) have more priority than the goals of individuals and personal interests. In collectivist societies, identity is based on the social network to which one belongs (Yeniyurt and Townsend, 2003). People in individualistic societies do not tend to follow social norms but rather make decisions and initiate behaviours independently from others (Steenkamp et al., 1999). This is very close to what Bass (1969) and Midgley and Dowling (1978) suggested, that consumer innovators are those who are independent
from communicated experience from
others.
Individualism/collectivism is the most employed dimension of national culture in consumer behaviour (Yeniyurt and Townsend, 2003; Zhang and Gelb, 1996). Previous studies indicated that consumers in countries with higher score on individualism are more innovative and the rate of innovation diffusion is higher (Steenkamp et al., 1999; Yeniyurt and Townsend, 2003; Singh, 2006). Moreover, individualistic cultures are more hedonistic and materialistic than collectivist cultures (Hofstede, 1984; Triandis, 1989), so technological products should appeal more to individualistic cultures. Based on these explanations, the following are proposed. P3: Countries characterised by higher (lower) score on individualism will demonstrate significantly higher (lower) innovativeness at general level.
110
P4: Countries characterised by higher (lower) score on individualism will demonstrate significantly higher (lower) innovativeness at domain-specific level. P5: Countries characterised by higher (lower) score on individualism will demonstrate significantly lower (higher) innovation resistance. The extent to which individuals feel uncomfortable in the presence of vagueness and ambiguity refers to uncertainty avoidance. Cultures which are characterised by lower uncertainty avoidance are more tolerant of improbability and ambiguity (Yeniyurt and Townsend, 2003). In countries with high uncertainty avoidance, a feeling of ‘what is different is dangerous’ prevails (Hofstede, 1991). Steenkamp et al. (1999) state that ‘when cultures are high in uncertainty avoidance, consumers are resistant to change from established patterns and will be focused on risk avoidance and reduction’. In contrast, people in countries with lower uncertainty avoidance feel that ‘what is different is curious’ (Hofstede, 1991) prevails. Purchasing innovativeness products, especially those products with high degree of discontinuity (i.e. really new and radical innovations), involves making changes, taking risks and accepting uncertainties (Lynn and Gelb, 1996). Steenkamp et al. (1999) and Singh (2006) found that uncertainty avoidance is negatively related to consumer innovativeness. The following are proposed: P6: Countries characterised by higher (lower) score on uncertainty avoidance will demonstrate significantly lower (higher) innovativeness at the general level. P7: Countries characterised by higher (lower) score on uncertainty avoidance will demonstrate significantly lower (higher) innovativeness at the domainspecific level.
111
P8: Countries characterised by higher (lower) score on uncertainty avoidance will demonstrate significantly higher (lower) innovation resistance. 3.3.3- Traditionalism and acceptance of innovations Empirical studies on the relationship between traditionalism with consumer innovativeness and innovation resistance is very few. Two studies exist which tested this relationship empirically: (1) Tansuhaj et al. (1991) who investigated the effect of traditionalism with innovation resistance toward five groups of products crossnationally; and (2) Laukkanen et al. (2007) who investigated the effect of the tradition barrier on mobile banking among mature consumers. Both of these studies have found no significant relationship. The relationship between individuals’ traditions and willingness to try new products should logically exist as this is reflected on conceptual models of innovation resistance such as Ram (1987) and Kleinjnen et al. (2009). Perhaps one of the reasons of lack of empirical support is the methodological problems in the studies by Tansuhaj et al. (1991) and Laukkanen et al. (2007). In the study by Tansuhaj et al. (1991), published in the International Marketing Review, the authors claimed that ‘willingness to try a new product’ is an indication of innovation resistance. Looking at the definitions and conceptualisation of the two terms: ‘Consumer Innovativeness’ and ‘Innovation Resistance’ in Chapter 2 make it clear that the definition used by Tansuhaj et al. (1991) is more suitable to ‘Consumer Innovativeness’ than ‘Innovation Resistance’. Innovation resistance, as stated before, is not only about simply ‘not trying the product’, because sometimes consumer can try a product as a trial and then decide not to adopt it. Furthermore, innovation resistance manifests itself as forms of rejection, postponement and opposition. So what Tansuhaj et al. (1991) did was to
112
measure consumer innovativeness not innovation resistance. Another problem in their study is the low reliability of some measures. The Cronbach Alpha of traditionalism in four countries, out of six countries they investigated, is below the minimum level of 0.70 (i.e. Alpha is 0.42 in Korea). This low reliability of the traditionalism measure also exists in Laukkanen et al.’s (2007) study. What is traditionalism and how is it operationalized? Traditionalism is the degree of people’s adherence to cultural values, traditions and norms (Tansuhaj et al., 1991). Douglas and Urban (1977) measured traditionalism by the specific roles of women at home and in society, so in less traditional societies women are more free to work outside the home. Tan and McCullough (1985) measured traditionalism by measuring consumers’ attitudes towards Confucian traditions and norms. Tansuhaj et al. (1991) suggest to measure traditionalism by investigating the adherence of individuals to their culture in terms of: (1) their conformity with traditional values; (2) worthiness of culture to be preserved; (3) young people adopting new values; (4) wanting loved ones to behave consistently with tradition; and (5) people mixing other cultural values with their own. In this research, the Tansuhaj et al. (1991) measurement approach will be taken. Although empirically the relationship between traditionalism and trying newness has not been supported, conceptually, in general, traditional individuals should be less willing than others to try newness, especially when an innovation requires them to deviate from traditions. Sheth (1981) stated that: ‘Tradition barrier is the first source of psychological resistance. When an innovation requires customer to deviate from established traditions, it is likely to be resisted. The greater the deviation, the greater the resistance will be.’
113
Also Gatington and Robertson (1985) propose a positive relationship between diffusion rate and innovations’ compatibility with social system values. So it is logical to assume that those who are much adhered to keep their values and norms should be less innovative. The relationship between traditionalism with domain-specific innovativeness and innovation resistance of specific products has not been supported and proposed in the studies but it can be conceived that traditionalism should negatively influence innovativeness of consumers at the general level; therefore the following is proposed for the conceptual model. P9: Traditionalism of consumers negatively affects innovativeness at the general level. 3.3.4- Fatalism and acceptance of innovations Fatalism is conceptually described as fate orientation or the individual’s relationship with nature. Being fatalistic denotes that all events are predetermined by fate and unchangeable by humans (Kluckhohn and Strodtbeck, 1961). Schneider and Parsons (1970) studied fatalism as one dimension with the locus of control construct and found that individuals who have a fatalistic orientation exhibit external locus of control. Studies on fatalism and trying new products are very few; in particular, there is no recent research on this topic and the latest one was published in 1991 by Tansuhaj et.al; they found that fatalistic individuals are less willing to try new products but they perceive less risk when trying them. So, risk is the less important determinant of purchase behaviour in fatalistic societies (Green and Langeard, 1975). However, some contradictory results exist in other studies. For example, Wright et al. (1978) found that fatalistic individuals are likely to avoid an uncertain situation which means the perceived risk is high. So, when a highly innovative product is introduced
114
to a market, because of its high degree of discontinuity, it can cause uncertainty, an idea which was supported by Rogers (1983) who found that in general, earlier adopters are less fatalistic than late adopters. Therefore those who are fatalistic are less likely to alter their lifestyle by trying new products. It is expected that those who are fatalistic are less innovative at general level: P10: Fatalism of consumers negatively affects innovativeness at a general level.
3.4-
Socio-demographic
Characteristics
and
Acceptance
of
Innovations Socio-demographics are considered as an expected driver of innovation adoption and innovation resistance in the literature. It has also been of interest to researchers to investigate whether innovators are different to non-innovators in their sociodemographic characteristics. A wide range of socio-demographic characteristics were used in the literature such as consumers’ age, level of education, income, occupation and family size. Some studies, in particular earlier ones, suggest that those who are likely to try new products are younger, have higher education and income; but these results are not always consistent. Table (10) presents the empirical results of the relationship between socio-demographics with innovation adoption and consumer innovativeness: Table (10)- Socio-demographics and innovation decisions: empirical results
Author
Socio-
Dependent
Method of
Product
demograp
variable
analysis
Example
Results
hic anteceden t Arts et al.
Age,
Innovation
Meta-
(2011)
Education,
Adoption
Analysis
115
N/A
None of the socio-
Income
demographic antecedents are the significant drivers of innovation adoption.
Laukkanen
Age
et al. (2007)
Innovation
T-test
Resistance
Mobile
Older
Banking
respondents perceive more risk in using mobile banking.
Labay and
Age,
Innovation
Multivariate
Solar energy
The adopters
Kinnear
Education,
adoption
nominal
system
are younger,
(1981)
Income,
scale
more highly
occupation
analysis
educated,
al status,
higher in
family life
income,
cycle
earlier in family life cycle and higher in occupation status.
Goldsmith
Age,
Domain-
and Flynn
Education,
specific
(1992)
Income
innovativeness
T-test
Fashion
Adopters and
products
non-adopters are significantly different in their income. There is no significant difference for age and
116
education. Im et al.
Income,
New product
(2003)
length of
adoption
Path analysis
residence,
Consumer
Age and
electronic
income are
products
strong
education,
predictors of
age
new product adoption
Lassar et al.
Education,
Domain-
Correlation
Online
All socio-
(2006)
income,
specific
banking
demographic
age
innovativeness
variables are
and general
significantly
innovativeness
correlated with consumer innovativenes s
Tellis et al.
Age,
Global
(2009)
Education,
innovativeness
Regression
penetration
Except family
of the 16
size, the rest
Income,
new
of variables
Low
products
are significant
mobility,
from
on
Family
Euromonitor
innovativenes
size
’s market
s
data Steenkamp
Income,
General
Hierarchical
et al. (1999)
age,
innovativeness
linear
shown to
modelling
negatively
education
N/A
Only age was
influence on innovativenes s in general.
It is clear from Table (10) that, in most studies, socio-demographic variables were reported to be related to consumer innovativeness, at the general and domain-specific levels, and innovation adoption. In this study three elements of socio-demographics
117
will be used: age, education, gender. Gender has never been used in previous studies to examine its relationship with innovation decisions and it will be used in this study but no hypothesis can be developed as there is no evidence in previous studies. The propositions are as follows: P11: Higher education levels demonstrate significantly higher general innovativeness. P12: Higher education levels demonstrate significantly higher domain-specific innovativeness. P13: Higher education levels demonstrate a significantly lower level of innovation resistance. P14: Age is negatively related to consumer innovativeness at general level. P15: Age is negatively related to consumer innovativeness at domain-specific level. P16: Age is positively related to innovation resistance.
3.5- Perceived Innovation Characteristics and Innovation Acceptance The perceived characteristics of innovation are the major drivers of accepting innovations (Gatington and Robertson, 1985; Rogers, 2003; Arts et al., 2011; Ostlund, 1974). Again there is no direct empirical study for the relationship between innovation characteristics and innovation resistance. The famous scheme of evaluating innovations is identified by Rogers (1962, 2003) as five attributes of innovation: Relative Advantage, Compatibility, Observability, Trialability and Complexity. Relative Advantage is about economic gain, any kind of financial saving or a social benefit that a consumer can get by adopting an innovation. This means that the innovation can provide higher value over previous products. Compatibility is defined 118
as the degree to which an innovation is perceived as consistent with existing values, past experiences and needs of the receiver (Rogers and Shoemaker, 1971). Observability (or communicability) of an innovation is the ease and effectiveness with which the results of an innovation can be disseminated to others (Rogers and Shoemaker, 1971). This means how easily the benefits of the products can be transmitted to the consumer. Observability has two dimensions: tangibility of the benefits from adopting the innovation, and ability of the marketer to communicate the benefits. Complexity of an innovation has two dimensions: one is the complexity of the idea (Is it easy to understand?), and the other is the complexity of execution (is it easy to implement?). Trialability means how easily the innovation can be tried by the consumer prior to adoption, and impact on the perceived risk associated with the innovation. The relationship between perceived attributes of innovation with innovation adoption and innovation resistance has been conceptually and empirically supported in the literature. Conceptually, Gatington and Robertson (1985) in their model of innovation diffusion and Ram (1987) in his model of innovation resistance concede the relationship between perceived attributes of innovation with innovation adoption and innovation resistance. For example, Gatington and Robertson (1985) state that: ‘Innovation
characteristics
affect
speed
of
diffusion.
Relative
advantage,
compatibility, trialability, and observability are positively related and complexity and perceived risk are negatively related’ (p. 853). In addition, the attributes of innovation are considered to be the antecedents of innovation resistance in Ram’s (1987) model of innovation resistance (Figure 9). In the persuasion stage of the innovation decision process (Figure (3)), the characteristics
119
of innovation are exposed to consumers and form attitudes in their minds. With favourable or unfavourable attitude toward attributes of innovation, consumers will move to the decision stage to adopt or resist. According to Ram (1987), lower perceived relative advantage, compatibility, trialability and observability of innovations and higher perceived complexity of innovations will result in higher innovation resistance. From the empirical viewpoint, the meta analysis study by Arts et al. (2011), after reviewing 77 relevant studies, investigated the effect of perceived attributes of innovation on intention to adopt and actual adoption of innovation. The results show that innovation characteristics have a strong effect on adoption process stages. Compatibility and relative advantage are strong drivers of intention behaviour and complexity has a positive effect on intention, but negatively affects adoption behaviour. No support was found for the effect of observability and trialability. In the study by Labay and Kinnear (1981), the adopters of solar energy systems find the product offering advantages over other energy sources, less risky, less complex and more compatible with their personal values. No support was found for observability and trialability. Finally the evidence from two studies of new consumer packaged goods by Ostlund (1974) suggests that the effect of perceived attributes of innovation on innovation adoption is stronger than personal characteristics variables, however similar to other studies, the effect of relative advantage, compatibility and complexity is stronger. It seems that despite the existence of conceptual support for the relationship between observability and trialability with innovation resistance and innovation adoption, no empirical support exists. Therefore observability and trailability will not be considered in the proposed theoretical model in this research.
120
Also there is no evidence that attributes of innovation are related to consumer innovativeness, so only the relationship with innovation resistance will be hypothesised as follows: P17: Perceived relative advantage of innovation is negatively related to innovation resistance. P18: Perceived compatibility of innovation is negatively related to innovation resistance. P19: Perceived complexity of innovation is positively related to innovation resistance.
3.6- Preliminary Model of Innovation Resistance The author proposes that the influencing factors of innovation resistance are derived from four major areas: (1) cultural elements at national and individual level; (2) characteristics of consumers, of which the most important one, the innovativeness of consumers, will be used; (3) perceived attributes of innovation and (4) sociodemographic variables. The preliminary model is designed to describe the most important factors, which are supposed to influence consumers’ resistance to innovations. The initial model is based on the extensive review of literature for deriving factors potentially affecting innovation resistance. The preliminary innovation resistance model is tested with the propositions discussed in this chapter and they are summarised in Table (11). The model is also presented in Figure (13). Table (11)- Propositions
Proposition Proposition number Consumer innovativeness at domain-specific level (DSI) has negative 1 impact on innovation resistance. Consumer innovativeness at general level is positively related to 2 consumer innovativeness at domain-specific innovativeness. 121
3
4
5 6
7
8
9 10 11 12 13 14 15 16 17 18 19
Countries characterised by higher (lower) score on individualism will demonstrate significantly higher (lower) innovativeness at general level. Countries characterised by higher (lower) score on individualism will demonstrate significantly higher (lower) innovativeness at domainspecific level. Countries characterised by higher (lower) score on individualism will demonstrate significantly lower (higher) innovation resistance. Countries characterised by higher (lower) score on uncertainty avoidance will demonstrate significantly lower (higher) innovativeness at general level. Countries characterised by higher (lower) score on uncertainty avoidance will demonstrate significantly lower (higher) innovativeness at domain-specific level. Countries characterised by higher (lower) score on uncertainty avoidance will demonstrate significantly higher (lower) innovation resistance. Traditionalism of consumers negatively affects innovativeness at general level. Fatalism of consumers negatively affects innovativeness at general level. Higher education levels demonstrate significantly higher general innovativeness. Higher education levels demonstrate significantly higher domainspecific innovativeness. Higher education levels demonstrate significantly lower innovation resistance. Age is negatively related to consumer innovativeness at general level. Age is negatively related to consumer innovativeness at domainspecific level. Age is positively related to innovation resistance. Perceived relative advantage of innovation is negatively related to innovation resistance. Perceived compatibility of innovation is negatively related to innovation resistance. Perceived complexity of innovation is positively related to innovation resistance.
122
Figure (13)- reliminary model of innovation resistance
Chapter Summary The focus of this chapter was to provide appropriate theoretical foundations for this research. After an extensive literature review in Chapter 2, it was identified that the potential factors of innovation resistance are culture, consumer innovativeness, characteristics of innovation and socio-demographics. A conceptual model was developed using the extant studies on how each element influences the acceptance of innovations. As the number of studies on innovation resistance is few, in most cases, the results of innovation adoption studies were used as potential grounds for developing the conceptual model. The proposed model of innovation resistance is the
123
first in this area which simultaneously investigates all mentioned factors in one model and it is to be examined empirically across three countries in the Middle East.
124
CHAPTER 4 – RESEARCH METHODOLOGY
125
4.1- Introduction The first three chapters have identified the research gaps in innovation resistance studies. A theoretical model is developed for the potential antecedents of innovation resistance using an extensive review of relevant studies. The methodology chapter is divided into three major sections. In the first section, the author’s position in research philosophy is explained. It will be discussed as to what research paradigm is more suitable for this research and why. The second section is concerned with research design and explains the procedures necessary for obtaining the information needed in this research. The necessary steps in research design are defining the information required, determining the nature of research, selecting appropriate measures, designing questionnaires, specifying sampling technique and sample size and, finally, development of a plan for data collection. In the third section, the procedure to develop and validate a scale to measure consumer innovativeness for the really new/radical innovation scenario in the respected markets of infancy will be presented. As for measuring consumer innovativeness at domain-specific level, a new scale is required (see section 2.5.3); before doing the analysis of the conceptual model, it should be ensured that the appropriate measurement scale is available and has been tested for reliability and validity.
126
4.2- Research Philosophy An overview of some important research paradigms in social science, such as positivism, interpretivism and falsificationism are provided in the following paragraphs. This will be the basis for deciding on a research paradigm appropriate for this study before selecting adequate research methods. In every marketing research study, theory plays a vital role; theory is defined as ‘a conceptual scheme based on foundational statements, or axioms, that are assumed to be true’ (Malhotra and Birks, 2006). Theories are used by market researchers as foundations of interpreting findings. A good marketing research study is one founded upon theory and whicih contributes to the development of theory to improve the powers of explanation (Malhotra and Birks, 2006). The main question is: what perspective should be used in developing theory? In other words, what approach or paradigm should be used to assert that a research study is scientific? It is a popular conception that scientific knowledge is captured by the slogan ‘science is derived from the facts’ (Chalmers, 1999). So how should researchers access the facts? In marketing, empiricism, and more specifically positivism, has been a dominant perspective to derive the facts (Malhotra and Birks, 2006). The British empiricists of the seventeenth and eighteenth centuries (i.e. John Locke, George Berkelet and Davd Hume), believed that all knowledge should be derived from ideas implanted in the mind by way of sense perception (Chalmers, 1999). In positivism, the central belief is that knowledge should be derived from the facts of experience. So positivism, in the case of a marketing research study, views consumers’ behaviour and marketing phenomena as something scientific, similar to natural science in the following way:
127
‘Marketing researchers of this persuasion adopt a framework for investigation akin to the natural scientist. For many, this is considered to be both desirable and possible….. the main purpose of a scientific approach to marketing research is to establish causal laws that enable the prediction and explanation of marketing phenomena. To establish these laws, a scientific approach must have, as minimum, reliable information or facts’ (Malhotra and Birks, 2006, p.136). In contrast to positivism, which is based on quantitative technique, an interpretivist approach also exists. Interpretivism, which is using qualitative research, does not rely on measurement or establishment of facts (which is the case in positivism). Interpretivism is about a direct investigation and description of phenomena without theories or concepts about their causal explanations and free from unexamined preconditions and as experienced from the first-person’s point of view (Stanford Encyclopaedia of Philosophy, 2006). These two main schools of thought in marketing are also identified by alternative names (Table (12)). Table (12)- Alternative paradigm names
Positivist
Interpretivist
Quantitative
Qualitative
Objectivist
Subjectivist
Scientific
Humanistic
Experimentalist
Phenomenological
Traditionalist
Revolutionist
Source: Malhotra and Birks (2006) Positivism and interpretivism are considered to be the two main research paradigms that are used by marketing researchers (Hussey and Hussey, 1997). Table (13) provides a better understanding of paradigm features.
128
Table (13)- Paradigm features
Issue
Positivist
Interpretivist
Reality
Objective and singular
Subjective and multiple
Researcher-respondent
Independent of each other
Interacting with each other
Values
Value-free = unbiased
Value-laden = biased
Researcher language
Formal and impersonal
Informal and personal
Theory and research
Simple determinist
Freedom of will
design
Cause and effect
Multiple influences
Static research design
Evolving design
Context-free
Context-bound
Laboratory
Field/ethnography
Prediction and control
Understanding and insight
Reliability and validity
Perceptive decision-
Representative surveys
making
Experimental designs
Theoretical sampling
Deductive
Case studies Inductive
Source: Malhotra and Birks (2006) It is not logical to assert that a particular paradigm is stronger than another; in every research paradigm, there are relative advantages and disadvantages, it is only a matter of how to extract the facts for scientific research. Based on Table (13), in the positivist view, it is supposed that reality is ‘out there’ and the only issue is to find the most effective and objective way to collect information about this reality. Interpretivism stresses that reality is dynamic and evolving and there may be wide arrays of interpretations of realities or social acts. One of the important advantages of positivists over interpretivists is that they set aside their own personal values. In positivism, the measurements of objects are guided by established theoretical propositions; this helps to remove any potential bias in research. In interpretivism, the values of researcher affect how they probe and interpret the respondents. The 129
paradigm in this research is very similar to what positivism is proposing, however positivism is not followed as the only paradigm in this research as the main weakness of this approach is deriving facts through deduction. Using deduction as the only way of extracting facts in research has some problems and, to solve this, a combination of positivism and falsificationism is used which will be discussed shortly. What was presented in Chapter 3 as a theoretical foundation precisely follows the positivist approach. Positivism seeks the development of theory through establishing causalities. The positivists seek to develop and use consistent and unbiased measurements by establishing reliability and valid rules (Malhotra and Birks, 2006). However, it should be mentioned that at the preliminary stages of this research, qualitative technique was used in two ways. Firstly, it was used through reviewing literature to develop and understanding the research problem. Reviewing literature in this research was a kind of observing and comparing the results in previous studies to form the premises in Chapter 3. Second, it used the focus group technique to generate items for scale development purposes (the second research objective). Malhotra and Birks (2006) explain this process as ‘the positivist perspective of qualitative research’: ‘the positivist perspective of qualitative research is to see it as a set of techniques, applied as preliminary stages to more rigorous techniques that measure’ (p.136). The main issue in positivists’ approach is the establishment of their legitimacy by deduction (Chalmers,1999). Deduction is defined as ‘a form of reasoning in which a conclusion is validly inferred from some premises, and must be true if those premises are true’ (Malhotra and Birks, 2006, p.141). Most studies in marketing which use a quantitative technique use deduction to develop premises. This approach is also referred to using ‘logic’ in extracting the facts: ‘logic is concerned with the deduction
130
of statements from other, given, statements. It is concerned with what follows from what’ (Chalmers, 1999, p.42). The common statements in published papers in marketing journals in developing hypotheses such as ‘it is logical to assume that…’, ‘it is possible to deduce that…’ and etc, are all referring to the use of deduction in marketing studies. Using deduction for prediction and explanation of results is problematic but it is valid to use deduction from a well established theory and develop hypotheses, choose variables and measures (Ali and Birley, 1999). Valid results through deduction are gained when all premises are always true and this is something not very common, especially in human science. Logic (or deduction) alone cannot be used to extract true facts: ‘logic alone is not a source of new truths. The truth of the factual statements that constitute the premises of arguments cannot be established by appeal to logic’ (Chalmers, 1999, p.43). To solve the problems of choosing between deduction or positivism, an alternative paradigm can also be used which is ‘falsificationism’ (Chalmers, 1999). The idea was first proposed by Popper who became suspicious of Freudians and Marxists when they were supporting their theories by providing much evidence; the more facts, the better. To Popper, it seemed that these theories can never go wrong because they were so flexible as to include any instances of human behaviour with their theory. Popper then ruled out a range of observable statements that Freudians and Marxists failed to explain, so he could finally arrive at the idea that scientific theories are falsifiable (Chalmers, 1999). The process of extracting facts by the falsificationism perspective is described by Chalmers (1999) as follows: ‘Theories are construed as speculative and tentative conjectures or guesses freely created by the human intellect in an attempt to overcome problems encountered by
131
previous theories to give an adequate account of some aspects of the world or universe. Once proposed, speculative theories are to be rigorously and ruthlessly tested by observation and experiment. Theories that fail to stand up to observational and experimental tests must be eliminated and replaced by further speculative conjectures’ (p. 60). Science progresses by trial and error and it can never be legitimately said that a theory is always true; it is better to say that the theory is the best available. If such a paradigm is taken, then science does not involve induction, because in induction all premises should always be true. In falsificationism, some theories can be shown to be false when observation of experiments shows contradictory results. It is never possible to arrive at universal laws and theories by using deductions alone (Chalmers, 1999). Science in falsificationism consists of hypotheses that are tentatively proposed to describe behaviour of some aspects in the world. If a hypothesis is to form part of science, it must be falsifiable. If a hypothesis is not falsifiable, then ‘the world can have any properties whatsoever, and can behave in any way whatsoever, without conflicting with the statement’ (Chalmers, 1999, p.63). For example, the statement ‘not every Wednesday is it raining’ is not falsifiable in a way that no observation or experiment can be presented against it, but this statement is not scientific and explains nothing. A good scientific law or theory is falsifiable because it makes definite claims about the world. The more a theory claims, the higher the probability to be falsified. If a theory is falsified then a new hypothesis can be proposed and this is how science progresses; in other words, we learn from our mistakes and science progresses by trial and error. The process of testing a hypothesis by falsificationism is explained by Chalmers (1999) in the following paragraph:
132
‘Falsifiable hypotheses are proposed by scientists as solutions to a problem. The conjectured hypotheses are then criticised and tested. Some will be quickly eliminated. Others might prove more successful. These must be subject to even more stringent criticism and testing. When an hypothesis that has successfully withstood a wide range of rigorous tests is eventually falsified, a new problem… has emerged. This new problem calls for the invention of new hypotheses, followed by renewed criticism and testing’ (p. 69). In this research, hypotheses were developed using the deductive approach. The area of the research problem, which is antecedents of consumer innovativeness and innovation resistance, was first identified by deduction. This resulted in the development of an established theoretical framework with causal relationships. Then the instruments to measure specified variables were selected and respondents gave answers to specified questions. This process was explained in Chapter 3 and up to this stage the research followed the positivist approach. In analysing the results, however, the author of this research used the falsificationist approach. The author believes that hypotheses are falsifiable and should be tested more rigorously in new contexts. When a hypothesis is rejected, a new premise should be presented and tested further and this is how we can have a better understanding of the factors of consumer innovativeness and innovation resistance. The proposed model of innovation resistance in Chapter 3 will be tested in three Middle Eastern countries in terms of its falsifiability and if it is falsified (which is highly probable in human science), this will provide new opportunities for future research. The position of research paradigms in different stages of this research is sketched in Figure (14).
133
Figure (14)- Research paradigms and research process
Observation: comparing previous results
Deduction
Hypotheses and conceptual model
Experiment
Results and analysis
Falsificationsim
New research and premises
4.3- Research Design According to a definition proposed by Malhotra and Birks (2006), a research design is defined as ‘a framework or blueprint for conducting a marketing research project. It details the procedures necessary for obtaining the information needed to structure or solve marketing research problems’ (p.58). This research follows the steps recommended by Malhotra and Birks (2006) in research design but it should be emphasised that other sources of marketing research generally recommends the following steps (e.g. Shiu et al., 2009; Gravetter and Orzano, 2010). In developing a good research design for an effective and efficient marketing research project the following steps should typically be taken: (1) defining the required information for the research; (2) deciding the nature of research designs as being exploratory, descriptive
134
or causal; (3) using appropriate measures; (4) constructing an appropriate form of data collection or questionnaire; (5) specifying the sampling technique and sample size; (6) developing a plan for data collection (Malhotra and Birks, 2006). The process of research design in this research follows the abovementioned steps: Defining the required information for the research: The required information in this research is clear. Recalling section 1.3.1 , the key research questions are identified and to answer those questions, the required information is: (1) individual cultural characteristics in the Middle East; (2) innovativeness of Middle Eastern consumers in general and in domain-specific products (solar panels); (3) socio-demographic information; and (4) the degree of resistance in using solar panels. Deciding the nature of research designs: In the second step, the nature of the research should be determined. The nature of a research study can be generally classified as exploratory, descriptive and causal (Malhotra and Birks, 2006). The objective of exploratory research is to provide in-depth insight into, and an understanding of, marketing phenomena. Exploratory studies are useful if a subject is difficult to treat in a quantitative manner, such as the atmosphere of a restaurant, or in cases where more precise definition of problems and additional insights are needed. Exploratory research requires long periods of field work using a variety of techniques as the researcher has a long standing interest in a topical area (Stebbins, 2001). The methods that can be used in exploratory studies are: expert surveys; pilot surveys; secondary data; qualitative interviews; and unstructured observations (Malhotra and Birks, 2006). Descriptive research is about measuring a variable or a set of variables that exist naturally and it is not concerned with relationships between variables but rather with
135
the description of individual variables (Gravetter and Orzano, 2010). This strategy is very useful at the early stages of research as it provides clear description of a phenomenon (i.e. the percentage of young adults consuming alchohol). In causal studies, the evidence of cause and effect relationships is investigated. According to Malhotra and Birks (2006), causal research is appropriate for the following purposes: (1) to understand which variables are the cause and which variables are the effect of marketing phenomena; (2) to determine the nature of the relationship between the causal variables and the effect to be predicted; (3) to test hypotheses. Similar to descriptive research, causal research also has a planned and structured nature. Descriptive and causal designs are more conclusive than exploratory in a way that a research study is characterised by the measurement of clearly defined marketing phenomena. In descriptive research, the purpose is to describe the characteristics of phenomena, usually market characteristics or functions. The difference between descriptive and exploratory research is that in descriptive research research questions and hypotheses are defined a priori; thus descriptive research is pre-planned and structured (Malhotra and Birks, 2006). The distinction between types of research design does not infer that only one type should be used; a research project can use a combination of designs. Sometimes a study can start with exploratory research when little is known about the problem and then it is followed by a descriptive or causal study. Then for this research, referring to the second objective in Table (2) – ‘To develop and validate a scale to measure consumer innovativeness in case of really new/radical innovation in the respective markets of infancy’ – an exploratory research study can be used to generate items which can capture the specified domain (Churchill, 1979), that is consumer
136
innovativeness. To search for items that can measure a concept, Churchill (1979) suggests using the techniques in exploratory research: ‘those techniques that are typically productive in exploratory research, including literature studies, experience surveys, and insight stimulating examples’ (p.67). This research begins with the scale development process using focus group and literature review and to assess the reliability and validity of the scale, the quantitative technique (Confirmatory Factor Analysis) will be used. The detailed process will be explained in the next section. The next step is to determine the appropriate methodology to achieve the rest of the objectives in Table (2). Hair et al. (2006, p.13) propose that researchers should judge the nature of their research by answering the following questions: (1) can the variables be divided into dependent and independent classifications based on some theory?; (2) if they can, how many variables are treated as dependent on a single analysis?; (3) how are the variables, both dependent and independent, measured? Referring to the proposed conceptual model in Figure (13), multiple relationships of dependent and independent variables exist in this study and the best method of analysis based on Hair et al. (2006) is structural equation modelling (SEM) which is defined as ‘a family of statistical models that seek to explain the relationships among multiple variables. In doing so, it examines the structure of interrelationships expressed in a series of equations […] These equations depict all of the relationships among constructs (the dependent and independent variables) involved in the analysis’ (p.711). SEM has many advantages over multiple regression and other techniques of analysis for relationship testing. Cheng (1982) explains that other techniques, such as multiple regression, factor analysis and path analysis are only able to examine a single relationship between dependent and independent variables but in human and
137
managerial science, one dependent variable may be an independent variable in another dependence relationship. In other words, these techniques are not able to take interaction effects among the posited variables into account. Multiple regression is restricted to examine a single relationship at a time but SEM can examine a series of dependence relationships simultaneously which helps to address complicated behavioural issues. Cheng (1982) further supports his argument testing a model of MBA knowledge and skill transfer using SEM and multiple regression. By comparing the results, it is shown that only one significant relationship can be justified by multiple regression but using SEM can help to identify new relationships in the model based on Modification Indices and three significant relationships are identified. The SEM also provides the best model fit. The constructs in the structural model are all unobservable or latent, so SEM cannot be applied to the constructs that can be measured directly or in other words are observable (i.e. age, height, weight). Not all variables in this study are latent (i.e. age education, gender), so some of the hypotheses will be tested using other methods than SEM. Table (14) provides the methodologies which will be used in correspondence with propositions: Table (14)- Research methodologies for propositions
Proposition number 1
2
3
Proposition Consumer innovativeness at domainspecific level (DSI) has a negative impact on innovation resistance. Consumer innovativeness at general level is positively related to consumer innovativeness at domain-specific innovativeness. Countries characterised by higher (lower) score on individualism will demonstrate significantly higher
138
Methodology SEM
SEM
One WayANOVA
4
5
6
7
8
9 10 11
12
13
14 15 16 17
18
(lower) innovativeness at general level. Countries characterised by higher (lower) score on individualism will demonstrate significantly higher (lower) innovativeness at domainspecific level. Countries characterised by higher (lower) score on individualism will demonstrate significantly lower (higher) innovation resistance. Countries characterised by higher (lower) score on uncertainty avoidance will demonstrate significantly lower (higher) innovativeness at general level. Countries characterised by higher (lower) score on uncertainty avoidance will demonstrate significantly lower (higher) innovativeness at domainspecific level. Countries characterised by higher (lower) score on uncertainty avoidance will demonstrate significantly higher (lower) innovation resistance. Traditionalism of consumers negatively affects innovativeness at general level. Fatalism of consumers negatively affects innovativeness at general level. Higher education levels demonstrate significantly higher general innovativeness. Higher education levels demonstrate significantly higher domain-specific innovativeness. Higher education levels demonstrate significantly lower level of innovation resistance. Age is negatively related to consumer innovativeness at general level. Age is negatively related to consumer innovativeness at domain-specific level. Age is positively related to innovation resistance. Perceived relative advantage of innovation is negatively related to innovation resistance. Perceived compatibility of innovation is negatively related to innovation resistance. 139
One WayANOVA
One WayANOVA
One WayANOVA
One WayANOVA
One WayANOVA
SEM SEM One-Way ANOVA One-Way ANOVA One-Way ANOVA SimpleRegression SimpleRegression SimpleRegression SEM
SEM
19
Perceived complexity of innovation is positively related to innovation resistance.
SEM
Besides age and education which are obvious observable variables, national culture can also be measured directly using the formula suggested by Hofstede; therefore these variables are not analysed by SEM. SEM is comprised of: (1) the structural model; and (2) the measurement model. The structural model is the path model relating independent to dependent variables and the measurement model enables the researcher to use several indicators for a single independent or dependent variable. For example, the relationship between domain-specific consumer innovativeness with innovation resistance is a path model and the item constituting the domain-specific innovativeness scale is the measurement model. The assessment of a contribution of each item in a scale is called confirmatory factor analysis and it is necessary before performing SEM (Hair et al., 2006). Measurement scales: The third step in research design is to select appropriate measurement scales. The measurement scales are crucial in every research study as one of the potential sources of error is from the measurement. Measurement error is the variation between the information sought and information generated by the measurement process (Malhotra and Birks, 2006). For example, if the purpose is to measure traditionalism of individuals, the measurement scale should not measure another subject (i.e. dogmatism). To measure national culture, individualism/ collectivism and, as mentioned before, Hofstede’s (2003) scale will be used. The scales and the procedure of calculating scores can be found on the official website of Geert Hofstede. The perceived characteristics of innovation (also known as attributes of innovation) will be measured using Rogers’ (2003) scales. Traditionalism will be
140
measured using five items from Tansuhaj et al. (1991); this is the best available scale taping the definition of traditionalism most closely. To measure fatalism, the reduced version of locus of control scale by Lumpkin (1985) will be used. To measure general innovativeness, two options exist: using Raju’s (1980) exploratory behaviour scale or using Baumgartner and Steenkamp’s (1999) scale. Both scales were explained in section 2.5.2. According to Roerich (2004), who reviewed the performance of consumer innovativeness scales, both have average predictive validity and none has major superiority over the other. The author prefers to use Raju’s (1980) 10-item scale than Baumgartner and Steenkamp’s (1999) 20-item scale. Raju’s scale measures consumers’ propensity to enquire and try newness in general. Innovation resistance will be measured using the scale proposed by Ram (1989). To measure innovation resistance, a brief explanation of innovation is given and then respondents answers to the questions measuring their perceived risk and reluctance to change behaviour. The example in Ram’s (1989) article is aspirin; it is explained to respondents that aspirin is packed in non-sticky chocolate packages. As and when required, an aspirin square can be broken off and consumed. Nine items are used to measure resistance to use the new aspirin in Ram’s article but three items do not show face validity in the solar panels example. These items are: (1) using this product may affect me psychologically; (2) I do not believe that such a product can be manufactured; and (3) I would not know my friends to know that I use this product. The researcher draws this conclusion using his own judgment and the judgments of 10 PhD students plus one academic in management and marketing when designing the questionnaire. Therefore these items are removed and only six items will be used in this research. Finally domain-specific innovativeness is a self-report one and the
141
process of development and validation will be explained in Chapter 5. Except for demographic variables, all other scales have Likert format. Likert scale is widely used in marketing and requires the respondents to indicate a degree of agreement or disagreement with each of the series of statements. All Likert scales in this research are 7 points, except the scales measuring national culture (by Hofstede) which are five points; but this does not create any problem. Using 7-point Likert scale is preferred over 6-point because respondents should be given a neutral option when answering a question. Based on the research by Inforsurv in 2006, more than 70% of market researchers prefer to use 5- or 7-point Likert scale over 6-point. Based on that study, if respondents are not given a neutral option, they would accentuate the negative option in most cases resulting in bias of responses. It should also be noted that using either 5or 7-point scales does not change the characteristics of data significantly (Dawes, 2008). Hofstede’s national culture is not allowed to be used for establishing a correlation or regression relationship with other variables; it is only meant for crosscountry comparisons (official website of Geert Hofstede). Table (15) summarises the sources of measurement scales: Table (15)- Measurement scales in the study
Measurement Traditionalism Fatalism National Culture Attributes of Innovation General Innovativeness Innovation Resistance Domain-specific Innovativeness
Source(s) Tansuhaj et al. (1991) Lumpkin (1985) Hofstede (2003) Rogers (2003) Raju (1980) Ram (1989) Self-report scale
Construct an appropriate form of data collection or questionnaire: The fourth step in research design is to develop a sound questionnaire to collect required information for research. There is no scientific method in designing an optimal
142
questionnaire but rather it is more based on experience and an understanding of respondents. Figure (15) presents the proposed process in designing a questionnaire by Malhotra and Birks (2006). Figure (15)- Questionnaire design process (Malhotra and Birks, 2006)
After specifying the information needed, it should be determined how the questionnaire is administered. Personal interview is the method of distributing the questionnaire. The advantage of using the method is a close interaction with respondents, so if the respondents have any problem in answering the questions, the issue can be easily resolved. The content of individual questions is all relevant to the research objectives and contributes to the information needed. It should be ensured that respondents can provide accurate or reasonable answers to all questions and overcome respondents’ inability to answer. This can be done in a variety of ways, for
143
example by providing a clear introduction explaining the purposes of the research and giving a guarantee that all information will be treated confidentially. Some questions can be sensitive to respondents making them unwilling to provide information, such as political and religious beliefs, personal hygiene or personal income. Due to sensitivity about questions regarding the income of individuals in the Middle East, this question, although useful, is not included in the questionnaire. Regarding the structure of the questionnaire, it begins with the questions measuring cultural variables and then respondents answer questions about their willingness to try newness in general (general innovativeness). In the following, brief explanations about solar panels with their advantages and disadvantages are presented and then respondents are required to answer questions measuring their domain-specific innovativeness, innovation resistance and perceived attributes of innovation. The question wording is the most critical task in developing a questionnaire (Malhotra and Birks, 2006) because if a question is worded poorly, it may cause ambiguity and respondents refuse to answer. For the questions measuring attitude, it is evidenced that the obtained responses are influenced by the directionality of the statements: whether they are stated positively or negatively (Malhotra and Birks, 2006). Careful consideration was made to avoid using ambiguous wording; also both positive and negative directions were used in wording the questions. As the questionnaire was used in three countries, translation was needed. The official language of Iran is Persian and in Saudi Arabia and Jordan it is Arabic. Direct translation was used for the Persian questionnaire as the native language of the author is Persian. For the questionnaire in Arabic countries, back translation is used. Back translation is a method in which ‘the questionnaire is translated from the base language by a bilingual speaker whose native
144
language is the language into which the questionnaire is being translated. This version is then translated back into the original language whose native language is the initial or base language’ (Malhotra and Birks, 2006, p.679). The final stage was to have the questionnaire for pilot testing to identify and resolve potential problems. The respondents in pilot testing were similar to those who were included in the actual survey. The English translation of the final questionnaire is included in Appendix 1. Specify the sampling technique and sample size: In step 5, the sampling technique is determined. Sampling is a key part of any research design. The sampling design process consists of six steps: (1) define the target population; (2) determine the sampling frame; (3) select sampling technique; (4) determine the sample size; (5) execute the sampling process; and (6) validate the sample (Malhotra and Birks, 2006; Shiu et al.,2009). In the first step, the target population is about the collection of elements or objects that possess the information sought by the researcher and about which inferences are to be made. Defining the target population means who should and should not be included in the sample. This research involves innovativeness and resistance of consumers and their antecedents towards an example of a really new innovation, that is, solar panels. Solar panels are an expensive product for residential purposes, so in order to acquire information of individuals’ resistance or innovativeness it is wise to target those who are key decision makers in a household. Therefore the target population are ‘household decision makers’. The sampling frame consists of directions for identifying the target population. Examples are consumer databases, telephone directories, mailing lists and any other sources containing the information. For this research, a list or database could not be compiled but this is not a problem as at least some directions for identifying the target population can be used
145
(Malhotra and Birks, 2006). The best criterion to identify a household decision maker, based on the judgment of the researcher, is marital status. The researcher judges that either the husband or wife, through a collective decision making process, normally makes the final purchase decision. In addition, the respondents should own the house and not the tenant so it will be ensured that they have full authority to choose the solar panels for the house. If a respondent is married and owns the house, then the data will be collected from the right target population because that person is either the wife or husband who can decide about purchasing solar panels. A screening question is put in the questionnaire asking for the marital status of respondents; if a respondent is single then he/she is removed from the target population. Also when distributing the questionnaire, potential respondents will be asked whether they own the house. The most important decision about the choice of sampling technique is whether to use non-probability or probability sampling. In non-probability sampling the selection of samples is dependent on the personal judgment of the researcher. The researcher can arbitrarily choose what elements to include in the sample. The advantageous aspect of a non-probability sample is that it may yield good estimates of the population characteristics, but this technique does not allow for an objective evaluation of the precision of the sample results (Malhotra and Birks, 2006). Types of non-probability sampling techniques are convenience sampling, judgmental sampling, quota sampling and snowball sampling. Unlike non-probability sampling, in probability sampling, sampling units are selected by chance and each element of the population has a fixed probabilistic change of being selected for the sample. Common techniques of probability sampling include simple random sampling, systematic sampling, stratified sampling and cluster sampling.
146
The sampling approach in this study begins with distributing the questionnaire using individuals who are known to the researcher in each country. Three individuals in Saudi Arabia, two individuals in Jordan and five individuals in Iran are recruited to distribute the questionnaire to the households. Then each of the questionnaire distributors gives the questionnaire to ten individuals they know who possess the required target population (i.e. living in their own house). Up to this stage the sampling approach can be categorised as snowball sampling which is a nonprobability technique. However, for randomness in the sampling approach, those ten individuals are asked to distribute the questionnaire randomly in their residential area by visiting the households in the residential areas. Each of them are required to collect five to ten samples so that a large sample size is achieved. To make this process clearer, considering Saudi Arabia as an example: (1) The researcher recruits three individuals to distribute the questionnaire. (2) Each distributor gives the questionnaire to ten people who he/she knows. This process in not random (3 * 10=30 sample) (3) Each of these 30 individuals randomly distribute the questionnaire to 10 households. If they are successful, the total number of collected data would be 300 (30*10=300). The above mentioned sampling approach should satisfy the requirements to analyse the conceptual framework in this study using SEM. According to Kaplan (2000), to conduct structural equation modelling, certain underlying assumptions should be satisfied to ensure accurate inferences. These assumptions are (1) multivariate normality, (2) no systematic missing data, (3) sufficiently large sample size, and (4)
147
correct model specification. In terms of sampling approach, using simple random sampling is recommended but not compulsory: ‘… estimation methods such as maximum likelihood assume that data are generated according to simple random sampling. Perhaps more often than not, however, structural equation models are applied to data that have been obtained through some method other than simple random sampling’ (Kaplan,2000, p.79)
The next step in the sampling technique is the determination of sample size. To determine sample size a combination of qualitative and quantitative aspects should be considered. From a qualitative perspective, important factors in determining the sample size could be the nature of research, sample size used in other studies and the nature of analysis (Malhotra and Birks, 2006). In exploratory studies (i.e. studies involving qualitative techniques), the sample size is typically small. For conclusive studies, such as this, a larger sample size is required. Moreover, if many questions are asked, a larger sample size is needed. From a statistical point of view, in determining sample size, the issues of statistical error and statistical power should be considered. Sampling error is common in every research study but researchers should specify the acceptable levels of statistical error (Hair et al., 2006). There are two types of errors: Type I error (also known as alpha-α) and type II error (also known as beta-β). Type I error is the probability of rejecting the null hypothesis when actually true and type II error is the probability of failing to reject null hypothesis when it is actually false. The statistical power is 1-β which is the probability of correctly rejecting the null hypothesis when it should be rejected. Type I and Type II errors are inversely related, so reducing alpha error reduces the statistical power. The researcher should find a
148
balance between the level of alpha and statistical power (Hair et al., 2006). Achieving high statistical power depends on three factors: effect size, alpha (α) and sample size. Effect size is the estimate of the degree to which the phenomenon being studies exists in the population (Hair et al., 2006). Large sample sizes produce greater statistics power but sometimes huge sample size can make very small effects statistically significant. The relationship between sample size, effect size and alpha level is rather complicated. Cohen (1988) suggests that studies should achieve alpha level of at least 0.05 and power level of 80%. There are published studies on the appropriate sample size with regard to specific effect size, alpha and power statistics. For example, for an alpha level of 0.01, power of 80% and effect size of 0.35 (which is considered to fall between small to moderate) the required sample size is 200 minimum (Hair et al., 2006). Since the main methodology in this research is SEM, there are also some guidelines about the appropriate sample size when using this technique. The sample size should be large enough to enable the software estimate parameters in the model, but what is the minimum sample size in SEM? The answer to this question is not straightforward. Some studies suggest that 100 to 150 subjects is the minimum sample size for structural equation modelling (Anderson and Gerbin, 1988); Boomsma (1982, 1983) recommended 400 and Hu et al. (1992) indicated that even in some cases 5000 is insufficient. (in Schumacker and Lomax, 2010). Based on the recommendations by Schumacker and Lomax (2010), most studies used a sample size of 200 to 500; another suggestion is to use a minimum 5 subjects per observed variable to make it suitable for factor analysis. To sum up the final decision for sample size in this study, the intention is to collect a minimum 250 individuals per country.
149
The last step in sampling technique is the validation of the sample. The purpose of sample validation is to screen the respondents during the data collection process. Respondents can be screened with respect to demographic characteristics, familiarity with the product and other characteristics. In this research, as mentioned before, the marital status of respondents is important as this is the criterion to identify individuals who are the decision makers in households. Validating the sample could enable elimination of inappropriate elements contained in the sampling frame. Develop a plan for data collection: The final step was to develop an action plan for data collection. After taking all five abovementioned stages in designing the research, data were collected within three months from Iran, Saudi Arabia and Jordan in late 2010. All data were available for analysis at the beginning of 2011.
150
CHAPTER 5- DATA ANALYSIS: ASSESSING THE CONSTRUCT VALIDITY OF THE MEASUREMENT MODELS
151
5.1-Introduction This chapter and the following chapter are focused on data analysis results. After developing the conceptual model of innovation resistance and explaining the research design, it is required to examine whether the scales to be used in the model meet the conditions of construct validity. Construct validity is defined as ‘the extent to which a set of measured items actually reflect the theoretical latent construct those items are designed to measure. Thus it deals with the accuracy of measurement’ (Hair et al., 2006; p.776). In other words, do the scales (or measurement models) measure the theorised construct that they purport to measure? Is it required to refine measurement models to achieve higher reliability and validity? To achieve the set objective, this chapter is divided into five major sections: First, the results of exploratory factor analysis (EFA) of all measurement models are reported. The first step to test the construct validity of measurement models is to uncover the structure of the measurement models. By using EFA, it is possible to: (1) identify the number of factors the measurement models possess; the term factor refers to the underlying dimensions that summarise or account for the original set of observed variables (Hair et al., 2006); and (2) summarise or reduce data. Those observed variables which are not contributing to the factors of measurement models very well can be refined in the EFA process. In the second section, the measurement models are further tested using confirmatory factor analysis (CFA) which is a special form of EFA. In CFA, the concern is to test whether the items in the measurement models are consistent with a researcher’s understanding of the nature of that construct. For example, are the items truly
152
measuring traditionalism? Or are they contributing to other measurement models. If the items are not representing what is intended, they can be considered for removal. In the third section, as discussed in Chapter 2 (section 2.7.2 and 2.7.3), a new measurement scale is required to be developed to measure consumer innovativeness for radical/really new innovations in respective markets of infancy. This scale is meant to tap the domain-specific level. The process of development, validation and cross-validation of the new scale is explained in this chapter and it will be shown that the new scale meets the criteria of construct validity. The fourth section involves the issue of measurement invariance. As this research is concerned with cross-national comparisons, it should be ensured that respondents in different countries interpret and perceive the items in a similar way. In other words, are the measurement models invariant across countries? Achieving full measurement invariance is not possible in practice but partial invariance is expected for meaningful cross-national research. This will be discussed further in section 5.5. Finally, using EFA and CFA analysis enables a researcher to purify the items which are not contributing the constructs very well. Using bad scales means that the conceptual model is tested with bad measures; therefore the results of the study will not be credible. After completing item purifications, the measurement models will be ready to be used in structural equation modelling and the final items will be presented in a table.
5.2- Exploratory Factor Analysis (EFA) Based on the definition by Hair et al. (2006) factor analysis provides the tools for analysing the structure of the inter-relationships (correlations) among a large number of variables (e.g. test scores, test items, questionnaire responses) by defining sets of 153
variables that are highly interrelated, known as factors’ (p.104). The purpose of exploratory factor analysis was to: (1) understand the structure of measurement models; and (2) refine and remove items if appropriate. Factor analysis is most often performed on metric variables and since Hofstede’s items of national culture should not be treated as metric (based on his recommendations on his official website), doing factor analysis on these items is not sensible. The factor analysis was used for the following measurement scales in all countries: Fatalism, Traditionalism, General Innovativeness, Domain-specific Innovativeness (the new scale), Innovation Resistance, Relative Advantage, Compatibility and Complexity. The method of factor extraction for all variables was principle component analysis (PCA) and, based on recommendations by Field (2009), only factors with eigenvalues more than 1 were kept. The term ‘eigenvalue’ refers to the amount of variance accounted for by a factor (Hair et al., 2006). Varimax rotation method was used in extracting factors which is defined as ‘maximising the dispersion of loading with factors and loads a smaller number of variables highly onto each factor resulting in more interpretable clusters of factors’ (Field, 2009; p.644). Once the structure of factors is identified, factor loadings are also calculated which is the correlation of each variable and the factor; in other words with factor loading, it is possible to assess which variables make up which factor (Field, 2009). The item with low factor loading, if it does not represent high loading with another factor in the case of multiple factor solution, is a candidate for removal because that item does not significantly contribute to the measurement scale (Field, 2009 and Hair et al., 2006). Based on the recommendations by Field (2009), for a sample size of 50, a loading of
154
0.722 can be considered significant and when sample size increases the lower loadings can be considered significant. For a sample size of 200 the loading should be greater than 0.36 and for 300 it should be greater than 0.29. The results of factor analysis in all countries are presented as follows: Fatalism scale: The fatalism scale consists of eight items. The Kaiser-Meyer-Olkin measure verified the sampling adequacy for principle component analysis in all countries, KMOIran=0.63, KMOSaudi Arabia=0.60 and KMOJordan=0.58 which was higher than 0.50 (Field, 2009). Barlett’s test of sphericity χ2iran (28)= 680.30, p