Sensors 2015, 15, 10705-10722; doi:10.3390/s150510705 OPEN ACCESS
sensors ISSN 1424-8220 www.mdpi.com/journal/sensors Article
Development of an Ultrasonic Airflow Measurement Device for Ducted Air Andrew B. Raine, Nauman Aslam *, Christopher P. Underwood and Sean Danaher Faculty of Engineering and Environment, Northumbria University, Newcastle upon Tyne NE18ST, UK; E-Mails:
[email protected] (A.B.R.);
[email protected] (C.P.U.);
[email protected] (S.D.) * Author to whom correspondence should be addressed; E-Mail:
[email protected]; Tel.: +44-191-243-7737; Fax: +44-191-243-7630. Academic Editor: Vittorio M.N. Passaro Received: 3 December 2014 / Accepted: 3 April 2015 / Published: 6 May 2015
Abstract: In this study, an in-duct ultrasonic airflow measurement device has been designed, developed and tested. The airflow measurement results for a small range of airflow velocities and temperatures show that the accuracy was better than 3.5% root mean square (RMS) when it was tested within a round or square duct compared to the in-line Venturi tube airflow meter used for reference. This proof of concept device has provided evidence that with further development it could be a low-cost alternative to pressure differential devices such as the orifice plate airflow meter for monitoring energy efficiency performance and reliability of ventilation systems. The design uses a number of techniques and design choices to provide solutions to lower the implementation cost of the device compared to traditional airflow meters. The design choices that were found to work well are the single sided transducer arrangement for a “V” shaped reflective path and the use of square wave transmitter pulses ending with the necessary 180° phase changed pulse train to suppress transducer ringing. The device is also designed so that it does not have to rely on high-speed analogue to digital converters (ADC) and intensive digital signal processing, so could be implemented using voltage comparators and low-cost microcontrollers. Keywords: acoustics; airflow rate; ultrasonic flowmeter; ventilation air flow measurement; differential transit time method; time difference method; ultrasonic transducer damping; ultrasonic receiver amplifier
Sensors 2015, 15
10706
1. Introduction Currently heating, ventilation and air conditioning (HVAC) systems are difficult and costly to monitor for energy efficiency performance and reliability. A typical duct airflow monitoring device uses a pressure differential method to determine the airflow. According to Yu et al. [1] they are fragile, expensive and create an additional pressure loss, and their sensitivity is also reduced with the reduction in airflow velocity. As buildings evolve, they will require higher levels of insulation and air tightness which will require ventilation systems to provide the minimum number of air changes and reduced energy usage by recovering heat from the air before it is expelled. This will necessitate the need for monitoring of the operating performance of these systems so that air quality or building energy efficiency is not detrimentally affected [2,3]. The monitoring of airflow rates can indicate problems in the design, installation and operation of a HVAC system [2–4]. One of the possible alternatives, listed on pages 36.15 and 36.21 of [5], to using pressure differential type devices such as Pitot tube/arrays, orifice plates and Venturis is to use an ultrasonic flow rate sensor which, according to Lynnworth and Liu [6], have been around for at least 60 years [7]. Ultrasonic flow sensors are commonly used to measure pipeline liquid flow in industrial applications but they are not as common for gas flow. There are commercially available systems for use in monitoring industrial processes such as exhaust gases [8] and automotive test bed air intakes [9] but the historically high cost [10,11] has restricted their application uses in HVAC systems. A duct airflow measurement device was proposed by Bragg and Lynnworth [12] from Panametrics Inc. (Waltham, MA, USA) at a conference in 1994 which used a single port solution consisting of two transducers mounted using O-rings to reduce crosstalk on a single circular flange. A reflective path was used and it was suggested that optional sensors could be combined with this unit such as pressure, temperature and relative humidity. In 2002 a similar but more developed device was described by Rabalais and Sims [13] but was only available on a case-by-case basis as they were still classed as experimental devices. In 1994 a patent was filed by Strauss et al. [14], which described a solution for measuring HVAC air velocity by using a contra-propagating pulsed phase method. The measurement of low airflow velocities in natural ventilation systems has created an interest in developing an ultrasonic airflow velocity measurement device. This is because of the linear response to flow velocity change that these devices have, so their sensitivity does not degrade with low airflow velocity as opposed to what happens with pressure differential airflow measurement devices. In a study by Olmos [10] an ultrasonic airflow measurement device for measuring airflow and temperature within solar chimneys was developed. This incorporated a contra-propagating pulse phase method with time of flight tracking similar to a method used by the same author in a previous study for an ultrasonic tank level meter [15]. In another study by van Buggenhout et al. [11] on natural ventilation air flow measurement, a device was created which could use between 1 and 16 transducer pairs fitted in a circular duct to measure the turbulent airflow to an accuracy of 9% for all 16 pairs and 24% for a single pair. The objectives of this study were to develop a proof of concept for a practical airflow measurement device for 0 to 10 m/s low velocity ducted air with an accuracy similar to typical existing air velocity measurement devices [5] (p. 36.15), of between 2% and 5%, and with the potential to be developed at lower cost than the currently available ultrasonic in-duct airflow measurement or pressure differential devices. The fully developed device would be expected to operate with in-duct airflow temperatures
Sensors 2015, 15
10707
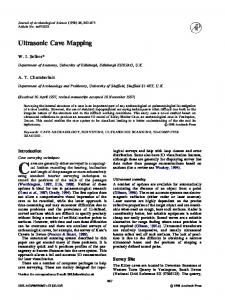
from −30 °C to 60 °C together with duct sizes of height ranging from 100 mm to 1000 mm over the full humidity range. To aid this process, an ultrasonic airflow measurement development system was designed and constructed which involved a significant amount of hardware and software integration. The research and development work involved testing of various methods and techniques to discover a system which would be less costly to implement with an acceptable quality of measurement. 2. Theory The transit time acoustic flow meter, as shown in Figure 1, works on the principle that sound waves will propagate faster in the direction of the flow than against it [16,17]. The following section now explains how to predict transit times and calculate the flow velocity. Two different methods of calculating the flow velocity are described. The first method uses the absolute transit times and the other uses the direct measurement of the transit time difference plus airflow temperature.
Figure 1. Single path acoustic transit time flow meter in a circular duct. The approximate velocity of the speed of sound c, in still dry air of temperature t in degrees Celsius is given by the following Equation (1) [18]: ≈ 331.45 1 +
273
m/s
(1)
The single path acoustic transit time flow meter geometric parameter values are given by the following Equations (2) and (3): =
+
(2)
θ = tan
(3)
Hence the transit time can be predicted by Equations (1)–(3) and the following Equation (4): ±
cos θ
(4)
The mean airflow velocity UTTM across the acoustic path can be calculated using Equation (5) [19] without the need to know the speed of sound: =
1 2 cos θ
−
1
(5)
Sensors 2015, 15
10708
To reduce errors caused by noise and fluctuating signal levels, the absolute transit time is usually measured by using the cross-correlation [20] digital signal processing (DSP) method [21]. This compares the digital representation of the transmitted and received waveforms to calculate the delay between them to reduce errors caused by noise and fluctuating signal levels. Threshold crossing techniques can be used as well [22]. In this study, a phase shift or differential transit time method similar to that described by Han et al. [19] and de Cicco et al. [23] is used to reduce the cost of implementation for this application. In the differential transit time method, the estimated transit time is found by using a two stage calculation. In the first stage, the zero flow transit time is calculated with Equation (6). In this equation the acoustic path length in Equation (2) is divided by the speed of sound in Equation (1), which is derived from the airflow temperature: =
(6)
In the second stage, half the actual measured differential transit time is added or subtracted from the zero flow transit time depending on the airflow direction, which is represented in Equation (7) below: =
±
Δ 2
(7)
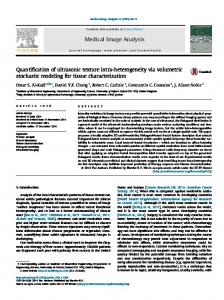
The airflow velocity can then be calculated by using the inverse transit time difference (ITTD) [24] formula presented in Equation (5). 3. Design 3.1. HVAC Ultrasonic Duct Airflow Measurement Development System To develop the ultrasonic duct airflow measurement device a system was produced which had the flexibility to test various measurement techniques. An overview of the development system is shown in Figure 2 which is divided into four subsystems. These subsystems are individually discussed in the next four Sections 3.2–3.5, together with the final configuration method used for testing. The rest of this section contains a general overview of the system operation and equipment used.
Figure 2. Schematic of the ultrasonic duct airflow measuring device development system.
Sensors 2015, 15
10709
A computer controlled arbitrary waveform generator (AWG) was used so that any type of transmit drive signal could be produced and manipulated quickly by the extensively modified LabVIEW® 10 (National Instruments, Austin, TX, USA) instrument driver software. The output of the AWG was fed into a PA95 (Apex Microtechnology, Tucson, AZ, USA) high voltage power amplifier capable of driving the ultrasonic transducer to its maximum voltage of approximately 100 V peak to peak. This was then switched through two LH1500AT (Vishay Intertechnology, Malvern, PA, USA) solid-state relays (SSR) within the high voltage multiplexer specifically designed for the task which could switch a single input between at least two outputs. The multiplexer was also controlled by the computer through a PicoLog® 1012 (Pico Technology, St Neots, UK) universal serial bus (USB) data acquisition device. The transmit signals were then connected, depending on the multiplexer state, to one of two 400EP14D (Pro-Wave Electronic Corp., New Taipei City, Taiwan) 40 kHz enclosed type piezoelectric transducers which would transmit an ultrasonic signal through the duct to a receiving transducer. The received signal would be then amplified after passing through a diode voltage limiter input circuit to a multistage operational amplifier to boost the signal voltage gain to >1000. This was then digitized by a USB oscilloscope to be processed by the computer running the LabVIEW® control and signal processing software. A Grant type U thermistor probe was used to measure the in-duct air temperature and was monitored via a Squirrel® SQ2020 Series Data Logger (Grant Instruments, Shepreth, UK). 3.2. Transducer Configuration A single reflective path ultrasonic flow meter design was chosen as the preferred solution. The transducers are mounted on the same side so that they can be constructed as a single assembly which is fitted to the duct wall. This should reduce the overall cost as it simplifies installation and reduces the number of cable assemblies required. The single reflective “V” shaped path geometric parameter values are given by the following Equations (8) and (9): =
2
θ = tan
+ 2
(8) (9)
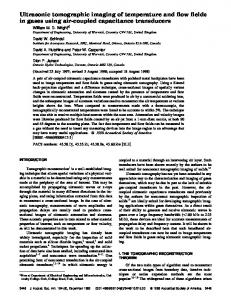
Figure 3 shows a similar device to Figure 1 but using a reflective “V” shaped path with the transducers mounted perpendicular to the duct wall. To explore the sensitivity of airflow measurements on duct size and instrument spacing, in the following table the effects on airflow velocity measurement of an unintentional deviation of up to ±10 mm for the transducers’ axial separation distance, Z, and the duct diameter, D, or duct height, H, are shown. The flow meter scenario used for results in Table 1 is a duct with a diameter or height of 100 mm and a transducer axial separation of 200 mm with a mean airflow of 10 m/s.
Sensors 2015, 15
10710
Figure 3. A reflective “V” shape single path acoustic differential transit time flow meter in a cylindrical duct. Table 1. Deviation of Z, D or H on airflow velocity measurement.
Z D, H
Deviation in (mm) Airflow results (m/s) Deviation from 10 m/s as (%) Airflow results (m/s) Deviation from 10 m/s as (%)
−10 11.050 10.497 9.987 −0.131
−5 10.512 5.125 9.997 −0.032
0 10.000 0.000 10.000 0.000
5 9.512 −4.875 9.997 −0.030
10 9.050 −9.502 9.988 −0.119
The transducer pair axial separation width, Z, is fixed at manufacture. This is because as a large error could result from the alteration of this separation distance, as shown in Table 1, where a 5% deviation in separation can cause >10% error in flow measurement. A deviation in diameter or height of the duct of 5% only causes a very small error of