Aquafin CRC Project 4.1 - Final Report
Final Report
DEVELOPMENT OF NOVEL METHODS FOR THE ASSESSMENT OF SEDIMENT CONDITION AND DETERMINATION OF MANAGEMENT PROTOCOLS FOR SUSTAINABLE FINFISH CAGE AQUACULTURE OPERATIONS Catriona Macleod, Andrew Bissett, Chris Burke, Susan Forbes, Danny Holdsworth, Peter Nichols, Andrew Revill and John Volkman
August 2004 Aquafin CRC Project 4.1 (FRDC Project No. 2000/164)
i
Aquafin CRC Project 4.1 - Final Report
National Library of Australia Cataloguing-in-Publication Entry
Macleod, Catriona Kirsteen Anne Marie, 1964Development of novel methods for the assessment of sediment condition and determination of management protocols for sustainable Finfish cage aquaculture operations. Bibliography. Includes index. ISBN 1 86295 205 1. 1. Restoration ecology - Tasmania. 2. Sediment control Tasmania. 3. Fish-culture - Environmental aspects Tasmania. 4. Cage aquaculture - Tasmania. I. Macleod, Catriona (Catriona K.). II. Tasmanian Aquaculture and Fisheries Institute. (Series : FRDC project ; 2000/164). 333.91715309946
© Tasmanian Aquaculture and Fisheries Institute 2004. This work is copyright. Except as permitted under the Copyright Act 1968 (Cth), no part of this publication may be reproduced by any process, electronic or otherwise, without the specific written permission of the copyright owners. Neither may information be stored electronically in any form whatsoever without such permission. Every attempt has been made to provide accurate information in this document. However, no liability attaches to Aquafin CRC, its Participant organisations or any other organisation or individual concerned with the supply of information or preparation of this document for any consequences of using the information contained in the document. Published by Tasmanian Aquaculture and Fisheries Institute.
i
Aquafin CRC Project 4.1 – Final Report
DEVELOPMENT OF NOVEL METHODS FOR THE ASSESSMENT OF SEDIMENT CONDITION AND DETERMINATION OF MANAGEMENT PROTOCOLS FOR SUSTAINABLE FINFISH CAGE AQUACULTURE OPERATIONS Catriona Macleod, Andrew Bissett, Chris Burke, Susan Forbes, Danny Holdsworth, Peter Nichols, Andrew Revill and John Volkman August 2004
Aquafin CRC Project 4.1 (FRDC Project No. 2000/164)
ii
Aquafin CRC Project 4.1 – Final Report
Table of Contents 1.
NON TECHNICAL SUMMARY
1
2.
ACKNOWLEDGEMENTS:
5
3.
INTRODUCTION
6
3.1 Background to study
6
3.2 Previous research on sediment recovery
6
3.3 Need for Research
7
3.3.1
Environmental Significance
7
3.3.2
Economic importance
8
3.4 Aims & Scope of the study
9
3.5 Study Context & Design
9
3.5.1
Selection of Study Sites
3.5.1.1 Site locations 3.5.1.2 Natural environmental conditions at the study sites 3.5.1.3 Site history
3.5.2
Basic Sampling DesignSpatial Analysis
3.5.2.1 Temporal Analysis
4.
9 9 10 10
12 13
METHODS
15
4.1 Positioning equipment
15
4.2 Water column sampling
15
4.3 Faunal sampling
15
4.4 Redox & Sulphide Assessment
15
4.5 Granulometry and Organic Matter Determination
16
4.6 Assessment of Sedimentation Rate
16
4.7 Stable Isotope Evaluation
17
4.7.1
Sample Collection
17
4.7.2
Sediment Extraction
17 iii
Aquafin CRC Project 4.1 – Final Report
4.7.3
Fauna Extraction (Stringers only)
17
4.7.4
Stable isotopes and % organic carbon and nitrogen
17
4.8 Biomarkers
18
4.8.1
Sample Collection.
18
4.8.2
Fatty acid and Sterol analysis.
18
4.8.3
Gas chromatography (GC)
18
4.8.4
Mass spectrometry (MS).
19
4.9 Visual assessment techniques
19
4.10 Metals Analyses
20
4.11 Microbiological and Porewater Nutrient sampling
20
4.11.1 Porewater Nutrients
21
4.11.2 Bacterial enumeration
21
4.11.3 Cell staining and microscope slide preparation
21
4.11.4 Microbial Counts - Image Analysis
21
4.11.5 Microelectrode measurements
22
4.11.6 Bacteriological monitoring of sedimentary organic carbon.
22
4.12 Phospholipid Fatty Acid (PFLA) and Ether Lipid (EL) Profiling 23 4.12.1 Microbial biomass estimates
26
4.12.2 Fatty acid nomenclature
26
4.13 Statistical analysis
5.
26
4.13.1 Univariate analysis of variance
26
4.13.2 Multivariate analysis of ecological structure
27
RESULTS & DISCUSSION - CREESES MISTAKE
28
5.1 General Site Information
28
5.2 Farm production information
30
5.3 Benthic ecology
31
5.3.1
Characterisation of community change
31
5.3.2
Classification of impact/ recovery stages (spatial & temporal)
34
5.3.3
Temporal variability in rate of recovery
35
5.3.4
Ecological significance of community changes
35
5.3.5
Simplified community features
38
5.3.6
Potential indicators and predictive capacity
44 iv
Aquafin CRC Project 4.1 – Final Report
5.3.7
Visual assessment approaches
5.3.7.1 Benthic Community Visual Characterisation (benthic photos) 5.3.7.2 Video Assessment
5.3.8
Summary
5.4 Sediment Biogeochemistry 5.4.1
Granulometry & Organic Matter Determination
5.4.1.1 Granulometry 5.4.1.2 Organic Matter Content
5.4.2
Redox potential & sulphide concentration
5.4.2.1 Redox Results 5.4.2.2 Sulphide Results 5.4.2.3 Sulphide – Redox Relationship
5.4.3
Porewater Nutrients
5.4.3.1 Depth of Oxic Zone 5.4.3.2 Ammonia Measurements 5.4.3.3 Summary of oxic zone and porewater ammonia.
47 47 48
52
57 57 57 58
59 59 60 61
62 62 66 67
5.4.4
Carbon and nitrogen contents in sediments from Creeses.
68
5.4.5
Stable Isotopes
71
5.4.6
Sediment lipid biomarkers
71
5.4.6.1 Use of biomarkers to assess sources of organic matter 5.4.6.2 Previous applications to fish farming
71 71
5.4.7 Non-saponifiable lipids from reference sites, in-between cage sites and under cages 72 5.4.7.1 Temporal changes in specific biomarkers 5.4.7.1.1 Phytol Abundances 5.4.7.1.2 Fatty acids in sediments 5.4.7.1.3 Bacterial fatty acids 5.4.7.1.4 Cholesterol in sediments 5.4.7.1.5 Desmosterol 5.4.7.1.6 Vitamin E (α-tocopherol). 5.4.7.1.7 Sitosterol (24-ethylcholesterol) 5.4.7.1.8 Comparison of sediments directly under and adjacent to cages.
78 78 78 79 79 79 80 80 81
5.4.8
Sedimentation
81
5.4.9
Sediment Metals
82
5.4.10 Summary
5.5 Microbial ecology 5.5.1 5.5.1.1 5.5.1.2 5.5.1.3 5.5.1.4 5.5.1.5 5.5.1.6
Community ecology Bacterial Counts Over Production Cycle One Bacterial Counts Over Production Cycle Two Accumulation Effects of Organic Load on Bacterial Numbers Bacterial Biomass Beggiatoa Counts Summary of Bacterial Community Ecology
85
87 87 87 89 90 91 92 92
5.5.2
Bacteriological Indicators
93
5.5.3
Summary
94
v
Aquafin CRC Project 4.1 – Final Report
6.
RESULTS & DISCUSSION - STRINGERS COVE
95
6.1 General Site Information
95
6.2 Farm production information
96
6.3 Benthic ecology
99
6.3.1
Characterisation of Community Change
6.3.2
Classification of Impact / Recovery Stages
101
6.3.3
Temporal Variability in Rate of Recovery
104
6.3.4
Ecological significance of community changes
106
6.3.5
Simplified Evaluation Options
112
6.3.6
Potential Indicators & Predictive Capacity
120
6.3.7
Visual Assessment Approaches
120
6.3.7.1 6.3.7.2 6.3.7.3 6.3.7.4
6.3.8
Benthic Community Visual Characterisation (Benthic Photos) Video Assessment Multivariate Analysis Comparison with benthic community structure analysis
Discussion
6.4 Sediment Biogeochemistry 6.4.1
Granulometry and Organic Matter Determination
6.4.1.1 Granulometry 6.4.1.2 Organic Matter Content
6.4.2
Redox Potential & Sulphide Concentration
6.4.2.1 Redox Potential 6.4.2.1.1 Depth of Redox Measurement 6.4.2.2 Sulphide Concentration 6.4.2.3 Redox – Sulphide Relationship
6.4.3 6.4.3.1 6.4.3.2 6.4.3.3 6.4.3.4
Porewater Nutrients Depth of the Oxic Zone Ammonia Measurements Denitrification Summary of pore water nutrient results
99
120 122 124 126
126
132 132 132 133
134 134 136 136 138
139 139 141 144 145
6.4.4
Carbon and nitrogen contents in sediments.
145
6.4.5
Sedimentary lipid biomarkers
148
6.4.5.1 Non-saponifiable lipids from reference sites, in-between cage sites and under cages148 6.4.5.2 Fatty acids in sediments at reference, in-between cages and under cages. 151 6.4.5.3 Temporal changes in specific biomarkers 153 6.4.5.3.1 Phytol Abundances 153 6.4.5.3.2 PUFA 156 6.4.5.3.3 Cholesterol 158 6.4.5.3.4 Vitamin E 160 6.4.5.3.5 Desmosterol 163 6.4.5.3.6 Sitosterol as feed marker 165
6.4.6
Sedimentation
165
6.4.7
Sediment Respiration
166 vi
Aquafin CRC Project 4.1 – Final Report
6.4.8
Discussion
6.5 Microbial ecology 6.5.1
Community ecology
6.5.1.1 Bacterial Counts 6.5.1.2 Bacterial Biomass 6.5.1.3 Beggiatoa counts
6.5.2 6.5.2.1 6.5.2.2 6.5.2.3 6.5.2.4 6.5.2.5 6.5.2.6 6.5.2.7 6.5.2.8
6.5.3
7.
Polar Lipid Fatty Acids and Ether Lipids Polar Lipid Fatty Acids (PLFA) Saturated fatty acids (SFA) Branched, saturated fatty acids Monounsaturated fatty acids (MUFA) Polyunsaturated fatty acids (PUFA) Hydroxy fatty acids Markers for Sulphate-reducing bacteria (SRB) Ether lipids
Summary/ Discussion
GENERAL CONCLUSIONS
7.1 Benthic Infaunal Characterisation
169
171 171 171 174 174
175 175 176 176 177 177 178 178 180
183
184 184
7.1.1
Areas of Equivalence between Sites
185
7.1.2
Site Specific Conclusions (Regional variability)
191
7.2 Integrated Management Model
197
7.3 Scientific Outcomes
201
8.
BENEFITS
202
9.
FURTHER DEVELOPMENT
203
10. PLANNED OUTCOMES
203
11. KEY FINDINGS AND RECOMMENDATIONS
205
12. REFERENCES
208
13. APPENDICES
217
13.1 Appendix 1 – Intellectual Property
217
13.2 Appendix 2 – Project Staff
217
13.3 Appendix 3 - Project Publications
217
13.3.1 Articles and Reports:
217 vii
Aquafin CRC Project 4.1 – Final Report
13.3.2 Conference Presentations:
217
13.3.3 Media Presentations:
219
13.4 Appendix 4 - Polar Lipid Fatty Acids and Ether Lipids
220
viii
Aquafin CRC Project 4.1 - Final Report
1. NON TECHNICAL SUMMARY CRC Project 4.1 Development of novel methods for the assessment of sediment condition and determination of management protocols for sustainable finfish cage aquaculture operations. PRINCIPAL INVESTIGATOR: Catriona Macleod ADDRESS: Tasmanian Aquaculture & Fisheries Institute - Marine Research Laboratories University of Tasmania GPO Box 252-49 Hobart TAS 7001 Telephone: 03 6227 7237 Fax:03 6227 8035 Email:
[email protected] OBJECTIVES: 1. To assess the potential for progressive degeneration of sediments in association with cage aquaculture operations. 2. To adapt and develop novel combinations of monitoring techniques (identified by TAFI and CSIRO) to facilitate evaluation of sediment degradation associated with ongoing marine cage aquaculture operations. 3. To incorporate these techniques into farm management protocols as tools for the evaluation and management of sediment condition in order to promote sustainable aquaculture production. NON TECHNICAL SUMMARY: OUTCOMES ACHIEVED TO DATE •
This research showed that although finfish aquaculture significantly affected sediments, under certain production scenarios (dependent on stocking level and baseline environmental condition) the sediments recovered after 3 months fallowing to a degree that enabled cages to be restocked. However, under intensive production regimes, the present results indicated that there was potential for progressive sediment degeneration, consequently environmental status should be considered as part of production planning.
•
A clear relationship between farm management practices and level of impact was established and a series of 9 distinct stages of sediment condition were characterised. Several field based techniques have been recommended which will enable farmers to easily classify sediment condition. With this information farmers will be able to gauge the environmental status of the sediments within their lease and make appropriate management decisions.
•
The value of these research findings has been acknowledged by stakeholders (industry and government) through their support for the development of a field-guide, data analysis package and associated training workshops; ensuring that the research outputs are incorporated into management practices as quickly as possible. 1
Aquafin CRC Project 4.1 – Final Report
This project constituted a 3-year multidisciplinary study of the changes in sediment condition associated with commercial finfish culture and was undertaken at the instigation of and with the collaboration of the Tasmanian Salmon Aquaculture industry, the Tasmanian Department of Primary Industry, Water and Environment (DPIWE) and the Fisheries Research and Development Corporation (FRDC). It was recognised that if the industry was to be economically sustainable it needed to be environmentally sustainable, and that in order to do this it needed to have a clearer understanding of the relationship between farming practices and environmental conditions. It is well recognised that organic enrichment of the sediments is one of the most significant impacts from caged fish farming. However, the effect that differing farming practices, such as rotational farming/fallowing, have on the level of impact, or the effect that different background environmental conditions may have on overall impact was less clearly understood. This project was initiated to assess the rate of recovery associated with fallowing practices, to determine if current farming practices were sustainable and to develop novel approaches for farm-based monitoring of environmental condition. Changes in the geochemical processes and benthic infaunal and microbial ecology were studied over two complete farming cycles at two farm sites in Tasmania (Creeses Mistake on the Tasman Peninsula and Stringers Cove on the Huon Estuary) with very different background environmental conditions. The results indicate that at both sites there were clear spatial and temporal impact gradients. Initially, unimpacted conditions at each of the sites were biologically and chemically distinct, but as organic enrichment of the sediment increased the chemistry and ecology of the two systems became more similar. Although there was significant recovery at the end of the study, neither site recovered completely to pre-farming/reference conditions (i.e. some measures always differed). However, sediment recovery was likely to be sufficient to enable re-use of the site for fin-fish aquaculture. Although assessment of the regenerative capacity of sediments associated with intensive cage aquaculture indicated the potential for progressive deterioration, unfortunately the duration of this project was insufficient to establish conclusively whether progressive deterioration does in fact occur. The rate of recovery differed both between sites and with differing stocking intensities, but clear impact levels were discernible and comparable between the sites. Several of the methods examined (eg. lipid biomarkers) showed a rapid and sensitive response to changes in organic enrichment, but benthic infaunal evaluation proved to be the most useful indicator of both degradation and recovery. We were able to characterise the degree of impact on the sediment condition at each of the study sites according to the benthic infaunal community changes. Nine impact stages were defined, encompassing both degradation and, importantly, the recovery phases. Potential monitoring techniques and differing farming intensities were subsequently related to this scale. A range of techniques was evaluated to assess their suitability for industry-based management of sediment condition. Benthic infaunal evaluation was used as the basis for judging the usefulness of other approaches. Several established environmental monitoring approaches were found to be poor indicators of sediment recovery, although useful measures of sediment degradation. However, other techniques such as video assessment were found to be very reliable. Semi-quantitative video assessment was determined to be the most effective approach for simple farm-based assessment 2
Aquafin CRC Project 4.1 – Final Report
of sediment condition. This approach was capable of discerning the broadest range of impact stages and was particularly useful in evaluating recovery over time. It is simple, rapid and cost-effective and can easily be undertaken by fish farmers, thus providing an immediate evaluation of sediment condition. When linked with farm data, the condition of a lease can be reviewed in a management context and informed management actions undertaken. Furthermore, when video footage is assessed with farm data it is possible to categorise the sediment condition to a particular stage and also predict the likely future classification on the basis of the proposed farming schedule.
IX
I
II III
VIII VII
IV VI* V
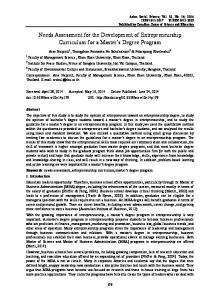
* Indicates conditions not observed in this study Suggest stage IX is sufficiently recovered for restocking STAGE – Category I - Unimpacted II - Minor Effects III - Moderate Effects IV - Major Effects (1) V - Major Effects (2) VI* - Severe Effects VII - Major Effects VIII - Moderate Effects IX - Minor Effects
STAGE – Description I - No evidence of farm impact II - Slight infaunal & community change observed III - Clear change in infauna & chemistry IV - Major change in infauna & chemistry V - Bacterial mats evident, outgassing on disturbance VI* - Anoxic/ abiotic, spontaneous outgassing VII - Monospecific fauna, major chemistry effects VIII - Fauna recovering, chemistry still clearly effected IX - Largely recovered, although slight faunal/ chemical effects still apparent
Figure 1.1. Impact and recovery stages.
The pattern of response in microbial biomass was very similar to that of the infauna, but infaunal assessment was more useful for farm management purposes. Some parameters (i.e. evaluation of the oxic zone and pore water ammonia), although not very sensitive to fluctuations in production levels, demonstrated that once farming commenced an impact was always detectable irrespective of fallowing protocols. Geochemical biomarkers (e.g. lipids and sterols) were identified for key components of the benthic infauna found in both impacted and unimpacted conditions. They were shown to be powerful tools for elucidating the biogeochemical processes occurring in the sediments and for identifying sources of organic matter, but it is unlikely that they would be useful for farm-based monitoring because the techniques for identifying and quantifying biomarkers are complex and the comparative costs are high. 3
Aquafin CRC Project 4.1 – Final Report
Relating the results from the scientific studies to farm production data has shown that changes in stocking levels (feed input and fish biomass) and/or duration of the fallow period can have a major effect on sediment recovery. Lengthening the fallow period led to increased recovery at one farm (Creeses Mistake), and reduction in stocking density also resulted in marked improvements in the rate and extent of recovery. These environmental benefits are both measurable and predictable, and therefore production intensity can be established as a variable (incorporating the rate and stage of recovery) in ongoing farm management protocols. The study also established that farm operations produce a generalised residual impact throughout the farm lease. Consequently, any evaluation of recovery at “fallowed” positions within the lease should take into account the likely effects of adjacent operational cages. It is not appropriate to determine effectiveness of fallowing just by the time that an area has been without a cage. Our results demonstrate that reliable information on sediment condition, used in conjunction with feed rate and stocking density, can assist farmers to manage their lease areas to obtain the best economic and environmental outcomes. This study has also greatly increased our understanding of the processes involved in organic enrichment, degradation and recovery as well as the effect that different background environmental conditions can have on the recovery process. At Stringers Cove, although the amount of organic carbon added to the sediments over the stocked period increased markedly, there was no change in the proportion of organic carbon in the sediments. We propose that the significantly increased macrofaunal and microbial biomass in the sediments at this time was able to keep pace with carbon inputs, remineralising and assimilating this labile carbon. In contrast, at Creeses Mistake the increase in the faunal and microbial communities was not as great and labile organic carbon in the sediments did increase over the stocking period, suggesting that Creeses Mistake is not as well adapted for increased carbon loading and has a greater potential to be overwhelmed. “A priori” it was anticipated that the more exposed site (Creeses Mistake) would be the more resilient to impact, but these results and the changes in the benthic community structure suggest that this may not in fact be the case, and that because of a natural pre-disposition to organic enrichment at the more sheltered site (Stringers Cove) the benthic infauna more effectively cope with higher levels of organic carbon. The findings identified and techniques developed in this study can be applied to other areas of research and environmental assessment. Our simple video and photographic assessment approaches would be applicable to other sources of organic enrichment or other sources of contamination. Several local and state government organisations have already expressed interest in these project outcomes. Stakeholders have been regularly updated on progress and results throughout this study and they have shown their support of the findings by their willingness to respond to the outcomes and support the field guide extension project. Both industry and government representatives have indicated their wish to be involved in training workshops, to ensure that the project recommendations are rapidly incorporated into management operations. KEYWORDS: environmental impact, salmonid aquaculture, recovery, monitoring, benthic fauna, microbiota, geochemistry, sediments.
4
Aquafin CRC Project 4.1 – Final Report
2. ACKNOWLEDGEMENTS: The authors would like to thank the funding agencies, the Co-operative Research Centre for Sustainable Aquaculture of Finfish (Aquafin CRC) and the Fisheries Research and Development Corporation (FRDC), for supporting this research. We would also like to acknowledge the support of the Tasmanian Aquaculture Industry both collectively through the Tasmanian Salmon Growers Association (TSGA), as well as the individual support of Tassal Pty Ltd. In particular we would like to recognise the help of Mick Hortle, Dan Fisk, Sean Tiedemann and Matt Finn in providing farm support and production information. Several other people have made important contributions to this research: Bob Connell was an integral part of the field team and made a significant contribution to the field sampling programme; Perran Cook was responsible for the sediment respiration studies at Stringers Cove (Section 5.4.8); John Gibson made a significant contribution to the polar lipid fatty acids and ether lipids study, with Mark Rayner and Stephane Armand also providing laboratory assistance (Section 5.5.2); Iona Mitchell, Stewart Dickson, Regina Magerowski, Dirk Welsford, Julian Harrington and Damian Trinder all provided help at some time with field sampling or laboratory processing of samples; Dean Thomson and Ros Watson carried out many of the nutrient analyses. Finally we would like to acknowledge the support of the two collaborative research institutions, the University of Tasmania and CSIRO Marine Research.
5
Aquafin CRC Project 4.1 – Final Report
3. INTRODUCTION 3.1 Background to study This study was undertaken at the instigation and with the collaboration of the Tasmanian Salmon Aquaculture industry, the Department of Primary Industry, Water and Environment (DPIWE) and the Fisheries Research and Development Corporation (FRDC). The salmon aquaculture industry recognised that to be economically sustainable it needs to be environmentally sustainable, and that to do this it needed to have a clearer understanding of the relationship between farming practices and environmental conditions. It is well recognised that one of the most significant impacts from caged fish farming is the organic enrichment of the sediments (Iwama, 1991, Black et al., 2001). What is less clearly understood is the effect that differing farming practices, such as rotational farming/fallowing, have on the level of impact or the effect that different background environmental conditions may have on overall impact. Consequently, this project was initiated to assess the rate of recovery associated with fallowing practices, to determine if current farming practices were sustainable and to develop novel approaches for farm based monitoring of environmental condition.
3.2 Previous research on sediment recovery There is a considerable body of research examining the impacts of organic enrichment but much of this has focussed on the degradation response rather than recovery. One of the most significant studies to date is that of Pearson & Rosenberg (1978). Pearson & Rosenberg identified a series of macrobenthic successional stages in relation to an increasing organic enrichment gradient which have subsequently been supported by many others (eg. Brown et al., 1987; Ritz et al., 1989; Weston, 1990; Holmer & Kristensen, 1992; Findlay et al.,1995; Cheshire et al., 1996; Hargrave, et al., 1997, Wildish et al., 2001, Macleod et al. 2002, Brooks et al., 2003). Several of these have compared the infaunal categories defined by Pearson and Rosenberg to other physicalchemical and biological parameters (Brown et al., 1987, Weston, 1990, Holmer & Kristensen, 1992, Findlay et al., 1995, Cheshire et al., 1996, Hargrave et al. 1997, Wildish et al., 2001, Macleod et al. 2002) and have suggested a direct relationship between the chemical status of the sediment and the infaunal community structure. However, more recent research in Tasmania has suggested that the correlation levels indicated in the northern hemisphere studies may not be applicable to temperate Australian waters (Macleod, 2000; Macleod et al., 2002, Macleod et al., in press). We examined a broad range of physical, chemical and biological parameters, comparing the levels of sediment and benthic recovery to determine the most accurate but cost effective approaches for farm based monitoring in Tasmania. Relatively few studies have been undertaken to evaluate recovery of marine finfish farms, but results suggest that recovery is relatively rapid (6-12 months) compared with other sources of organic pollution (Johannessen et al., 1994, Brooks et al, 2003). However, in any comparison it is important that the context in which recovery is judged is equivalent. The rate of recovery will be strongly influenced by the prevailing environmental conditions. Many environmental studies have shown that 6
Aquafin CRC Project 4.1 – Final Report
site characteristics, such as water depth, particle size, current velocities and tidal effects play an important role in determining the rate and extent of both degradation and recovery of sediments. In the aquaculture context, farm management criteria (i.e. cage size, stocking density/biomass, feed input and timing/duration of stocked/fallow period) will also be critical factors in determining impact/recovery level. What is measured is also extremely important in obtaining a realistic evaluation of recovery. Some measures are much more sensitive to sediment impact/recovery than others. For example, at fish farms in British Columbia, Canada, physical-chemical parameters at cage sites returned to reference conditions within a few weeks, whilst the macrofauna took more than 6 months to recover (Brooks et al., 2003). In Tasmania, the physical and chemical properties of sediments showed that fish farm-derived organic matter levels (identified through fatty acid profiles) remained elevated at cage sites 12 months after the cages were emptied, despite redox potential indicating a return to reference conditions (McGhie et al., 2000). In another Tasmanian study, sulphide concentration returned to reference conditions within 6 months of the lease being vacated whilst the infaunal community structure was still significantly different after 36 months (Macleod et al., in press). In the current study, recovery was evaluated for several key criteria (physical, chemical and biological) at two farm sites with very different environmental conditions and the results compared to determine the effect of location on overall recovery performance. It is well recognised that benthic infaunal evaluation is amongst the most sensitive of approaches for evaluation of sediment condition. Consequently full community assessment will be the benchmark against which all other evaluations of recovery are judged. However, it is also recognised that for sustainable management of sediments within marine farm leases it may not be necessary for the system to recover to pristine condition. A further aim was to evaluate the level of recovery necessary for sustainable operation, and which does not result in progressive deterioration of the sediments.
3.3 Need for Research 3.3.1 Environmental Significance Marine finfish cage culture can result in organic enrichment of the underlying sediments as a result of the deposition of waste food and faeces. Typically, flora and fauna of impacted sediments adapt to utilise this new nutrient source, resulting in changes in benthic community structure. However, if the sediment’s capacity to assimilate organic inputs is exceeded, the sediment may become anoxic, the sediment biogeochemistry will be altered towards a system dominated by anaerobic microbiota, and toxic degradation products can be released into the environment affecting farm production and aquatic ecosystem health. To overcome this, it is usual for farmers to leave areas of seabed free from farming activities for a period of time to enable them to recover, a process commonly referred to as fallowing. However, the level to which this recovery occurs is currently unknown and thus it is important from the perspective of both farm management and ecosystem protection to better understand the rate of change of sediment condition. To date, studies of the environmental impacts of cage aquaculture have not addressed whether progressive sediment deterioration occurs, whether any management practices or other factors exacerbate sediment degradation or whether the aquaculture industry can monitor and mitigate 7
Aquafin CRC Project 4.1 – Final Report
such effects. In particular, although there have been many studies of the organic enrichment of sediments under cages, (e.g. Brown et al., 1987; Ritz et al., 1989; Weston, 1990; Holmer & Kristensen, 1992; Findlay et al., 1995; Cheshire et al., 1996; Hargrave, et al., 1997), there is much less literature pertaining to the usefullness of fallowing. Generally, the focus has been on changes over relatively broad spatial and/or temporal scales and has attempted to define the distinction between reference sites exhibiting background environmental conditions and farm conditions (e.g. Gowen et al., 1988; Lumb, 1989; Ritz et al., 1989; Johannessen, 1994; Lu & Wu, 1998). As a consequence, as both Braaten (1991) and Cheshire et al. (1996) point out, there is a lack of information on the changes in the sediment conditions associated with fallowing of fish cages. The development of guidelines for fallowing of sediments beneath marine fish cages requires further information on the changing sedimentary conditions over smaller spatial and temporal scales than is currently available. It also requires that environmental parameters be assessed in relation to conditions prior to each stocking as well as at reference locations. The literature regarding the length of time required for complete sediment recovery is inconclusive. Lumb (1989) and Johannessen (1994) both found significant residual effects 12 months after cessation of farming, whereas Ritz et al (1989) and Wu & Lu (1998) observed what appeared to be more rapid recovery rates. However, all studies considered recovery to be a return to control conditions, which are representative of areas unaffected by farming. With regard to farm sustainability, it may be more appropriate to determine whether sediments have recovered sufficiently such that they can withstand further inputs without undergoing any cumulative deterioration. If fallowing protocols fail to return sediments to this condition, then there is a danger of long-term additive deterioration of the sediment, which may eventually lead to sediment degeneration to such an extent that farming operations become unviable and the ecological function is significantly impaired. 3.3.2 Economic importance Atlantic salmon (Salmo salar) culture is an economically important industry in Tasmania. Figures for 2001/2 indicated that salmon aquaculture was worth more than $110 million annually from a total production of approximately 14,000 tonnes (Love and Langenkamp, 2003). Both State and Commonwealth governments in Australia strongly appreciate the need for ecologically sustainable development. A guiding principle of the Coastal Policy initiated by the Commonwealth government and developed by the States, is that the coast shall be used and developed in a sustainable manner. The Tasmanian government recognises the economic and social benefits associated with a productive aquaculture industry and is highly supportive of its further development. In 1997, in the Tasmanian Premier’s direction statement, sustainable aquaculture development was listed as one of the highest priorities. To this end the Tasmanian State government is actively engaged in facilitating development by ensuring that sufficient areas of state water are made available to accommodate industry expansion. Similarly, the finfish aquaculture community is acutely aware of its reliance on the environment and is keen to ensure that future development is sustainable. Salmon farming industry representatives have recently identified an urgent need for clear information on the effectiveness of fallowing as a means of rehabilitating sediments. 8
Aquafin CRC Project 4.1 – Final Report
This information is vital for the optimal management of lease areas and to ensure that production is sustainable.
3.4 Aims & Scope of the study This project was developed as an integrated multidisciplinary investigation of the changes in sedimentary processes associated with current salmon farming practices in Tasmania. The project involved assessment of the chemical, microbiological and biological responses of sediments under Atlantic salmon (Salmo salar) cages at two locations in southern Tasmania. One site was relatively exposed and subject to greater water flows and wave action than the other, which was more sheltered. The original project had three principal objectives: 1. To assess the potential for progressive degeneration of sediments in association with cage aquaculture operations. 2. To adapt and develop novel combinations of monitoring techniques (identified by TAFI and CSIRO) to facilitate evaluation of sediment degradation associated with ongoing marine cage aquaculture operations. 3. To incorporate these techniques into farm management protocols as tools for the evaluation and management of sediment condition in order to maximise sustainable aquaculture production. The project was amended in January 2004 to include 2 additional objectives: 4. To develop a training package (field guide and multimedia cd) for the aquaculture industry to simply explain the techniques proposed in CRC project 4.1. 5. To conduct a series of workshops in Tasmania to instruct farm personnel in the field sampling requirements, analysis and interpretation of the techniques recommended in CRC project 4.1 and in the field guide.
3.5 Study Context & Design 3.5.1 Selection of Study Sites 3.5.1.1 Site locations Salmon farming in Tasmania is largely focused in the south-east, with farms occupying the areas of Port Esperance and the Huon River, the D’Entrecasteaux Channel and the Tasman Peninsula (highlighted in Fig. 3.5.1.1.1). Two of these regions were selected for this study, Port Esperance and the Tasman Peninsula. In selecting sites, it was planned that the outcomes of the study would be applicable to marine finfish farms state wide. To do this, it was essential that different background environmental conditions were examined.
9
Aquafin CRC Project 4.1 – Final Report
South-eastern Tasmania Fig. 3.5.1.1.1. Map of Tasmania with South-eastern Tasmania enlarged. The 3 main farming regions are indicated by stars.
In each of the two selected regions a lease was chosen that would adhere to a specified production regime for two whole cycles. These were Creeses Mistake at the Tasman Peninsula, and Stringers Cove at Port Esperance. The Creeses Mistake lease is located off the northern shore of Wedge Bay, an open bay adjacent to Storm Bay (Fig. 3.5.1.1.2a). The Stringers Cove lease is located approximately 150m off the south-west shore of Port Esperance (Fig. 3.5.1.1.2b).
a)
b
Fig. 3.5.1.1.2. Selected leases in South-eastern Tasmania a) Creeses Mistake and b) Stringers Cove.
3.5.1.2 Natural environmental conditions at the study sites The background environmental conditions at each site differed considerably. The depth range of sites at Creeses Mistake is 15-20m, compared to 35-40m at Stringers Cove. Creeses Mistake is entirely a marine environment, exposed to westerly and southwesterly winds. The site is also strongly influenced by wave action and ocean swell. Sediments are predominantly fine sands, with a low percentage of silt-clays. Stringers Cove, although essentially marine, is subject to freshwater runoff during heavy rain periods. The lease is exposed to the northwest, but is protected from most wave action and ocean swells. Sediments are predominantly silt-clays. 3.5.1.3 Site history The original Creeses Mistake lease was granted in 1993. The lease was 15ha, and was stocked with salmonids in May 1995. In the period between 1995 and 2000, the lease was stocked for at least 8 months each year, with fallow periods (whole lease) of between 1 and 4 months. In 1999 the farm lease area was extended to 30 ha, with annual production increasing from 394 tonnes in 1998 to 1336 tonnes in 2001.
10
Aquafin CRC Project 4.1 – Final Report
Two cages were randomly selected from within the Creeses Mistake lease (Fig. 3.5.1.3.1). Position 5 was first stocked in 1997 for five months, then for three months in 1999. In 2000 position 5 was only stocked towards the end of the year with a break of two months before being restocked in the current study. Position 8 was also first stocked late in 1997 but was not used again until 2000 when it was occupied from July until December, with a fallow period of two and a half months before being restocked as part of this study.
Fig. 3.5.1.3.1. Lease location and pen positions at Creeses Mistake, Tasman Peninsula (5m contour then 10m contour intervals).
The original Stringers Cove lease was first stocked in 1989 with an area of approximately 5 ha. Between 1989 and 1999 there were several expansions to this lease and the position and stocking levels varied markedly. In 1999 the lease was extended to 24.8 ha, although production (tonnes) did not markedly increase from the previous year. Four study cages were originally identified at this site (positions 1, 2, 1A and 2A), all were in the area granted as a lease extension in 1999 and had not previously been farmed (Fig. 3.5.1.3.2). Shortly after the start of the study it was suggested that impact and recovery rates might differ between sediment new to farming and that which had previously been farmed. Consequently, two previously farmed pen positions were added (3A and 4A) to the study. These two positions were located within the original lease area, and have therefore been subject to ongoing farming of varying intensities since 1989 (Fig. 3.5.1.3.2).
11
Aquafin CRC Project 4.1 – Final Report
Fig. 3.5.1.3.2. Lease location and pen positions at Stringers Cove, Port Esperance (5m contour then 10m contour intervals).
3.5.2 Basic Sampling DesignSpatial Analysis At Creeses Mistake two cages (cages 5 and 8) were randomly selected within the lease (Fig. 3.5.1.3.1), with two references located 150m away from the edge of each study cage. The references were within the same depth contour as the cages, and had the same particle size distribution. It was proposed that the cages would be sampled at regular intervals over two farm production cycles. Each production cycle involved a 9 month stocking period and three month fallow period, with the second production cycle starting immediately after the completion of the first cycle’s fallow period. Unfortunately, the farm was unable to adhere to this schedule at one of the study cages, and at position 8 the first fallow period continued for 4.5 months. This position then returned to the proposed production scenario and was stocked for 9 months and fallowed for 3 months. This meant that in the second cycle the two cages could no longer function as treatment replicates. In order to obtain as much information as possible from this study it was decided to extend the fallow period of the other cage (position 5) in the second production cycle to compare the effects of the extended recovery period (4.5 months) between the two cycles. A further difficulty at Creeses Mistake was that the farming intensity declined markedly after the first production cycle. In production cycle 2, feed input and fish biomass in the study cages were halved compared to production cycle 1. At Stringers Cove, two study cages were randomly selected within each of three different farming scenarios/treatments (Fig.6.5.1.3.2), giving a total of six study cages. The first scenario included cages above sediment that had not been previously farmed. These cages (cages 1 and 2) were stocked in the first production cycle and fallowed for the subsequent 15 months. The second scenario (cages 1A and 2A) had also not previously been farmed, but was only stocked in the second cycle (i.e. fallowed over the first production cycle (the first 13 months), then stocked for 9 months and fallowed for 3 months). The third scenario (cages 3A and 4A) was subject to the same stocking regime as treatment two, but these positions had been exposed to previous farming activity. Two reference positions located 150m from the edge of cages 1A and 2A were also studied. Once again there were problems in maintaining 12
Aquafin CRC Project 4.1 – Final Report
equivalence between the two production cycles and feeding levels were markedly reduced in the second production cycle. 3.5.2.1 Temporal Analysis Sampling at both sites followed a BACI design (Before, After, Control, Impact). Samples were collected prior to stocking, during stocking (after 4.5 and 6 months), at the end of stocking / start of fallowing (9 months) and during the fallow period. In the first production cycle at Stringers Cove, samples were collected fortnightly over the fallow period to determine the rate of recovery, whilst at Creeses Mistake samples were only collected at the start and end of the fallow period. The extra information gained through fortnightly sampling at Stringers Cove proved to be most valuable in interpreting recovery rates, and as a result fortnightly sampling was undertaken at both Stringers Cove and Creeses Mistake over the fallow period of the second production cycle. The dates that sampling occurred, and the stocking /destocking dates for the study cages, are shown in Fig. 3.5.2.2.1 (a) Creeses Mistake, b) Stringers Cove). The proposed stocking/destocking schedule was disrupted at Creeses Mistake in the first production cycle, with the duration of the fallow period differing at the end of the first production cycle (the fallow period at cage 8 was extended from 3 months to 4.5 months). As a result, the cages could not follow equivalent production scenarios in the second cycle (they were 6 weeks out of alignment). In order to examine the full 3 month recovery period in the second cycle for both cages, the study was extended to April 2003, when the final sampling was undertaken at cage 8 after its 3 month fallow period. In addition, the fallow period of cage 5 in the second cycle was extended to 4.5 months so as to be equivalent to that of cage 8 in the first cycle, and determine if changes resulting from the additional fallowing time were consistent over the two farming cycles.
13
Aquafin CRC Project 4.1 – Final Report
P8 Stocked P5 stocked 26 Feb 21 Feb 31 Mar
25 Jun
T0
a)
13 to 27 Sept
T4.5
1 r0 Ma
P8 emptied P5 emptied
P8 vacant
1 n0 Ju
19 Nov
18 Dec 2 Jan
T13
1 c0 De
1 p0 Se
25-Nov 14-Nov
16 May 15 May
5 Aug
16 Sept
T14.5
T17.5
T19
2 n0 Ju
7 Apr 24 Feb 13 Jan 24 Mar JanFeb 5 Jan 29 10 29 Apr 10 Mar 27 Jan 16 Dec
T23 T24.5 T26.5 T26 T23.5 T25 T22 T24 T25.5
2 p0 Se
2 c0 De
3 r0 Ma
1A emptied 4A emptied 3A emptied 2A emptied
3A stocked 1A,2A stocked 4A stocked
04-Feb 30-Jan20-Feb
01-Nov 31-Oct 26-Nov 06-Nov
06-Aug 09-Jul
T0
01 Feb
P8 emptied P5 emptied
P8 stocked
2 r0 Ma
P1 emptied P2 emptied
P2 stocked
b)
25 Mar 19 Mar
T9
P1 stocked
22-Feb 05-Feb 22-Mar
P5 stocked
T4.5
01 May
T6
01 Aug
03-Sep 01-Oct 29-Oct 07-Jan 12-Nov 23-Jan T7 T8 T9 26-Nov T11.5 07-Feb T9.5 10-Dec T12 18-Feb T10 T12.5 T10.5 T13
01 Nov
01 Feb
01-Jul
12-Aug
T17.5
T19
01 May
Fig 3.5.2.2.1. Sampling dates and stocking / destocking dates for a) Creeses Mistake and a) Stringers Cove.
14
01 Aug
11-Nov 20-Jan 25-Nov 03-Feb T22 09-Dec T24.5 T22.5 06-Jan T25 T23 T24
01 Nov
01 Feb
Aquafin CRC Project 4.1 – Final Report
4. METHODS
4.1 Positioning equipment Prior to sampling, each lease was mapped using a Garmin 135 GPS Map unit coupled with a Racal differential unit. Depth and positional information were collected for all cages present on the lease at the time. In addition, reference locations, within the same depth range, but 150m away from the edge of selected study cages, were located using the depth contours and GPS.
4.2 Water column sampling Current flows were measured using an Acoustic Doppler Current Profiler (ADCP), which measured current speed and direction throughout the water column (from 3m above the sediment surface to the water surface) every 10 seconds. These readings were then averaged over 1 minute. Current data was collected continually for a 1 month period, in summer and winter of the first production cycle at both Stringers Cove and Creeses Mistake. To detect any interannual variation both farms also had an additional summer deployment of the ADCP in the second production cycle. Temperature and salinity profiles of the water column were recorded on each sampling occasion using a Digital Data Logger (PSW-CTD02). Turbidity was recorded every 10 metres at all sites (until September 2002) using a Turbidimeter (using Nephelometric units, or NTU, for turbidity). Two water samples were taken at each sampling location and the turbidity recorded as the average of these readings. Dissolved oxygen was recorded in % saturation, using a WTW meter and probe. DO was initially recorded every 10 metres throughout the water column at each site. Early analyses showed no difference with depth and therefore measurements were only taken from the water immediately above the sediment surface.
4.3 Faunal sampling Five replicate samples were collected from each station using a Van Veen Grab (surface area – 0.0675m2). Grab contents were transferred to mesh bags (mesh size 0.875mm) and rinsed. Samples were then wet seived to 1mm and the retained material preserved in a solution of 10% formalin:seawater (4% formaldehyde). Samples were transferred to the laboratory for sorting and the infauna identified to the lowest possible taxonomic level and enumerated.
4.4 Redox & Sulphide Assessment Three replicate cores (perspex tubes 250mm length x 45mm internal diameter) were taken at each station using either a multicorer (Stringers Cove) or Craib corer (Creeses Mistake) for measurement of redox potential and sulphide concentration. Redox was measured at 1cm, 2cm, 3cm, 4cm and 5cm using a WTW Redox Probe. Sulphide was also measured at 1cm, 2cm, 3cm, 4cm and 5cm using a Cole-Parmer 27502-40 silver/sulfide electrode according to the method described by Wildish et al. (1999). Sub-samples (2ml) were taken at each depth and 2ml of anti-oxidant buffer was added prior to measurement. Temperature of both the sediment and overlying water were recorded at the time of measurement. 15
Aquafin CRC Project 4.1 – Final Report
After the redox and sulphide measurements were obtained, the top 5cm from each of the three replicate cores at each site was extruded and cut in half. These core halves were retained for granulometry analysis and organic matter determination, any remaining core halves were collected and frozen in sealed plastic bags. Some of these have subsequently been processed for metals analyses and foraminiferal community assessment.
4.5 Granulometry and Organic Matter Determination For particle size analysis each sub-sample was dried at 30°C and the weight recorded. The samples were then passed wet through a series of sieves (4mm, 2mm, 1mm, 500µm, 250µm, 125µm and 63µm), and the sediment retained on each sieve was collected, dried at 30°C and weighed. The proportion of sediment retained on each sieve was then calculated as a percentage of the total sample weight. The proportion of sediment smaller than 63µm was determined by calculating the difference between the total sample weight and the summed weight of each retained fraction. For selected samples (Stringers positions 1, 1A, 3A, R1 at 0, 9, 13, 22 and 25 months) the fraction less than 63µm was further analysed using the pipette method (Holme and MacIntyre, 1984). Total organic matter was determined by modification of the loss on ignition technique (Greiser & Faubel, 1988). Samples collected from the top 5cm of each core were homogenised and a subsample of approximately 2-5 grams was taken. In order to remove excess carbonate, sediments were sieved to remove large shell fragments and any remaining carbonate was neutralised by acidification with 1N HCl. The samples were oven dried for 24 hours at 60°C before being transferred to a muffle furnace for 4 hours at 500°C. The weight of organic material was calculated as the difference between the oven dried and final furnace ashed weights.
4.6 Assessment of Sedimentation Rate Sediment traps were purpose built to hold three replicate, cylindrical canisters (with an aspect ratio (height:diameter) of 6.25). Canister openings were 1m above the seabed and 0.25m apart (in a triangular formation). A gimbaled arrangement was built into the traps to ensure that the canisters were held upright at all times. Sediment traps were deployed monthly in the first production cycle for a period of 24 hours at three fixed positions at each farm; i) immediately adjacent to a stocked cage site, ii) at a farm site (in between stocked cages) and iii) at a reference site (corner marker of the farm lease). Sediment trap canister contents were allowed to settle, and the excess supernatant decanted before being filtered under vacuum using Whatman GF/C glass fibre filters. Filters had previously been ashed at 500°C for 24 hours to remove impurities. To determine the sedimentation rate, filters were dried at 30°C for 24 hours, allowed to cool in a dessicator and the dry weight recorded. Where ‘swimmers’ (large fauna) and algal matter were evident in samples, these were removed prior to drying and their presence noted. Organic matter content (% organic matter and grams organic matter deposited per day) was obtained by ashing filters at 500°C for 4 hours and recording the weight lost.
16
Aquafin CRC Project 4.1 – Final Report
4.7 Stable Isotope Evaluation 4.7.1 Sample Collection Sediment samples were collected from adjacent to cages, in-between cages, and reference sites using a Van-Veen grab. Replicate sub samples were collected from two grabs taken at each site and were stored in glass jars and frozen until analyzed for lipid biomarkers, carbon and nitrogen content and stable isotopes ( 13C and 15N). 4.7.2 Sediment Extraction A 15- 20 g aliquot of wet sediment was extracted in a 250ml separating funnel using a modified Bligh and Dyer (1959) methanol / DCM / water mixture (2:1:0.8 by volume). A synthetic C24 sterol (5β-cholan-24-ol) was added at this stage as an internal standard.The samples were shaken every hour for 3 hours and then left overnight to extract. Phases were separated the next day by addition of DCM and water to bring the final mixture ratio to 1:1:0.9 methanol/DCM/water by volume. The total solvent extract was obtained by rotary evaporation at 40°C of the lower phase. The total extract samples, made up in DCM, were then stored in glass vials, refrigerated ready for saponification. 4.7.3 Fauna Extraction (Stringers only) A sample, typically 3-5 g of bulk fauna / grit was extracted in a 250 ml separating funnel using the same method described above. Samples of individual fauna, 0.5-1.0 g, were transferred to a large centrifuge tube along with 20 ml of the Blyer and Dyer methanol / DCM / water mix described above. This mixture was vortexed for 2 min, sonicated for 10 mins, and then centrifuged for 10 mins at 1500 rpm, before being transferred to a 250 ml separatory funnel. This procedure was repeated 4 times for each sample. Phases were separated the next day by addition of DCM and water such that the final mixture ratio was 1:1:0.9 methanol / DCM / water by volume. Total extracts were obtained and stored as described for sediments. 4.7.4 Stable isotopes and % organic carbon and nitrogen Sediment samples for stable isotope analysis were dried in an oven overnight at 60°C, before being ground with a mortar and pestle. Sediment samples were weighed into tin cups (Elemental Microanalysis Ltd., Okehampton, UK) for nitrogen analysis. For the analysis of carbon, samples were weighed into aluminium cups and then acidified using sulphurous acid to remove any mineral carbonates. Samples were then analysed for nitrogen and carbon content, δ15N and δ13C using a Carlo Erba NA1500 CNS analyser interfaced via a Conflo II to a Finnigan Mat Delta S isotope ratio mass spectrometer operating in the continuous flow mode. Combustion and oxidation were achieved at 1090ºC and reduction at 650ºC. Samples were analysed at least in duplicate. Results are presented in standard δ notation:
⎡ Rsample ⎤ − 1⎥ × 1000 ‰ δ15N or δ13C (‰) = ⎢ ⎣ Rs tan dard ⎦ 17
Aquafin CRC Project 4.1 – Final Report
where R = 13C/12C or 15N/14N. The standard for carbon was VPDB limestone and the standard for nitrogen was atmospheric N2. The reproducibility of the stable isotope measurements was ~0.2‰ for C and 0.5‰ for N.
4.8 Biomarkers 4.8.1 Sample Collection. Sediment samples were collected as per stable isotope technique described above. Samples of the benthic infauna were obtained by sieving sediment grab samples though a 0.875mm mesh bag. The samples were then immediately sorted and the fauna collected transferred to glass jars and stored frozen until later analysed for fatty acid and sterol biomarkers. Bulk fauna were collected at cage site P2 and ref site 2 at 9.5 months during the first production cycle, and at 4.5 and 6.0 months during the second cycle. An aliquot of the sediment remaining after sieving though the mesh bag was also collected and stored in glass jars ready for analysis. In the second cycle the most significant species from the reference and cage sites were separated from the bulk fauna / shell grit samples at 4.5 month and 6.0 month and analysed separately. These species were Capitella sp, Nebalia long, Corbula gibba and Neanthes cricognatha from the cage samples and Amphiura elandiformis, Nassarius nigellus and Thyasira adelaideana from the reference site. 4.8.2 Fatty acid and Sterol analysis. A 40% aliquot of the total solvent extract (TSE) from the sediment samples, and 80% from the individual fauna TSE, was saponified with potassium hydroxide in methanol, 5% wt./vol, under nitrogen for 2 hours at 80°C. Non saponified neutral lipids were then extracted into hexane / DCM (4:1 by vol, 3×2 ml) and transferred to sample vials ready for analysis by GC and GC-MS after derivatisation with 100 µl of BSTFA solution at 60°C for 1 hour. Following acidification of the remaining aqueous layer using hydrochloric acid to pH2, total fatty acids (TFA) were obtained and methylated to form their fatty acid methyl esters (FAME) using methanol / hydrochloric acid / DCM (10:1:1 by volume; 80°C, 2 hours). A 19:0 or 23:0 FAME internal injection standard was added to the TFA fractions before GC and GC-MS analysis. 4.8.3 Gas chromatography (GC) GC was performed on a Varian 3410 gas chromatograph equipped with an 8100 autosampler, flame ionisation detector (FID) and septum-equipped programmable injector (SPI). The GC oven was fitted with an HP5 ultra 2 capillary column (50 m; 0.32 id; 0.17 µm film thickness). Samples were injected at an oven temperature of 45°C; after 1 min the temperature was raised at 30°C/min to 140°C and then by 3°C/min to 300°C where the oven temperature was held for 5 min for analysis of fatty acids. The final oven temperature was increased to 312° C and the final time to 10 mins for the sterol analysis. The SPI was programmed at 180°C/min from 45°C to 310°C immediately after injection and held at 310°C for 30 min before cooling. The detector temperature was held at 310°C. Data were acquired and plotted using Millenium software (Waters Corp.) 18
Aquafin CRC Project 4.1 – Final Report
4.8.4 Mass spectrometry (MS). GC-MS analysis of the FAME and non-saponified neutral lipid fractions were performed with a Finnigan GCQ Plus GC-MS system fitted with on-column injection. Samples were injected using an AS2000 auto sampler into a 15 cm 0.52 mm id deactivated capillary retention gap attached to a HP 5 Ultra2 50 m, 0.32 mm id, and 0.17.µm film thickness column, using helium as the carrier gas. Typical mass spectrometer operating conditions were: EV, 70 eV; Emission current 250 µA, transfer line 310°C, source temperature 240°C, 0.8 scans /sec and mass range 40-650 Dalton.
4.9 Visual assessment techniques Video footage was taken using a digital underwater camera system linked by an umbilical to a digital recorder on the surface. A minimum of 2 minutes footage was taken from each sample station. Digital photographs were taken of each sample prior to sorting and post-sorting. Specific features deemed to be indicative of environmental condition (identified through the full analysis of these samples) were then assessed in each photograph and scores assigned to these features (Table 4.9.1). Scores were then weighted depending on the level of impact indicated by each feature. A positive weighting indicated better environmental indicators and a negative weighting indicated features symptomatic of impact. The scores were then summed with the total score reflecting the environmental status of that sample and enabling a semi-quantitative comparison between samples. Table 4.9.1. Visual characterisation of benthic fauna features used at A) Creeses Mistake (Site 1); and B) Stringers Cove (Site 2) with weighting and category indicated. All other features scored as presence (1)/absence (0) data. Feature Density score Site 1 Corbula gibba 0,1,2 x Capitellid worm 0,1,2,3 x Other worm 0,1,2 x Brittle star 0,1 x Heart Urchin 0,1,2 x Side gilled sea slug 0,1,2 x Mussel shell 0,1,2 x Nassarid gastropod 0,1,2 x Other invertebrates 0,1,2 x
Site 2 x x x x x x x x x
Weighting Category 1 -ve 2 -ve 1.5 +ve 2 +ve 1 +ve 1 -ve 1 -ve 1 -ve 1 +ve
Video was scored according to key features determined to be indicative of impacted or unimpacted conditions, as defined by previous research (Crawford et al., 2001; Macleod et al., 2002), background environmental information and benthic community structure information collected during this study (Table 4.10.2). As with the benthic photographs, each feature/variable was weighted according to its sensitivity to detect impacts or no impacts. For example, Beggiatoa is a well recognized indicator of environmental degradation (GESAMP, 1996), and therefore received a high weighting. Evidence of gas bubble emission received the highest weighting, as this suggests a highly degraded system. The score for each feature could be either positive or negative, depending on whether the variable represented a positive or negative effect. Categorising the variables in this manner means that features indicative of good environmental conditions will tend to increase the final score, whilst those suggesting an impact would reduce the overall score. Therefore the higher the 19
Aquafin CRC Project 4.1 – Final Report
summed score, the better the sediment condition. The resulting scores can either be analysed using univariate techniques (i.e. summed as a single score for each station/time) or can be set up as a matrix for multivariate analyses. Table 4.10.2. Video features used at A) Creeses Mistake (Site 1); and B) Stringers Cove (Site 2) with weighting and category indicated. All fauna were scored as density estimates (ie. 1= sparse, 2 = dense). Beggiatoa scored by thickness of mat (patchy =1, thin = 2, thick = 3). % Algal cover scored as sparse (1), moderate (2) or dense (3), as was Burrow Density. All other features scored as presence (1)/absence (0). Feature Site 1 Gas bubbbles x Black/grey sediment x Beggiatoa x Pellets and faeces x Farm-derived debris x Nassarid gastropod x Side gilled seaslug x Heart urchin x Squat Lobster % Algal cover x Burrow density x Worm tubes/casts x Faunal tracks x Brittle star x Maoricolpus roseus x Other Echinoderms x Crustaceans x Echiurans & Annelids x Fish x Planktonic Crustacean
Site 2 x x x x x x x x x x x x x x x x x x x
Weighting Category 10 -ve 1 -ve 1.5 -ve 1 -ve 1 -ve 1 -ve 1 -ve 1 -ve 1 -ve 1.5 +ve 1.5 +ve 1 +ve 1 +ve 1.5 +ve 1 +ve 1 +ve 1 +ve 1.5 +ve 1 +ve 1 +ve
4.10 Metals Analyses Sediment samples were removed from the freezer and dried at 104°C. Each sample was ground to a particle size 10,000/m2 Patchy Beggiatoa/outgassing may be evident
IX VIII
Opportunists (esp. Capitellids) characterise community - abundances >5,000/m2
I
STAGE
Rapid change in community mix - deposit feeding polychaetes/opportunists dominate. Filter/suspension feeders absent.
Cage Stocked
I
Larger, long lived species & pristine indicators absent. Diversity may be greater than unimpacted (zone of enhancement)
III
No evidence of impact UNIMPACTED - unimpacted indicator species present
II
Aquafin CRC Project 4.1 – Final Report
UNIMPACTED
Fig.5.3.8.1. General characterisation of impact/recovery stages based on main community changes.
53
Aquafin CRC Project 4.1 – Final Report
V VI VII STAGE
VIII
UNIMPACTED Indicator -Apseudes, Ampelisca Function - Suspension feeders with mixture of omnivores, deposit feeders & predators & few filter feeders
IV
Indicator – Mix of species with ? crustacea & ?annelids. *Spionidae(13177), *Euphilomedes, *Nephtys, *Apseudes Function - Deposit feeders (largely surface)
III
Indicator – Capitella (lower no.s), Euphilomedes, *Spionid (13177), *Sabellidae (cf Euchone) Function - Deposit feeders (infaunal and surface)
Indicator – Capitella (dominant), *Neanthes, *Phoxocephalidae, *Dimorphostylis Function - Deposit feeders
II
Indicator – Capitella (dominant), Neanthes, *Corophium, *Spionid (13177), *Tethygenia, *Cumacea (27016), *Phoxocephalidae Function - Deposit feeders (infaunal and surface)
I
Indicator - Lyssianassidae, Eupilomedes, *Spionidae (13177)?, *Phoxocephalidae Function - Deposit feeders (largely surface)
Indicator - Apseudes, Ampelisca Function - Suspension feeders with mixture of omnivores, deposit feeders & predators & few filter feeders
Cage Stocked
RECOVERING (Passive) Indicator - Capitella (dominant), Nebalia, *Neanthes, *Corophium, *Phoxocephalidae Function - Deposit feeders (infaunal)
IMPACTED
Indicator - No Fauna Function – Microbial activity only
DEGRADING (Active)
Indicator – Capitella (greatly dominant), *Neanthes, *Phoxocephalidae Function - Deposit feeders
UNIMPACTED
Environmental impacts affect the infaunal community at various levels depending on the severity of effect; minor effects result in species level changes whist more significant impacts will affect the community at a higher taxonomic level (Somerfield and Clarke, 1995). At Creeses Mistake the background faunal community was characterised by crustaceans. With the onset of farming this changed markedly and polychaetes became the dominant community group. This represents a community shift at the phylum level and indicates a severe change. Consequently discerning impacted from non-impacted community is relatively easy. Subtle changes reflecting degrees of impact and recovery occur at lower taxonomic level and are harder to distinguish and are perhaps beyond the capability of farm personnel. Nonetheless such changes could be used by skilled technical staff and researchers to discern the differing levels of impact (Fig. 5.3.8.2). These changes in the faunal composition will result in changes in the system function (Fig. 5.3.8.2), which in turn will affect the ability of the sediments to cope with continued enrichment.
IX
I
(NB. Species denoted by * are less significant individually for defining stage but are useful in combination with others)
Fig.5.3.8.2. Indicator genera (or higher taxonomic groups) characterising impact/recovery stages and main functional identity of stages at Creeses Mistake.
Although farm-personnel may not be able to identify all of the faunal changes associated with the varying levels of impact, there were many changes in the community structure and abundance levels of particular key species that could be characterised relatively easily and which would provide an adequate understanding of the overall sediment condition (Fig. 5.3.8.3).
54
DEGRADING (Active)
IMPACTED
UNIMPACTED
UNIMPACTED
Aquafin CRC Project 4.1 – Final Report
RECOVERING (Passive)
I
II
III
MINOR
MODERATE
IV MAJOR
V
VI VII MAJOR
VIII
IX
MODERATE
MINOR
Presence of Tanaid and/or Ampeliscid amphipods; Total species >30; Total abundance2
Total species >30; Total abundance 2
Polychaetes dominant (x2 ref, >5,000/m2); Total species 10; Total abundance >5,000/m2; Shannon index=1-2
Polychaetes highly dominant (x3 ref or>10,0000/m2); Species no’s 30; Total abundance2
Presence of Tanaid and/or Ampeliscid amphipods; Total species >30; Total abundance2
Cage Stocked
I
Fig. 5.3.8.3. Community features characterising impact/recovery stages at Creeses Mistake.
Two species were particularly significant in the unimpacted communities, Ampelisca and Apseudes. These species were present at recovered farm sites, and there were marked differences in abundance between recovered and reference samples. Unimpacted sediments generally contained more than 450 and 700 individuals /m2 of Ampelisca and Apseudes respectively. When sediment was impacted Ampelisca was entirely absent and only 1-2 individuals of Apseudes were noted. Consequently, the presence of between 150-300 individuals /m2 of Apseudes is considered indicative of recovery to at least a farm level. The presence of more than just one or two Ampelisca would indicate a high level of recovery. These species are quite large and distinctive and would be easy to distinguish even by a non-skilled ecologist, particularly when present in abundance. Phoxocephalids, another crustacean group, were also notably more abundant in the samples from recovered positions than at either the impacted or reference positions. The reference sites at Creeses recorded between 35-50 species, where there was a major impact this was reduced to 10-15 species. Consequently where 20,000 individuals/m2. Consequently at Creeses Mistake total abundance less than 1,500/m2 suggests that conditions are acceptable. Abundance greater than 5,000/m2 would suggest a moderate impact and more than 20,000 individuals /m2 would indicate a major impact (Fig. 5.3.8.3).
55
Aquafin CRC Project 4.1 – Final Report
Total abundance and number of species can be combined to calculate the Shannon diversity index (Shannon and Weaver, 1963). This index is often applied to evaluate environmental condition. Low index values indicate poor environmental quality and high values represent relatively healthy sediments. In the present study Shannon index values greater than 2 were consistent with unimpacted sediments or conditions with very minor impacts, values between 1-2 indicated a moderate impact whilst Shannon values less than 1 were generally associated with significantly impacted sediments (Fig. 5.3.8.3). Although calculation of the Shannon index is reliant on determination of total number of individuals and species in a sample, it is not necessary to be absolutely exact in evaluating these parameters. This index and the definition of impact stage are quite robust to variation in both total abundance and number of species, the magnitude of the change involved is such that an estimate of abundance for large samples will not adversely affect the outcome. Both benthic photo scores and video assessment show particular promise as farm based assessment options. The key features underpinning the scores reflect the faunal differences indicated above and therefore can be used to characterise the impact/recovery stages (Fig. 5.3.8.4). Although many of the key features were consistent between the two study sites there were some differences particular to Creeses Mistake. Bacterial mats (Beggiatoa spp.) are considered a very significant indicator of deteriorated environmental conditions (GESAMP, 1996), but even although the community information suggested that conditions were appreciably degraded there was little evidence of bacterial mats at Creeses Mistake. In contrast algae was a feature at the references/recovered sites and appeared to be a good indicator of recovery. Other features unique to Creeses Mistake included the presence of echiurans and large annelids which appeared to be good indicators of unimpacted/recovered conditions. Sea slugs were only present when impact was moderate, they were not observed in unimpacted conditions or when a major impact had occurred. Consequently in temporal monitoring of recovery the point at which sea slugs are displaced may indicate an appreciable improvement in sediment condition. Most of these changes in community structure and the video/photo features are easy to discern and farm personnel could be trained to perform this.
56
I
II
III
MINOR
MODERATE
IV MAJOR
V
VI
UNIMPACTED Photo score - positive Video score >5 (Algae/Echiurans/Sipunculans)
Not encountered in this study - However, Photo score 75% fish cage-derived organic C, a semienriched zone (> 10 m from the cage) was characterized by 60% and a lightly enriched zone (> 60 m) by 40%. Note that feeding efficiencies have improved considerably since this early work and thus the amounts found today should be much less. The paper by Henderson et al. (1997) appears to be the only other study that has used organic lipid biomarkers to assess organic matter sources under salmon cages. Their data clearly showed that the lipid composition of sediments underlying marine fish cages in a Scottish sealoch was influenced by the waste material from the cages. Sediments were taken at regular intervals along a transect line perpendicular to the line of cages and extending 50 m on either side. Triacylglycerols, the main lipid class in the feed pellets, were present in sediments in highest concentration (0.44 mg g-1 sediment), while free fatty acids, sterols and polar lipids were also detected. The lipid content of the surface layer of sediment (0−5 mm) directly under the cages was very high (2 mg g-1 sediment) and substantially higher than that found in the deeper layers of sediment. The lipid content of surface sediments declined markedly with the distance from the cages; at 50 m from the cage the lipid content was only 0.4 mg g-1 sediment. The concentration of individual lipid classes in sediments decreased with distance from the cages and generally mirrored the changes in the total lipid content. A more recent study of sediments beneath a well established fish farm in the Ligurian Sea (Western Mediterranean) examined the “biopolymeric carbon (BPC) fraction” of organic matter and phytopigment concentrations which both displayed very high values beneath the fish cages (Vezzulli et al., 2002). Lipid, carbohydrate and chlorophyll-a concentrations were higher in the farm sediment than at a control, whereas protein concentrations did not show significant change between farm sediment and control. These authors suggested that that the biochemical composition of sedimentary organic matter as well as selected microbial variables could provide useful tools for evaluating the effects of organic enrichment in sediments due to fish farming. 5.4.7 Non-saponifiable lipids from reference sites, in-between cage sites and under cages Some 50 fatty acids and 24 sterols were identified and quantified for approximately 85 sediment samples. Amounts are expressed in µg g-1 of dry sediment or as percentages of the total lipids in that fraction. Sediments were collected at various intervals over a 26 month period covering two stocking and fallowing cycles. Illustrative capillary gas chromatograms showing the distributions of non-saponifiable (neutral) lipids at a reference site and at 0, 9 and 13 months for cage site 5 are shown in Fig. 5.4.8.1. and 5.4.8.2. Comparable data for the total fatty acids at the cage site are shown in Fig 5.4.8.3 and Fig. 5.4.8.4. The chromatograms for the neutral lipids (Figs. 5.4.8.1 and 5.4.8.2) show a diversity of lipid constituents including phytol (side-chain of chlorophyll a), a complex mixture of sterols indicative of mixed algal and faunal inputs, plus smaller amounts of other compounds. General features of the distributions are discussed here, and a more detailed examination of amounts of selected biomarkers (phytol, cholesterol, α-tocopherol, desmosterol, sitosterol) are discussed separately in following sections.
72
Aquafin CRC Project 4.1 – Final Report
Biomarker contents in reference sediments were quite low and more variable than at the Stringers site. All sediments contained similar amounts of phytol indicating comparable inputs of phytoplankton-derived chlorophyll a. Indicators of terrestrial organic matter of higher plant origin such as long-chain even-carbon-number n-alkanols and the C29 sterol 24-ethylcholesterol (sitosterol) were relatively minor constituents in marked contrast to the Stringers site. The sterol distributions were dominated by cholesterol of mainly animal origin plus sterols derived from a diversity of algal groups with significant inputs from diatoms (as shown by the high abundance of 24-methylcholesta-5,22E-dien-3β-ol) and dinoflagellates (high abundance of dinosterol: 4α,23,24-trimethyl-5α-cholest-22E-en-3β-ol). These distributions can thus be used as a baseline for comparison with sediments that receive additional inputs of organic matter from farming activities. Biomarker contents in the sediments at the Creeses cages were about 50% less than those found at Stringers. For example, cholesterol in cage sediments at Stringers reached levels of 150 µg g-1 or more at both cages P1 and P2, but at the Creeses cage sites the total content of cholesterol never exceeded 60 µg g-1. Fatty acids at the beginning of stocking at cage 5 were very similar to those at the reference (Fig. 5.4.8.3), but were dominated by fatty acids from the feed at 9 months (Fig. 5.4.8.4.). Total fatty acid amounts had diminished by the end of 4 months fallowing, but the distribution still resembled that found in the feed. Fatty acids are more labile that sterols and thus their distributions should more quickly approach those of the reference sediments on fallowing.
73
20
Aquafin CRC Project 4.1 – Final Report
15
Off-scale
Reference site t=0 Creeses Total saponified neutrals
10
IS
Cholesterol C28∆5,22 C29∆5
5
Volts (nV)
Phytol
0
Dinosterol
10
20
30
40
50
Cage site 5 t=0 Creeses Total saponified neutrals
Chol
20
Phytol IS
C27∆0 Vit E
10
Volts (nV)
30
40
Time (min)
C29∆5
0
Desmos
10
20
30
40
50
Time (min) Fig. 5.4.8.1. Capillary gas chromatograms for total neutral lipids in sediments at a) reference site and b) cage 5 at the beginning of stocking (0 months). Biomarker contents are higher at the cage site and compounds indicative of past farming (vitamin E, desmosterol) are also present.
74
150
Aquafin CRC Project 4.1 – Final Report
100
Cholesterol
Desmosterol
50
Volts (nV)
Cage site 5 T=9 Creeses Total saponified neutrals
0
C29∆5
10
20
30
40
50
60
70
Cage site 5 T=13 Creeses Total saponified neutrals
Off-scale
Cholesterol
C27∆0
20
C29∆5 IS
0
10
Volts (nV)
30
40
Time (min)
10
20
30
40
50
Time (min) Fig. 5.4.8.2. Capillary gas chromatograms for total neutral lipids in sediments at cage 5 a) at the end of stocking (9 months) and b) after 3 months fallowing (12 months). Compounds indicative of past farming (vitamin E, desmosterol) are still present at 13 months.
75
30
Aquafin CRC Project 4.1 – Final Report
Reference; T=0 Creeses Total Fatty Acids IS
10
16:0
20:5
0
Volts (nV)
20
16:1
10
15
20
25
30
35
40
45
Cage site 5; T=0 Creeses Total Fatty Acids
16:1
IS
20
18:0
20:5 14:0
0
10
Volts (nV (nV))
30
40
Time (min)
10
15
20
25
30
35
40
45
Time (min) Fig. 5.4.8.3. Capillary gas chromatograms for total fatty acids after saponification (analysed as methyl esters) in sediments at a) reference site and at b) cage 5 at the beginning of stocking (0 months).
76
200
Cage site 5; T=9 Creeses Total Fatty Acids 16:0 14:0
16:1
20:5
100
Volts (nV)
300
Aquafin CRC Project 4.1 – Final Report
18:0
IS
0
22:6
10
15
20
25
30
35
40
45
Time (min)
16:1
20
Volts (nV)
40
Cage site 5; T=13 Creeses Total Fatty Acids
IS
16:0
14:0 18:1
20:5
0
22:6
10
15
20
25
30
35
40
45
Time (min) Fig. 5.4.8.4. Capillary gas chromatograms for total fatty acids after saponification (analysed as methyl esters) in sediments at cage 5 at the end of stocking (9 months) and after fallowing (13 months). Fatty acids typical of feed dominate the distribution, superimposed on fatty acids of natural bacterial and microalgal origin.
77
Aquafin CRC Project 4.1 – Final Report
A key difference was found in the lipid distributions in sediments from cages 5 and 8 sampled at the same time. In particular, peak concentrations for most biomarkers occur at the end of stocking at cage 5, but at 4.5 months for cage 8. This almost certainly reflects the different stocking histories of the two cages. Fish were removed from cage 8 for two weeks prior to the scheduled end of stocking and then replaced. This two-week hiatus led to a dramatic reduction in the contents of most lipids in the sediments testifying to the value of fallowing and to the sensitivity of lipid contents to changes in stocking and sediment condition. Given this unfortunate break in our study, we have chosen to concentrate on data from cage 5 which follows a more expected cycle of concentration changes. 5.4.7.1 Temporal changes in specific biomarkers 5.4.7.1.1 Phytol Abundances
Phytol is the side-chain of chlorophyll a and thus its presence in sediments indicates a contribution from phytoplankton-derived organic matter to the sediments. It is not persistent in sediments and is broken down to a range of degradation products (Rontani and Volkman, 2003). Phytol was present in both reference sites at all sampling times. The amounts were generally low, with most falling in the range 1−3.5 µg g-1 (Fig. 5.4.8.1.1.1). Phytol contents were comparable at both reference sites and showed similar variability over time suggesting inputs from phytoplankton blooms in the warmer months. Contents at the cage sites were within the same ranges and also varied throughout the year implying a response to system-wide events rather than any particular influence of the farm operations. Creeses Phytol
Creeses Phytol f al l owed
stocked
stocked
f al l owed
4.00
amount ug/g dry
stocked
Ref1
3.00
Cage 5
2.00 1.00 0.00 0. 0
summer
4. 5
9. 0
13. 0
wi nter summer
17. 5
22. 0
wi nter
23. 0
24. 0
25. 0
ref2 cage 8
2.00 1.00 0.00 0.0
4.5
winter
9.0
13.0
summer
19.0
winter
23.0
24.0
25.0
26.0
summer
Months
M o nt hs
a)
fallowed
3.00
summer
summer
fallowed stocked
4.00
b)
Fig. 5.4.8.1.1.1. Changes in the abundance of total phytol (after saponification) in sediments at the Creeses site. Phytol is an indirect measure of chlorophyll from microalgae.
5.4.7.1.2 Fatty acids in sediments
At reference sites, the distribution of fatty acids was dominated by 16:0, 16:1, 20:4(n-6) and 20:5(n-3) which is typical of distributions dominated by diatom inputs. Bacterial fatty acids were not particularly abundant (Fig. 5.4.8.1.2.1). The PUFA 22:6(n-3) was not abundant at reference sites reflecting the smaller contribution from animal lipids. In contrast, polyunsaturated fatty acids (PUFA) including 22:6(n-3) were particularly abundant in sediments at the cage-sites due to contributions from animals, uneaten feed and faecal matter (Fig. 5.4.8.1.2.1). Total amounts increased during stocking to 30−35 µg g-1 and then declined to near-background levels after 4 months fallowing (Fig. 5.4.8.1.2.1). PUFA are very labile compounds and thus the changes in their amounts gives an indication of build-up and degradation of labile organic matter in the sediments. These data suggest a faster recovery of sediments at Creeses than at the Stringers site.
78
Aquafin CRC Project 4.1 – Final Report
Creeses PUFA
Creeses PUFA
fallowed stocked fallowed
Ref 1
20.0
Cage 5
wintersummer winter
25
24
23
.5
22
13
17
5
summer
9
0
0.0
amount ug/g dry
stocked
40.0
4.
Amount ug/g dry
stocked
fallowed
fallowed
stocked
40.00
Ref 2
30.00
Cage 8
20.00 10.00 0.00 0
summer
summer
4.5
9
winter
summer
13
19
23
24
winter
25
26
summer
Months
Months
a) b) Fig. 5.4.8.1.2.1. Changes in the abundance of total polyunsaturated fatty acids (PUFA) (after saponification) in sediments at the Creeses site.
5.4.7.1.3 Bacterial fatty acids
The content of bacterial fatty acids (iso-and anteiso-branched fatty acids plus 15:0 and 17:0 saturated fatty acids and 18:1(n-7) monounsaturated fatty acid) increased in sediments at the cage sites during the stocking cycle. However, on fallowing these amounts quickly fell to values typical of the reference sediments (Fig. 5.4.8.1.3.1). Creeses Bact FA fallowed
stocked
Creeses Bact FA stocked
fallowed
40.00 Ref 1
30.00
Cage 5
20.00 10.00 0.00 0 summer
4.5 9 13 winter summer
17.5 winter
22
23 summer
24
amount ug/g dry
Amount ug/g dry
stocked
fallowed
stocked
25.00
Ref 2
20.00
Cage 8
15.00 10.00 5.00 0.00 0
25
fallowed
30.00
summer
4.5
9
winter
summer
13
19
23
winter
24
25
26
summer
Months
Months
a) b) Fig. 5.4.8.1.3.1. Changes in the abundance of bacterial fatty acids (after saponification) in sediments at the Creeses site.
5.4.7.1.4 Cholesterol in sediments
Cholesterol is the major sterol in most marine animals (including fish) and it is also the major sterol in salmon feed and faeces. Cholesterol contents were low in sediments at both reference sites, but showed major increases during the stocking period followed by a gradual fall as sediments were fallowed (Fig. 5.4.8.1.4.1). At no point did the sediment cholesterol contents at either site fall to values typical of the reference sites. Indeed, even at 0 months, cholesterol levels were elevated reflecting a residual effect due to previous stocking at this site. Creeses Cholesterol stocked
f al l owed
stocked
Creeses Cholesterol
f al l owed
stocked
50.00
Ref1
40.00
Cage5
30.00 20.00
f al l owed stocked
f al l owed
80.00
Ref 2
60.00
Cage8
40.00 20.00
10.00 0.00
0.00 0
summer
4. 5
9
13
wi nter summer
17. 5
22
wi nter
M o nt hs
23
24
summer
25
0
summer
4. 5
9
13
wi nter summer
19
23
wi nter
24
25
26
summer
M o nt hs
a) b) Fig. 5.4.8.1.4.1. Changes in content of cholesterol in sediments at the Creeses site. Note the strong build-up during stocking and slow reduction during fallowing.
5.4.7.1.5 Desmosterol
Desmosterol is an intermediate in cholesterol biosynthesis but it is rare to find significant amounts in sediments or in marine animals. Indeed, only trace amounts were detected at the two reference sites. There was a clear build-up of desmosterol contents in sediments at the cage-sites during stocking and a gradual reduction to near-background levels with fallowing 79
Aquafin CRC Project 4.1 – Final Report
(Fig. 5.4.8.1.5.1). Our work at the Stringers site showed that desmosterol is contributed by capitellid worms and a good correlation can be found between capitellid numbers and desmosterol content in the sediment (data from both sites combined). The maximum desmosterol levels are lower than those at Stringers (10−16 µg g-1 at Creeses compared with 20−50 µg g-1 at Stringers during the first cycle) reflecting the lower densities of Capitella at Creeses. Creeses Desm osterol
Creeses Desmosterol amount ug/g dry
stocked
stocked f al l owed stocked
fallowed
20.0
Ref 1
15.0
Cage 5
10.0 5.0 0.0 0
4.5
summer
9
winter
13
17.5
22
summer winter
23
24
amount ug/g dry
fallowed
stocked
f al l owed
Ref 2
20.0
Cage 8
10.0 0.0 0
25
4. 5
9
13
19
23
wi nter summerwi nter
summer
summer
24
25
26
summer
Months
Months
b) a) Fig. 5.4.8.1.5.1. Changes in the abundance of the sterol desmosterol in sediments at the Creeses site. In this environment, desmosterol is a marker for capitellid worms.
5.4.7.1.6 Vitamin E (α-tocopherol).
Vitamin E is added to the fish feed and small amounts are found in the salmon faecal material. It is also produced naturally by phytoplankton and so minor amounts are found at the reference sites. The vitamin E contents in cage-site sediments at Creeses are much greater than at the reference sites (Fig. 5.4.8.1.6.1), but nonetheless are much lower than those observed at the cage-sites at Stringers: the maximum content seen at Creeses is 5 µg g-1, but at Stringers levels remained at around 35 µg g-1. Although contents at the Creeses cage-sites were up to 5 times those at the reference sites during stocking, there was a recovery of Vitamin E levels to values approximating those at the reference sites after fallowing. This behaviour contrasts with the Stringers site where vitamin E levels remained high even after many months of fallowing. Creeses Vit E Amount ug/g dry
stocked
fallowed stocked
Creeses Vit E
fallowed
stocked
4
Ref1
3
Cage 5
f al l owed
stocked
f al l owed
Ref2
6
Cage 8
4
2
2
1
0
0 0 summer
4.5 winter
9
13 summer
17.5
22
winter
23
24
25
summer
Months
0 summer
4.5 wi nter
9
13 summer
19 23 24 25 wi nter summer
26
M o nt hs
a) b) Fig. 5.4.8.1.6.1. Changes in the abundance of vitamin E (α-tocopherol) in sediments at the Creeses site. Vitamin E is added to the feed and thus is a marker for fish feed and faeces in this environment.
5.4.7.1.7 Sitosterol (24-ethylcholesterol)
The C29 sterol sitosterol is the major sterol in most higher plants and thus it is often used as a biomarker for plant input to coastal sediments. Amounts at the reference sites were quite low consistent with the predominance of marine-derived organic matter at this site. However at the cage sites the contents of sitosterol showed a significant increase with stocking followed by a reduction on fallowing (Fig. 5.4.8.1.7.1). Sitosterol is 6 % of the sterols in the feed and 13.6 % of the sterols in fish faeces. In this environment, sitosterol thus appears to be a good indicator of feed and/or faeces from farming operations. Indeed, there is a strong correlation with cholesterol when comparing the two plots: the profile of both biomarkers over the 2-year cycle
80
Aquafin CRC Project 4.1 – Final Report
is almost identical. Sitosterol content decreased significantly during fallowing suggesting that there is limited long-term accumulation of waste feed at this site. Creeses Sitosterol
Creeses Sitosterol fallowed
stocked
stocked
fallowed
6.00 5.00
Ref1
4.00
Cage 5
3.00 2.00 1.00 0.00 0.0
4.5
summer
winter
9.0
13.0
summer
17.5
22.0
winter
23.0
24.0
amount ug/g dry
amount ug/g dry
stocked
fallowed
8.00
ref2
6.00
cage 8
4.00 2.00 0.00
25.0
0.0
summer
summer
fallowed stocked
10.00
Months
4.5
winter
9.0
13.0
summer
19.0
23.0
winter
24.0
25.0
26.0
summer
Months
a) b) Fig. 5.4.8.1.7.1. Content of the C29 sterol sitosterol (24-ethylcholesterol) in sediments at the Creeses site. Sitosterol is found in higher plants and in some microalgae. Here it is mostly contributed from uneaten feed.
5.4.7.1.8 Comparison of sediments directly under and adjacent to cages.
An opportunity was presented at 13 months to sample sediments at the cage 8 site from both the centre of the cage and at the edge. Contents were 2-3 times higher in the centre than at the edge of the cage. Even after fallowing for 3 months, biomarker contents in sediments from the centre site were 2 to 3 times those obtained from the edge of cage (Fig. 5.4.8.1.8.1). In fact cholesterol levels were 50 % higher at the centre cage position after fallowing (13 months) than at the edge of the cage at 9 months after stocking. Thus the impacts measured at the edge of the cage will be less that those in sediments directly beneath the cages.
ref 2a 8 edge
fa Pu
s to Si
Vi
tE
8 mid
D es
Ph yt C ol ho le st er ol
Amount ug/g
Creese T=13 Cage 8 80.00 70.00 60.00 50.00 40.00 30.00 20.00 10.00 0.00
Biomarker
Fig. 5.4.8.1.8.1. Comparison of lipid contents in sediments collected from the original centre point of cage 8 with values found in sediments from the regular sampling position. The site had been fallow for 3.5 months by this stage.
5.4.8 Sedimentation In production cycle 1, sedimentation rates were generally higher at the cage than at the reference positions. There was a significant interaction between site (cage / reference) and time (F5,22=20.584; p=0.000). Pairwise comparisons showed that the cage sedimentation rate was significantly higher than the reference while the cage was stocked (up to and including 9 months) but not when the cage was empty (10, 11 months) (Fig.5.4.9.1a). The sedimentation rate at the cage again increased at the end of three months fallow (13 months). This may have been caused by preparation of the cage positions for restocking, i.e. replacing predator and cage nets.
81
Aquafin CRC Project 4.1 – Final Report
Sedimentation Rate (g/m /d)
40
2
fallow stocked
c
20
a
a
a b
bc
c
b
bc
winter
ad
a ab
ab
20
ab
b
b b
b
8.5
9
10
Time (months)
11
summer
13
bb
b
b
14
15
16
17.5
winter
B)
b
ab
b
ab
b
19
21
22
23
24.5
25.5
summer
Time (months)
26.5
60 2
Sedimentation Rate (g/m /d)
2
a a
c c
60
Sedimentation Rate (g/m /d)
d
fallow stocked
40
0
6.5
Farm Ref 40
c
20
a
b
ab
a
ab
ab
ab
farm ref
40
c
ab
20
a
a a
a
b b
a
0
ab
a a
a
ab ab a
ab a
ab a
0 6.5
C)
Cage Ref
b
0
A)
c
60
Cage Ref
2
Sedimentation Rate (g/m /d)
60
winter
8.5
9
10
Time (months)
11
summer
13
14
D)
15
16
17.5
21
winter Time (months)
22
23
25.5
summer
Fig.5.4.9.1. Sedimentation rates recorded at A) Cage and Reference in production cycle 1, B) Cage and Reference in production cycle 2, C) Farm and Reference in production cycle 1 and D) Farm and Reference in production cycle 2.
In production cycle 2, sedimentation rates showed a seasonal trend, with little difference between the cage and reference rates at most times. There was, however, a significant interaction between site and time (F11,21=62.379; p=0.000). The cage sedimentation rate was significantly higher than the reference at both the start (14 months) and end of stocking (23 months) (Fig.5.4.9.1b). Sedimentation rates remained significantly higher at the cage than the reference during the fallow period (23 to 26.5 months), this may be a result of farming activities such as cleaning of cage fouling, or feed/faecal material from adjacent operational cages. The effect of adjacent cages was assessed by placing a sediment trap in between two adjacent cages, at a “farm site”. In the first production cycle there was a significant interaction between site (farm and reference) and time (F5,22=10.064; p=0.000). Sedimentation rate at the farm site was variable, only occasionally were rates higher than at the reference and this was probably dependent on the level of feeding activity, stocking density and biomass of the adjacent cages (Fig.5.4.9.1c). There was no significant difference in sedimentation rates at farm and reference during the fallow period. In the second production cycle, farm sedimentation rates were again variable, but often similar to the reference (Fig.5.4.9.1d). There was a significant interaction between site and time (F8,16=13.502; p=0.000). As was the case with the cage sedimentation data, the farm sedimentation rate was significantly higher than the reference during the fallow period, suggesting that in the second cycle there was a broader farm-wide increase in sedimentation. 5.4.9 Sediment Metals During the second production cycle at Creeses Mistake, copper treated antifouling nets were deployed at the study cages. As a result, copper concentration was measured in a selection of 82
Aquafin CRC Project 4.1 – Final Report
Creeses Mistake sediments (cage and reference), and a feed sample, to determine if the treated nets were affecting copper levels in the sediments. The data show that Cu has been transported to the sediments following the introduction of the antifouled nets. The copper concentration in sediments at the cages increased markedly after the deployment of the treated nets (approximately 13-14 months) and was significantly higher than the reference positions (2-Factor ANOVA, F2,18=8.586, p=0.009) (Fig. 5.4.10.1).
Cu (mg/kgDMB)
120
100
P5 P8 R1 R2 Feed
80
fallow stocked
60
40
20
0 0 Feb 01
5
10 Dec 01
15
Time (months)
20 Oct 02
25
Fig.5.4.10.1. Copper concentration in sediment at Creeses Mistake between February 2001 and April 2003. Concentration in feed sample from November 2001 is included for comparison.
At 22 months (cage 5) and 23.5 months (cage 8) the fish were harvested from the study cages. The Cu level declined at cage 8 between 23.5 and 26.5 months, probably in response to the cage/net being removed. There was no decline in Cu level between 22 and 26.5 months at cage 5. We know that the fish were removed at 22 and 23.5 months but we have no information as to whether the net was also removed at this time. The prime cause of the increase in the sediments is likely to be particulate matter, either as pieces of the antifoulant coating coming off the nets or as a result of fouling material absorbing Cu before being sloughed off the nets, rather than leaching of Cu into the water column. The Cu levels around the cages were highly variable suggesting a patchy effect, which supports the hypothesis that the increase is a result of localized deposition of material. Although sediment Cu levels were variable, increased sediment concentrations were evident from the time that the treated nets were deployed. Since the samples for analysis were obtained using remote sampling techniques from study sites in depths between 20-25 m and using individual cores collected adjacent to (not directly under) operational cages, the detection of a significant increase using this sampling regime, and at the replication level employed, indicates that the effect is widespread. ANZECC interim sediment quality guidelines (ISQG) for copper in aquatic ecosystems identify levels up to 65 mg/kg as low and levels above 270 mg/kg as high. Although the mean Cu levels from this study generally fell within the lower range for these guidelines, on occasion higher levels were recorded (one replicate from pen 5 contained a level of 109 mg/kg) and in relation to toxicity the maximum level encountered can be far more important than the mean. Table 5.4.10.1 shows several recommended standards for sedimentary copper. The guidelines in Florida and for SEPA suggest that at the highest levels recorded in the present study there might be an adverse environmental effect. 83
Aquafin CRC Project 4.1 – Final Report
Metals are generally not biodegradable: the only way to reduce levels in specific areas or avoid accumulation is by removal/dispersal by natural environmental mechanisms. These mechanisms can be either biological (i.e. bioturbation/ resuspension) or hydrological (resuspension). If Cu is accumulating in the sediments, the levels could rapidly approach high levels (ISQG) and this would have biological and ecological consequences. Most of the literature on the effects of Cu on the biota has focused on levels in the ambient seawater with little information on the effects on sediment organisms. Brooks and Mahnken (2003) reviewed much of the information regarding the effects of Cu antifoulants in relation to salmon farming. Lu and Chen (1977) found that the release of Cu was significantly more pronounced in oxidizing than reducing environments and was slightly more pronounced in coarser sediments. Di Toro et al., (1992) showed that the reactive pool of acid volatile sulphide in sediment can bind metals rendering them biologically unavailable. Consequently Cu accumulated in fine, anaerobic sediments is less likely to be biologically available/toxic than equivalent levels in coarser aerobic, sediments (such as those at Creeses Mistake). The toxicity of Cu is a function of its speciation (EPA, 1984). The data presented here are for total Cu, not EDTA-extractable Cu. In organically rich environments Cu may bind with organic ligands and therefore be biologically unavailable (Harrison et al., 1987). However, there is a lack of information on the relative toxicity of different Cu species/complexes. Brooks and Mahnken (2003) in a case study on the effects of Cu based antifouling paint in British Columbia showed no significant difference between treatments; the mean at unfarmed reference sites was 12.0 mg/kg (n=10, 95% confidence limit =4.3), at farm sites not using Cu antifoulant was 26.3 mg/kg (n=39, 95% confidence limit = 2.8), whilst at farm sites using Cu antifoulant the mean was 48.2 mg/kg (n=117, 95% confidence limit = 27.0). However, there was substantial variability in the results where Cu antifoulants were used and several sites exceeded the local government screening levels. Those sites which exceeded the standards were where the waste water from netwashing was commonly discharged into the environment (Brooks and Mahnken, 2003). Similar findings were reported in a study of Scottish farms by Solberg et al. (2002). Table 5.4.10.1. Recommended standards for sedimentary copper concentration. Abbreviations indicate Threshold Effects Level (TEL), Probable Effects Level (PEL), Effects Range Low (ER-L) and Effects Range Median (ERM). Sediment Quality Criteria Standard Copper (mg/kg) Washington
Apparent Effects Threshold
Florida
(TEL+PEL)/2
Scottish Environmental Protection Agency
390 63.35
(ER-L+ER-M)/2
152
Background Concentration
16
“Possible” Adverse Effects Level
35
“Probable” Adverse Effects Level
390
Compared with similar farming sites elsewhere in Tasmania, Creeses Mistake is in a relatively dynamic location with at least 10 m of water between the cage bottom and the sediments. Consequently, the magnitude of the increase in sediment Cu is quite surprising. If anti-foulant material has been flaking off the cages then low level increases directly at the cages might be expected, and perhaps broader scale increases in the local system would be apparent over the 84
Aquafin CRC Project 4.1 – Final Report
longer term. The results indicate that the levels in some sediments at the cages have increased rapidly, but so far the reference positions (150 m from the cages) have shown no evidence of Cu accumulation. 5.4.10 Summary Deposition of faeces and excess feed to the sediments will increase the organic content (Hall et al., 1990, Holmer, 1991) and therefore evaluation of organic content should reflect the degree of impact. There are numerous ways in which organic matter can be measured. Several studies have shown that input of organic matter results in changes in the sediment particle size (Hall et al,. 1990, Holmer, 1991). However, this was not found to be the case at either location in the current study. Measurement of total organic matter (TOM) has also been used to identify different levels of organic enrichment but in this study TOM results did not correlate with either the farm production information or any of the other measures of environmental impact. It has been reported that this method is significantly influenced by the presence of shell and other refractory carbonates, although efforts were made to compensate for this by acidification of the samples, it is possible that the basic nature of the sediments compromised these results. However, it is clear that TOM is not sufficiently reliable to be considered as a useful approach for farm-based monitoring. Measurement of physico-chemical parameters, such as redox and sulphide, has been applied as an indicator of sediment condition in many monitoring programmes worldwide. Redox has been included in the regulatory standards required for fish farm monitoring in Scotland, Canada, the U.S. and locally in Tasmania. Both sulphide and redox concentration showed a measurable response to farming activities, indicating a deterioration in environmental conditions throughout the farm production phase followed by an improvement in conditions when production ceased. The present study found that both redox and sulphide were more useful as measures of sediment degradation than recovery. Sulphide on its own was a particularly poor indicator of recovery. This is presumably because degrading conditions are associated with the continuous active input of organic material whereas recovery is a passive process. In New Brunswick, Canada it has been recommended that redox and sulphide be evaluated in combination (Wildish et al. 1999). Our findings indicate that sulphide is extremely unstable and degrades rapidly in recovering systems, such that the relationship identified in the study by Hargrave et al. (1997) does not persist. Several levels of effect could be discerned which compare reasonably well with the levels characterised by the benthic infaunal evaluation (Fig’s 5.3.8.2, 5.3.8.3 and 5.4.11.1). However, the boundaries were not as distinct, suggesting that redox potential and sulphide concentration were less sensitive than measures of community change.
85
DEGRADING (Active)
IMPACTED
RECOVERING (Passive)
UNIMPACTED
UNIMPACTED
Aquafin CRC Project 4.1 – Final Report
I
II
III
MINOR
MODERATE
IV MAJOR
V
VI VII MAJOR
VIII
IX
MODERATE
MINOR
Redox=0->100mV (or>50% ref); Sulphide below detection
Biological - Shannon index >2; Presence of Tanaid +/or Ampeliscid amphipods; Total abund50% ref); Sulphide below detection
Biological - Shannon index >2; Total abundance 50uM
Biological - Shannon index=1-2; Polychaetes dominant (x2 ref, >5,000/m2); Total abundance >5,000/m2
Redox100uM
Biological - Polychaetes highly dominant (x3 ref or>10,0000/m2); Species no’s 50% ref); Sulphide below detection
Biological - Shannon index >2; Total abundance100mV; Sulphide below detection
Biological - Shannon index >2; Presence of Tanaid and/or Ampeliscid amphipods; Total abundance10,000/m2; Patchy Beggiatoa/ outgassing on disturbance; Species no’s 5,000/m2) Indicator – Capitella, Nebalia Function – Deposit feeders
I
VIII VII
VI
STAGE
IV
III
General - No evidence of impact; unimpacted indicator species present Indicator – Site specific Function – Range of functions
II
Aquafin CRC Project 4.1 – Final Report
UNIMPACTED
Fig.7.1.1.2. General characterisation of impact/recovery stages based on main infaunal community, key faunal indicators and functional changes.
187
Aquafin CRC Project 4.1 – Final Report
This study assessed the benthic community information from both sites to determine whether any simplification of the data was possible or whether any generalisations could be made in regard to the infaunal results and the level of impact. The results show that when sediment conditions were degraded polychaete worms were the dominant faunal group, both in terms of abundance and diversity. In organically enriched sediments capitellid polychaetes (distinctive, red, opportunistic worms) can occur in huge numbers, and in this study these worms were strongly indicative of the moderate and major impact stages, III-VIII (Fig. 7.1.1.2). In impacted sediments the worms represent the greatest proportion of the fauna, and evaluation of total abundance effectively reflected these changes. Consequently a doubling in the number of organisms per sample compared with reference samples indicated a moderate impact (stage III), whilst an increase of threefold or greater was indicative of a major impact (stage V). Where there was a major impact species numbers were also generally reduced; a 50% or greater reduction in the number of species compared to the reference site or less than 10 species present (based on a 0.2m2 sample) suggested a significant impact (stage V). However, number of species by itself was a poor indicator of impact. For example if a farm sediment sample contained the same number or more species than an equivalent reference it did not necessarily mean that the sediment had recovered, since the mix of species might be quite different. In the initial stages of impact (or in recovery) diversity can increase, as the conditions have not yet deteriorated sufficiently to eliminate the stable species, and there are sufficient resources to encourage the establishment of opportunistic species (this is sometimes referred to as a zone of enhancement). There were also changes in some general faunal groups which could be related to the level of apparent impact. Most of these were species and site specific and are discussed in the next section. The results suggest that where crustacea are a dominant component of the reference community a significant drop in numbers should be considered carefully, particularly if also associated with an increase in abundance of worms. Change in the abundance of molluscs as a group was on the whole a fairly poor indicator of environmental condition. However, echinoderms appeared to be relatively sensitive to organic enrichment, particularly when this was associated with a decline in the oxic status of the sediments. Of the geochemical measures evaluated estimation of redox potential and sulphide concentration were the most useful for distinguishing between impacted and unimpacted sediments (Fig. 7.1.1.3). Redox has been included in the regulatory standards required for fish farm monitoring in Scotland, Canada, the U.S. and locally in Tasmania. However, assessment of both redox and sulphide were poor indicators of recovery, generally greatly overestimating the extent of recovery. Wildish et al. (2001) produced a model that defined four stages of impact in relation to redox potential and sulphide concentration. Comparison of the present data with the organic enrichment model proposed by Wildish et al. (2001) suggests that although redox levels defining the impact stages in the current study were comparable to those of the Canadian study, the local sulphide concentrations were greatly reduced. In the current study a major impact was suggested by sulphide levels more than 10 times lower than that indicated by Wildish et al. (2001). In New Brunswick, Canada the requirements for environmental monitoring of salmon farms require that redox and sulphide be evaluated in combination (Wildish et al., 1999) and certainly the results from this study indicate that measurement of both redox and sulphide concurrently would 188
Aquafin CRC Project 4.1 – Final Report
increase the reliability of the result. Redox appeared to be influenced by seasonal changes and both redox potential and sulphide concentration were variable in recovering sediments. Consequently it is recommended that redox and sulphide only be considered either as part of a reliable and frequent time series data set or in conjunction with other measures of sediment condition (e.g. faunal information or video assessment).
UNIMPACTED
DEGRADING (Active)
IMPACTED
Geochemical Measures
STAGE
Eh >100mV S= below detection
No Impact Minor
I Normal
Wildish et al.
Eh=0-100mV Eh=0-100mV or >50% ref. or 50uM S= below detection
II
Moderate
III Transitory
Eh = -ve S==>100uM
Major
IV
Not encountered in this study
Severe
V
Polluted
VI Grossly Polluted
Geochemical Measures: Eh = >100mV S= = 50uM
-4 to -3
5000/m2)
100uM
5
Algae, Echiurans/Sipunculans
Capitella (dominant); *Neanthes, *Phoxocephalidae, *Dimorphostylis
15,000/m2
0-100mV (or >50% ref)
>50uM
-4 to -3
2 *Polydora, *Euphilomedes, *Nephtys
50% ref)
Below detection
0 to -3
2.5-5
Point at which sea slugs are displaced (temporal)
194
Aquafin CRC Project 4.1 – Final Report
On the whole slightly more species were recorded from Creeses Mistake than Stringers Cove. The reference sites at Creeses recorded between 35-50 species and where there was a major impact this was reduced to 10-15 species (Table 7.1.2.1). At Stringers only 20-30 species were recorded from the reference sites and as with Creeses Mistake this declined to approximately 10 species at impacted sites. Consequently where 20,000 individuals/m2 and as at Stringers Cove this increase was mostly due to capitellid worms. Consequently at Creeses Mistake total abundance less than 1,500/m2 suggests that conditions are acceptable, although an abundance greater than 5,000/m2 would suggest a moderate impact and more than 20,000 individuals m-2 would indicate a major impact. The findings and scoring for the visual assessment techniques was similar between the two sites. The main differences were in the key fauna underpinning the scores, which for the most part reflected the species differences indicated above. At Creeses Mistake there was less evidence of bacterial (Beggiatoa) mats at impacted sites compared to Stringers Cove (Table 7.1.2.1). Alga was not a feature at Stringers Cove but was observed at the references/recovered sites at Creeses Mistake and was therefore a good indicator of recovery at this site. Similarly echiurans and large annelids appeared to be good indicators of unimpacted/recovered conditions at Creeses Mistake but did not occur at Stringers Cove. Sea slugs were only present when impact was moderate, they were not observed in unimpacted conditions or when a major impact had occurred. Consequently in temporal monitoring of recovery the point at which sea slugs are displaced may indicate an appreciable improvement in sediment condition. STRINGERS COVE: In contrast to the crustacean dominated community at Creeses Mistake, the unimpacted community at Stringers Cove was characterised by a diverse range of polychaete worms including several surface deposit feeders (Table 7.1.2.2). Impacted conditions were characterised by a significant increase in abundance of opportunistic capitellid worms and a scavenging epibenthic crustacean (Nebalia longicornis). N. longicornis is very distinctive and in combination with increased Capitellid abundance would be a very good indicator that sediments were markedly impacted (stages III-VIII). Any significant variations in crustacean abundance at Stringers tended to be associated with N. longicornis. However, this species is a swarming epibenthic deposit feeder and is both highly clumped in its distribution and very susceptible to sampling technique so it can be easily missed. Consequently its absence from samples is not as significant as its presence.
195
Aquafin CRC Project 4.1 – Final Report
Table 7.1.2.2. Characterisation of impact/recovery stages at Stringers Cove based on key features of each of the techniques deemed to be suitable for farm based assessment. Impact Stage
I
Effect Category
Description
No evidence of impact Small scale community change; Sediment chemistry unaffected or with only very minor effects
II
Minor effects
III
Significant community Moderate effects change; Sediment chemistry affected
IV
Major effects
Key Indicator Spp Generalised Benthic Categories (* use in combination with other species) Pristine indicator species present
Amphiura, Lysilla, *Mediomastus, *Nucula, *Thyasira
Larger, long lived species & pristine indicators absent. Diversity may be greater than pristine (zone of enhancement)
*Nassarius, *Corbula, *Echinocardium, *Phoxocephalidae, *Nemertea
Rapid change in community mix; deposit feeding polychaetes/opportunists dominate. Filter/suspension feeders absent.
Capitella, Nebalia (dominant); *Corbula, *Nassarius,*Neanthes
Major community change; Opportunists (esp. Capitellids) Monospecific dominance; characterise community (abund major sediment chemistry >5000/m2) changes Infaunal opportunists (esp Capitellids) dominate (abund >10,000/m2). Patchy beggiatoa/outgassing may be evident.
Major effects
As in Stage IV; Beggiatoa/outgassing on disturbance
VII
Major effects
Fauna returns to Opportunists (Capitellids) still monospecific dominance; dominate but no.s dropping & other major sediment chemistry species colonising. effects
VIII
Fauna re-establishing (zone of enhancement); Moderate effects Sediment chemistry still affected
V
IX
Minor effects
Community largely recovered; Sediment chemistry still slightly affected
Capitella, Nebalia (dominant); *Corbula, *Nassarius, *Neanthes
Capitella, Nebalia (extremely dominant)
Shannon Index
Redox Total Potential (mV) Abundance
Sulphide Conc. (uM)
Photo Video Score Score
Video Features
100mV
Below detection
Pos've >5
Brittlestars
>2
50% ref)
Below detection
0 to 2.5
2.5-5
Prevalence of burrow/faunal track/tubes; Brittlestars, squat lobsters, dog whelk
>15,000/m2
0-100mV (or >50% ref)
>50uM
-2.5 to 2
50% ref)
>50uM
0 to 2.5
50% ref)
Below detection