Academic Sciences
International Journal of Applied Pharmaceutics ISSN- 0975-7058
Vol 4, Issue 2, 2012
Research Article
DEVELOPMENT OF SUSTAINED RELEASE METFORMIN HYDROCHLORIDE TABLETS USING A NATURAL POLYSACCHARIDE B.SRAVANI1, R.DEVESWARAN*1, S.BHARATH1, B.V.BASAVARAJ1, V.MADHAVAN2 1Department
of Pharmaceutics, 2Department of Pharmacognosy, M. S. Ramaiah College of Pharmacy, M. S. R. Nagar, MSRIT Post, Bangalore 560054, India. Email:
[email protected] Received: 30 July2010, Revised and Accepted: 05 Oct 2010
ABSTRACT The objective of the present investigation was to search for an effective natural release retardant that can be used as an alternative source for synthetic excipients in tablet formulation. Tamarind seed polysaccharide (TSP) was isolated and the yield was found to be 76.66%. The microbiological studies confirmed that TSP does not support microbial growth. Sustained release tablets of Metformin hydrochloride were prepared using the isolated TSP. The release profile of the prepared tablets were compared with the formulations prepared with HPMC K 4M and a marketed product. The drug content of all the formulations ranged from 99.74 to 101 %. Formulation F7 showed release up to 11 h which was similar to the marketed product. The results indicated that a decrease in release rate of the drug was observed by increasing the polymer concentration. The release data when fitted into various kinetic equations revealed that the drug release was by matrix and Peppas model release with R2 values above 0.9. Stability studies of formulation F7 was carried out and was found to be stable with no change in physical appearance and minimal decrease in drug content. Thus, a stable, safe natural release retardant could be isolated from tamarind seed polysaccharide, which can be effectively used in tablet formulation. Keywords: Tamarind seed polysaccharide; Metformin hydrochloride; HPMC K 4M; Sustained release, Drug delivery.
INTRODUCTION Administration of drug by oral route is one of the important methods to impart systemic effects. Over the years research is going on for identification and utilisation biocompatible polymeric material from natural sources in development of oral sustained release dosage forms. Plant polysaccharide, has shown to be useful for the development of drug delivery systems for specific drug delivery1. Among hydrophilic polymers, polysaccharides which are relatively complex carbohydrates are the choice material due to their non toxicity. They provide good mechanical properties for applications as fibres, films, adhesives, rheology modifiers, hydrogels, emulsifiers and drug delivery agents2. Such polysaccharides are also called texture modifiers wherein they provide appropriate texture to the products3. Being natural they have certain drawbacks like purity, source and microbial contamination. If these factors can be identified and controlled, polysaccharides can be good substitute for synthetic polymer4. Tamarind seed polysaccharide (TSP) which is a glucosaminoglycan derivative extracted from the kernel of seeds of Tamarindus indica Linn. Family Leguminosae. It is a polymer that consists of cellulose type spine that carries xylose and galactoxylase substituents. The polysaccharide constitutes about 65% of the seed component and is neutral, hydrophilic polymer5. Tamarind seed polysaccharide possesses properties like high viscosity, broad pH tolerance, nanocarcinogenicity, mucoadhesive nature, and biocompatibility. It is used as stabilizer, thickener, gelling agent and binder in food and pharmaceutical industries6. It is a branched polysaccharide with a main chain of β-d-(1,4)- linked glucopyranosyl units, and that a side chain consisting of a single dxylopyranosil unit attached to every second, third, and fourth dglucopyrnosyl unit through an α-d-(1,6) linkage. One d galactopyranosyl unit attaches to one of the xylopyranosyl units through a β-d-(1, 2) linkage. The molecular weight of tamarind seed polysaccharide (TSP) is within the range of 2.5×10 5 to 6.5×10⁵. Metformin hydrochloride is 1, 1-dimethyl biguanide hydrochloride, which is white, crystalline; hygroscopic powder and used as an oral hypoglycaemic agent specifically for type-2 diabetes mellitus. It is given in divided doses of 0.5- 3g daily7,8. Metformin controls blood glucose levels in persons with type 2diabetes by reducing glucose production in the liver and increasing sensitivity to existing insulin. Metformin is slowly and incompletely absorbed from the gastrointestinal tract; the absolute bioavailability of a single 500 mg dose is 50 to 60% and
reduced when taken with food. The plasma elimination half-life is about 2 to 6 h after oral doses. Its pH is 6.68 and pKa is 12.49. The aim of present study is to design sustained release matrix tablet of Metformin hydrochloride using tamarind seed polysaccharide as release retardant. MATERIALS AND METHODS Materials Tamarind kernel powder was purchased from Sri Balaji industries, Bangalore. Metformin hydrochloride was purchased from Yarrow Chem Products, Mumbai. Dicalcium phosphate, magnesium stearate, and purified talc were purchased from S.D. Fine Chemicals, Mumbai, India. Absolute ethanol was purchased from Central Drug House, Mumbai. All other chemicals used were of analytical reagent grade. Isolation of TSP To 30 g of tamarind kernel powder, 200 ml of cold distilled water was added to prepare slurry. This slurry was added to 800 ml of boiling distilled water. The solution was boiled for 20 mins in a water bath with continuous stirring. The resulting clear thin solution was kept overnight. The solution was centrifuged at 5000 rpm for 20 mins to separate the foreign matter. The supernatant liquid was separated and poured into twice the volume of absolute ethanol by continuous stirring. The precipitate was collected using muslin cloth and was washed with absolute ethanol. The product was then dried at room temperature for 24 h 10. Evaluation of isolated TSP powder Phytochemical examination Preliminary tests were performed to confirm the presence of polysaccharide by ruthenium red test and Molisch’s test11. Micromeritic properties of TSP Isolated TSP powder was evaluated for bulk density, tap density, bulkiness, angle of repose, Hausner’s ratio and Carr’s index. Specific gravity of 1% solution A clean and dry empty specific gravity bottle was weighed then the bottle was completely filled with distilled water and weighed. After cleaning and drying, the bottle was completely filled with 1% TSP solution and weighed.
Deveswaran et al. Int J App Pharm, Vol 4, Issue 2, 2012, 23-29 Solubility studies
Determination of ash value
The solubility of TSP was checked using different solvents. 50 mg of TSP powder was dissolved in 5 ml of solvents like water, ethanol, acetone, methanol and ether.
Ash values like total ash, acid insoluble ash and water soluble ash was determined following the method reported in literature 14.
Determination of melting point Melting point was determined by a capillary tube in melting point apparatus. Loss on drying LOD was carried out as per the method mentioned in Indian Pharmacopoeia12. pH of 1% solution The pH of the 1% TSP solution was measured using a digital pH meter. Moisture content The moisture content of the powder was carried out by thermogravimetric method using IR moisture balance. Viscosity of 1% solution
Microbial content determination Total microbial content was determined by Streak plate (surface plating) method using agar plates. Compatibility studies FTIR studies: The pure drug, Metformin Hydrochloride and the physical mixture of pure drug with TSP powder, HPMC K 4M in the ratio 1:1 were subjected to IR spectral studies using FTIR spectrophotometer (FTIR 8400 S, Shimadzu, Japan) at the scanning range of 4000-400 cm-1. DSC studies: Metformin hydrochloride was mixed with the polymers and the DSC analysis of each sample was carried out under the temperature range of 0-300ºC, heating rate 10ºC/min, nitrogen atmosphere (20ml/min) and alumina as reference standard. DSC was performed for the samples metformin hydrochloride, TSP, HPMC K4M, pure drug with TSP (1:1) and pure drug with HPMC K4M (1:1). The apparatus was indium cyclohexane calibrated15. Formulation of matrix tablets
The viscosity of 1% solution was determined using Brookefield viscometer using spindle no.2 (Brookfield, LVDVIT) at 5,10,20,50 and 100 rpm. Determination of swelling index Swelling index was determined in water, 0.1N HCl and phosphate buffer pH 6.8. 1 g of TSP powder was introduced into a 25 ml glass stoppered measuring cylinder; 25 ml of solvent was added. The mixture was shaken thoroughly at every 10 min interval for 1 h and allowed to stand for 3 h at room temperature. The volume occupied by the material was measured13. Particle size analysis The particle size of TSP powder was determined using optical microscope (Olympus LITE image). A total of 100 particles were counted and the average particle size in micrometers was determined.
The tablets were prepared by wet granulation technique using varying concentrations of TSP and HPMC K 4M as a release retardant. To the TSP powder, dicalcium phosphate and Metformin hydrochloride (previously passed through sieve no. 80) were added and granulated using 5% PVP solution (previously dissolved in alcohol) as granulating agent. The wet mass was passed through sieve no. 12 and the granules obtained were dried at 45oC for 30 mins. The dried granules were subjected to dry screening by passing through mesh no. 16 superimposed on mesh no. 24 and then the granules were lubricated with the mixture of talc and magnesium stearate. The granules were compressed into tablets using 12 mm capsule shaped punch in rotary tablet press (Rimek RSB-4 minipress, Cadmach). A similar procedure was adopted to prepare Metformin hydrochloride tablets using HPMC K 4M as release retardant in two different ratio. Total 9 formulations were prepared using TSP and HPMC K 4M. The composition of tablet formulations is shown in table 1.
Table 1: Formulation of Metformin hydrochloride tablets Ingredients Metformin Hydrochloride TSP HPMC K 4M Dicalcium phosphate PVP solution (5%) Talc Magnesium stearate Total tablet weight
Formulation code (Quantity in mg) F1 F2 F3 F4 500 500 500 500
F5 500
F6 500
F7 500
F8 500
F9 500
50 --343 qs 5 2 900
250 --143 qs 5 2 900
300 --93 qs 5 2 900
350 --43 qs 5 2 900
--100 293 qs 5 2 900
--200 193 qs 5 2 900
100 --293 qs 5 2 900
150 --243 qs 5 2 900
Evaluation of tablets Pre compression studies of granules Various parameters like bulk density, tap density, angle of repose, Hausners ratio, Carr’s index, and bulkiness were determined. Post compression studies of the prepared formulations Test for weight variation, hardness, friability and thickness were determined for compressed tablets. Drug content determination Ten tablets of each formulation were powdered. Powder equivalent to 500 mg of Metformin hydrochloride was weighed and transferred to 100 ml volumetric flask, initially about 50 ml of phosphate buffer 6.8 was added and the flask was shaken thoroughly and the volume
200 --193 qs 5 2 900
was made up to 100 ml with the buffer solution. The resulting solution was filtered. From this 5 ml was taken and diluted to 100 ml. From this 2ml was taken and diluted to 100 ml. From the resulting solution drug content was estimated at 234 nm using UV spectrophotometer taking phosphate buffer as blank. In-vitro drug release Drug release studies were carried out using USP XXIII dissolution test apparatus, rotating paddle method (Electro lab, Mumbai, India). The study was conducted at 37±0.5oC and 50 rpm. The dissolution medium used was 900 ml of phosphate buffer pH 6.8 and study was carried up to 12 h16. 2 ml of sample was withdrawn at different time intervals and replaced with fresh medium in order to maintain sink condition. The withdrawn samples were diluted suitably and drug content was estimated spectrophotometrically at 234 nm, using phosphate buffer as blank. 24
Deveswaran et al. Int J App Pharm, Vol 4, Issue 2, 2012, 23-29 In-vitro release mechanism In vitro drug release mechanism was determined by using PCP DISSO V3 software. Similarity factor (f2) analysis The primary purpose of f2 is to compare the closeness of two products under consideration. Generally similarity factor in the range of 50-100 is acceptable. The similarity factor between the 2 formulations F7 and F10 was determined using the data obtained from the drug release studies17. The data were analyzed by the formula, f2 = 50 log {[1+ (1/N) ∑nt=1 (Rt-Tt)2]-0.5 ×100} Where, Rt and Tt are the cumulative percentage dissolved at each of the selected N time points of the reference and test product respectively. Stability studies Accelerated stability studies were carried out according to ICH guidelines. During the study period the formulations were packed in HDP containers and stored at 40 ± 2oC and 75 ± 5% RH for a period of 6 months in a stability chamber. The samples were tested at the interval of 2 months and evaluated for the drug content and dissolution studies and the shelf life of the prepared tablet formulations were predicted18. RESULTS AND DISCUSSION The percentage yield of TSP was found to be 76.66%. The identification of the isolated polysaccharide was confirmed by
Day 1
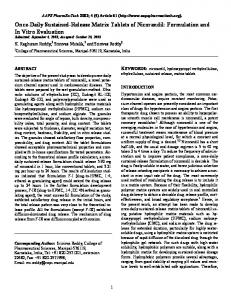
Ruthenium red test as the polysaccharide stained pink in colour. Phytochemical tests showed presence of carbohydrates which was confirmed by Molisch’s test and Barfoed’s test. The isolated TSP powder was soluble in hot water forming a viscous colloidal solution, but sparingly soluble in cold water and insoluble in ethanol, methanol, acetone and ether. Specific gravity of 1% TSP solution in distilled water was found to be 1.1254 and pH was found to be 6.84. Melting point was found to be 180oC, loss on drying was 20% and moisture content was found to be 2.4%. The viscosity of 1% solution at varying rpm 5,10,20,50 and 100 was found to be 6.75, 2.72, 1.41, 0.98, and 0.81 cps respectively. As the rpm increases the viscosity was found to be decreasing thereby exhibiting shear thinning nature of the TSP solution. The isolated TSP powder swelled to 33.33% in water, 28.57% in 0.1N hydrochloric acid and 7% in phosphate buffer pH6.8. The average particle size of the isolated TSP powder was found to be 6.63±0.24 µm. The values of total ash, water soluble ash and acid insoluble ash was 2.14, 1.63 and 0.66%. The values of bulk density, tap density, Hausner’s ratio and bulkiness of TSP powder were 0.740±0.05 g/cc, 0.833±0.06 g/cc, 1.166±0.01 and 1.400±0.02 respectively. The values of angle of repose and compressibility index of TSP powder were found to be 15.83±0.011o and 14.33±0.049% indicating excellent flow properties. The total microbial count determined by streak plate method showed negligible amount of microbes at the end of 7th day of the study. The microbial count was 46 CFU/g at the end of 7th day (Fig. 1). The isolated TSP powder when observed under microscope showed asymmetric particles with rough surface.
Day 7
Fig. 1: Images of test for microbial contamination on FT-IR spectrum of metformin hydrochloride showed peak at 1064.63cm-1 corresponding to NH stretching in a secondary amine. The peak at 3166.90cm-1 indicated OH stretch corresponding to carboxylic group. At 1573.81cm-1 indicated C-C stretch (in-ring), 937.34cm-1 indicated O-H bend confirming the drug as Metformin hydrochloride. The principal absorption peaks of tamarind seed polysaccharide were found at 1045.35cm-1 indicated C-O-C and ether group, 1643.24cm-1 and 1728.10 indicating C=O and aldehyde absorption, 2939.31cm-1 showing C-H stretching, 3332.76 cm-1 of primary OH and 3406.20cm-1 of secondary OH, which indicated that the isolated product was polysaccharide. The spectra of HPMC K4M showed peaks at 1056cm-1 of C-O stretch. 941.20 cm-1 of O-H bend, 1573.81cm-1 of C-C stretch (in ring), 2889.17 of C-H stretch confirming the polymer as HPMC K 4M. The IR spectra of physical mixture of TSP powder with Metformin Hydrochloride and TSP powder with HPMC K 4M showed similar characteristic peaks that confirmed the chemical stability of polymer matrix as well as nonexistence of interaction between polymers and the drug (Fig.2). The DSC thermogram of Metformin hydrochloride showed a sharp endothermic peak at 229.57oC corresponding to the melting point of the drug in the crystalline form, indicating its purity. HPMC K 4M does not show any peak since it is amorphous in nature. Sharp
endothermic peaks were observed at 225.17oC in physical mixture of TSP with metformin hydrochloride and endothermic peaks at 230.03oC was observed in physical mixture metformin hydrochloride with HPMC K 4M (Fig.3). There was a slight shift in the melting point of metformin hydrochloride in the physical mixtures which may be due to uniform distribution of drug in the mixture. The thermograms of physical mixtures showed the presence of drug in crystalline state. This study confirmed that the drug has not undergone any type of interaction with the polymers TSP and HPMC K 4M, thereby indicating the stability of drug and polymer and absence of chemical interaction. Results of pre and post compression parameters were shown in table 2 and 3. The values of bulk density of the prepared granules varied from 0.285 to 0.508 g/cc and the values of tap density ranged between 0.311 to 0.65 g/cc. Hausner’s ratio of the prepared granules ranged from 1.09 to 1.47. These results indicated less interparticle friction between the granules as a result of increasing particle size owing to granulation. The values of angle of repose ranged from 10.31o to 38.84o indicated good and satisfactory flow properties of the prepared granules. The Carr’s index of formulation F1 was 32.30% with poor compressible property whereas, formulations F2, F3, F7 showed 21.53, 15.88
25
Deveswaran et al. Int J App Pharm, Vol 4, Issue 2, 2012, 23-29 and 18.98% indicating satisfactory compressibility index of the granules and formulations F4, F5, F6, F8, F9 have the values ranged between 8.31 to 8.84 % indicating excellent compressible property. All the formulations showed thickness in the range of 5.0 to 7.0 mm and friability less than 1% which was within the prescribed limits. The average weight deviation percentage of 20
tablets from each formulation was less than ± 5% and all the tablets were well within the Pharmacopoeial limit. All the formulations showed good hardness values ranging from 3.26 to 4.8 kg/cm2. The prepared tablets showed high degree of drug content uniformity ranging from 99.7 to 101%, indicating uniform mixing of all the ingredients during granulation.
Fig. 2: IR Spectra of (a) Metformin hydrochloride (b) Isolated TSP powder (c) HPMC K 4M (d) Physical mixture of Metformin hydrochloride and TSP (e) Physical mixture of Metformin hydrochloride and HPMC K 4M 26
Deveswaran et al. Int J App Pharm, Vol 4, Issue 2, 2012, 23-29
Fig. 3: DSC thermogram of (a) Metformin hydrochloride (b) Isolated TSP powder (c) HPMC K 4M (d) Physical mixture of Metformin Hydrochloride with TSP powder (e) Physical mixture of Metformin hydrochloride with HPMC K 4M
Table 2: Data for pre compression studies of the prepared granules Parameters Bulk densitya (g/cc) Tap densitya (g/cc) Angle of reposea (θ) Rate of flowa (sec) Carr’s indexa (%) Hausner’s ratioa Bulkinessa a
F1 0.44±0.04
F2 0.39±0.05
F3 0.397±0.04
F4 0.402±0.04
F5 0.495±0.01
F6 0.508±0.04
F7 0.431±0.06
F8 0.353±0.02
F9 0.285±0.02
0.65±0.05
0.53±0.04
0.472±0.06
0.441±0.05
0.572±0.01
0.641±0.01
0.532±0.01
0.385±0.06
0.311±0.04
10.31±0.70
13.76±0.28
31.0±1.25
30.75±1.55
38.65±1.48
38.84±1.56
38.41±6.85
34.60±3.83
38.65±0.53
2.31±0.15
2.64±1.46
2.81±0.49
3.05±0.44
12.47±0.67
12.51±0.52
14.88±0.46
6.63±0.30
12.47±0.25
32.30±1.29 1.47±0.02 2.27±0.05
21.53±1.06 1.35±0.02 2.56±0.03
15.88±1.04 1.188±0.01 2.518±0.02
8.84±1.32 1.097±0.03 2.487±0.02
8.36±2.59 1.091±0.04 3.508±0.05
8.56±2.42 1.094±0.02 1.968±0.04
18.98±2.30 1.234±0.02 2.320±0.03
8.311±1.81 1.090±0.02 2.832±0.04
8.36±1.81 1.091±0.01 2.832±0.04
Mean ± SD, n = 3. 27
Deveswaran et al. Int J App Pharm, Vol 4, Issue 2, 2012, 23-29 Table 3: Data for post compression studies of the prepared formulations Parameters Weight variation a (mg) Hardness a (kg/cm2) Friability a (%) Thickness a (mm) Drug content a (%) a
F1 920±0.02 4.5±0.24 0.86±0.06 6.88±0.04 99.74±0.25
F2 901±0.02 3.26±0.41 0.72±0.04 7.90±0.12 100±0.22
F3 906±0.01 4.2±0.72 0.93±0.04 7.85±0.06 99.92±0.39
F4 910±0.03 4.4±0.41 0.92±0.02 7.96±0.04 100±0.24
F5 905±0.02 4.6±0.40 0.94±0.04 5.86±0.28 100±0.50
F6 915±0.02 4.2±0.36 0.84±0.02 6.96±0.08 99.80±0.45
F7 910±0.01 3.46±0.30 0.80±0.03 5.89±0.16 99.94±0.26
F8 904±0.02 4.8±0.20 0.13±0.02 7.24±0.02 100±0.36
F9 911±0.02 4.46±0.41 0.79±0.05 5.94±0.06 100±0.41
Mean ± SD, n = 3.
The results of dissolution study indicated that the formulations F1, F2, F3, F4, F5, F6, F7, F8 and F9 showed 99.8, 100.63, 100.1, 108.35, 104.64, 100.36, 101.80, 99.54 and 99.28% release respectively. Parallely a marketed formulation was subjected to dissolution studies to compare the release profile of the prepared formulations. The drug released between 3 to 12 h from the tablet formulations (Fig.4). The
formulation F1 showed 99.38% at the end of 3rd h and formulation F7 showed 101.80% release at the end of 11th h. it was observed that as the polymer concentration increased the drug release was retarded. This may be due to increase in polymer concentration or increase path length diffusion. The release of formulation F7 was found similar to the release of marketed formulation F10.
Cumulative drug release (%)
100
F1 F2
80
F3 F4
60
F5
40
F6 F7
20
F8 F9
0 0
2
4
6
8
10
12
14
Market sample
Time (h) Fig. 4: Cumulative percent drug release of prepared tablet formulations The drug release kinetics of formulations F1, F3, F6, F8 and F9 was predicted to be Matrix model with R2 values 0.9539, 0.9935, 0.9764, 0.9894 and 0.9883 respectively, indicating the release of drug from matrix as a square root of time dependent process based on Fickian diffusion. Formulations F2, F4, F5 and F7 showed Peppas model with R2 values 0.9909, 0.9934, 0.9957 and 0.9909 respectively. By incorporating the first 60% of release data, mechanism of release was indicated according to Korsmeyer where ‘n’ is the release exponent, indicative of mechanism of drug release. Fickian diffusional release and case- II relaxational release are the limits of this phenomenon. Fickian diffusional release occurs by the usual molecular diffusion of the drug due to a chemical potential gradient. Case- II relaxational release is the drug transport mechanism associated with stress and state-transition in hydrophilic glassy polymers which swell in water or biological fluids. The release exponent values of F1, F2 and F6 were 0.1354, 0.1570 and 0.3299 which was beyond the limits of Korsmeyer model so- called power law. The power law can only give limited insight into the exact release mechanism of the drug. The release exponent values of F3, F5, F7, F8 and F9 were 0.5343, 0.6715, 0.6142, 0.4794 and 0.5347, indicating non-Fickian diffusion/anomalous drug release. Formulation F7 showed Peppas model with R2 values 0.9909 and release exponent values of 0.6142 found to have similar release profile as compared with marketed product. The similarity factor (f2) value between F7 and F10 (Marketed product) formulations was
found to be 50.65. This study confirmed that the release of Metformin hydrochloride from the prepared tablets (F7) was similar to that of the marketed tablet (F10). Based on this formulation F7 containing 350 mg of TSP powder was optimized and subjected for stability studies. The stability studies indicated that the tablets does not show any physical changes during the study period and the drug content was found above 97% for the formulation F7 at the end of 6 months. Formulation F7 showed a maximum of 99.36% drug content and drug release of 92.18% after 11 hours at the end of 6 months. This indicated that formulation F7 was stable at accelerated storage condition and there was no appreciable change in the physical appearance of the prepared tablets. CONCLUSION Tamarind seed polysaccharide being a natural polysaccharide do not possess any toxicity or side effects and was found to be suitable and effective for retarding the drug release of the selected drug Metformin Hydrochloride. Hence, it can be administered to patients safely, thereby improving the patient compliance by releasing the drug in a sustained manner. ACKNOWLEDGEMENT The authors are thankful to Gokula Education Foundation for providing the necessary facilities to carry out the research work. The authors thank IISc, Bangalore for carrying out DSC studies. 28
Deveswaran et al. Int J App Pharm, Vol 4, Issue 2, 2012, 23-29 REFERENCES 1.
2.
3.
4.
5.
6. 7.
8.
Langer RS, Peppas NA, Present and future application of biomaterials in controlled drug delivery systems, Biomaterials, 1981; 2 (10), p201-213. Uccello-Barretta G, Samuele N, Fedrica B, Giacomo DC, Ylenia Z, Chiara Z, Enhanced affinity of ketotofin towards tamarind seed polysaccharide in comparison with hydroxyethylcellulose and hyaluronic acid: A nuclear magnetic resonance investigation, Bioorg Med Chem, 2008; 16, p7371-7376. Yoko N, Katsuyoshi N, Gelation and gel properties of polysaccharides gellan gum and tamarind xyloglucan, J Biol Macromol., 2005; 5(3), p47-52. Phani kumar GK, Gangarao B, Lova Raju NSK, Preparation and evaluation of sustained release matrix tablets of lornoxicam using tamarind seed polysaccharide, Int J Pharm Res Dev, 2011; 2(12), p89-98. Sumathi S, Alok RR, Role of modulating factors on release of caffeine from tamarind seed polysaccharide tablets, Trends Biomater Artif Organs, 2003; 7(1), p41-46. Sumathi S, Alok RR, Release behaviour of drugs from tamarind seed polysaccharide tablets, J Pharm Pharm Sci, 2002; 1, p12-18. Ritu MG, Manish M, Rashi S, Neeraj G, Mishra DN, Enhancement of miotic potential of pilocarpine by tamarind gum based insitu gelling ocular dosage form, Acta Pharm Sciencia, 2010; 52, p145-154. Sweetman SC. Martindale. The complete drug reference. 34th ed, Vol.1, The Pharmaceutical press; London. 2005. p 342.
9.
10. 11. 12. 13.
14. 15.
16.
17.
18.
Goodman & Gilman’s: The Pharmacological Basis of Therapeutics. 11th ed, Mcgraw –Hill medical publishing division; USA. 2005. p 1638. Rao PS, Ghosh TP, Krishna S, Extraction and purification of tamarind seed polysaccharide, J Sci Ind Res, 1946; 4, p 705-707. Raman N. Phytochemical techniques. New India Publishing Agency; New Delhi. 2006. p19-24. Indian Pharmacopoeia. Vol I. The Indian Pharmacopoeia Commission; 2007. p134-135. Nimit TA, Divakar G, Shantha Kumar GS, Nishit TA, Priyanka P, Patel C, Formulation and evaluation of fast dissolving tablets of hydrocortisone sodium succinate, Res J Pharm Bio Chem Sci, 2011; 2(2), p 817-837. Shah CS, Quadry JS. A text Book of Pharmacognosy. 11th ed, B S Shah Praskashan; Ahmedabad. 1995. p 96. Rashmirekha S, Soumendra S, Padma LN, Release behavior of anticancer drug paclitaxel from tamarind seed polysaccharide galactoxyloglucan, Eur J Sci Res, 2010; 47 (2), p 197-206. Deveswaran R, Sindhu A, Bharath S, Basavaraj BV, Sharon F, Madhavan V, Design and characterization of diclofenac sodium tablets containing tamarind seed polysaccharide as release retardant, Int J Pharm Tec Res, 2009; 1(2), p191-195. Amelia A, Vikram K, Design and evaluation of matrix-based controlled release tablets of diclofenac sodium and chondroitin sulphate, AAPS Pharm Sci Tech, 2007; 8(4), p1-6. Sharma A, Shukla T, Indoria M, Jha SK, Design, Development and evaluation of aceclofenac sustained release matrix tablets, Int J Drug Dev Res, 2011; 3(1), p307-313.
29