Geofísica Internacional (2003), Vol. 41, Num. 2, pp. 247-259
Diagnosis and prognosis of extreme precipitation events in the Mexico City Basin Víctor Magaña, Joel Pérez and Matías Méndez Centro de Ciencias de la Atmósfera, UNAM, México, D.F., México Received: April 18, 2001; accepted: April 17, 2002 RESUMEN El número de tormentas severas (más de 20 mm hr-1 de precipitación) en la cuenca de la ciudad de México se ha incrementado en décadas recientes. Varios estudios indican que en algunas partes de la ciudad hay mucha más precipitación que en el pasado. Estos cambios en los regímenes climáticos de la ciudad de México han resultado en mayor riesgo a eventos hidrometeorológicos extremos (fuertes precipitaciones e inundaciones). En el campo de la prevención de desastres, es necesario determinar cuándo ocurre un evento extremo de precipitación. En el presente estudio se define un criterio para determinar un evento de precipitación extrema en la cuenca de la ciudad de México. Usando registros de precipitación de una densa red de pluviómetros, se documentan las características espaciales y temporales de la precipitación. En la región oeste de la ciudad se experimentan los eventos de precipitación más intensos por la interacción de los vientos del este y la orografía. Consecuentemente, los valores umbrales para un evento extremo son mayores en la parte oeste de la cuenca que en la del este. Se analiza la capacidad para predecir eventos extremos de precipitación en la ciudad de México usando un modelo de mesoescala, así como los usos potenciales de información del tiempo meteorológico para disminuir la vulnerabilidad de la ciudad de México a precipitaciones intensas. PALABRAS CLAVE: Evento extremo de precipitación, tiempo meteorológico, ciudad de México.
ABSTRACT The number of severe storms (more than 20 mm hr-1 of rainfall) in the Mexico City basin has increased in recent decades. In some parts of the city there is substantially more precipitation than in the past. These changes in the weather regime have resulted in higher risk to intense precipitation and floods. In disaster preparedness activities, it is necessary to determine when an extreme precipitation event occurs. In the present study, a criterion to determine an extreme precipitation event in the Mexico city basin is defined. Based on continuous records of precipitation from a dense rain gauge network, the spatial and temporal characteristics of precipitation are documented. The western part of the city experiences the strongest precipitation events due to the interaction of easterly winds with orography. Thus, the threshold values for an extreme event are higher in the western than in the eastern part of the basin. The current capability to predict extreme precipitation events in Mexico City using a mesoscale model is analyzed. Potential use of weather information to reduce the vulnerability of Mexico City to intense precipitation is discussed. KEY WORDS: Extreme precipitation event, weather, Mexico City.
The Mexico city basin has long been a region where intense precipitation events occurr. According to data from the National Water Commission of Mexico, precipitation in excess of 60 mm in twenty four hours is not unusual in the southwestern part of the city. The maximum historical record in the southern part of the city is 164.9 mm in 24 hours on September 22, 1983. Intense precipitation events are more frequent in recent decades. According to Jáuregui (2000), the number of severe storms (more than 20 mm hr-1 of rainfall) has increased from around four per decade about sixty years ago, to almost twenty per decade in the eighties. Such changes in precipitation have been attributed to the so-called “heat island effect” (Jáuregui and Romales, 1996).
INTRODUCTION Mexico city is located in a basin at 2200 m altitude and at a latitude of approximately 19°N. It exhibits a monsoonal type of climate, with a well-defined rainy season from late May until early October. Average precipitation varies from around 400 mm yr-1 in the northeastern part of the basin, to almost 1200 mm yr-1 in the south-western part of the city. In summer, the interaction of the mountains with the easterly winds in the Mexico basin determines to a large extent precipitation (intensity, number of extreme events). Mean summer precipitation exhibits an east – west gradient, with more intense and frequent precipitation along the southern and western slopes of the basin (Jáuregui, 1971).
The explosive growth of population in Mexico City has 247
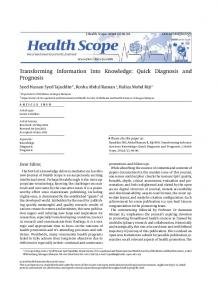
V. Magaña et al. substantially changed the landscape of this basin. What used to be forests became urban areas. According to Huff and Changnon (1973), the heat island effect has increased convective precipitation. In large urban areas as in México City, changes in the albedo of the surface, may result in a warmer surface and a more unstable atmosphere and adequate conditions for intense storms to occur. More particles in the atmosphere acting as condensation nuclei may also result in more intense convective activity. In the Mexico city basin, high density population groups have settled in risky areas such as cliffs and river beds. This has increased vulnerability to extreme hydro-meteorological events. Disasters related to intense precipitation have become serious problems for the authorities in charge of civil defense and urban water management. Nowadays, preventive schemes involve diagnostic analyses and predictions of at least 12 hours in advance. Most weather predictions for the Mexico basin are based on empirical methods. However, they are seldom used to take preventive measures. At most, the monitoring of precipitation is used to inform the population and to explain the nature of a disaster. In disaster preparedness activities, it is necessary to know the spatial and temporal characteristics of precipitation to determine when a particular condition constitutes an extreme event and a threat for a certain sector of the population. This is just one of the elements that a complete early warning system should include. The other important element is a Numerical Weather Prediction (NWP) model, to approximately determine in advance the regions that may be affected by severe weather. Further elements of the system are a model to determine runoff and a characterization of the vulnerability of the urban sectors and the socioeconomic environment. These aspects of disaster preparedness are not discussed in this work. In the present study, a methodology to diagnose and predict extreme meteorological conditions in the Mexico city basin is developed, using observations and a mesoscale model. The main objectives of this work are i) to establish a criterion to determine the occurrence of an extreme precipitation event, and ii) to analyze the current capability of a NWP model to predict extreme precipitation events in the Mexico city basin. DATA AND METHODOLOGY a) Precipitation data Various precipitation data sets exist for the Mexico City basin. Their spatial and temporal coverage varies substantially. Daily surface data from the National Weather Service 248
network include information from stations in Mexico City and surrounding states (Figure 1) with a record length of more than fifty years. The Mexico City Office of Water Management has prepared a more detailed precipitation data set. It includes observations taken approximately every 3 minutes from a dense rain gauge network (more than 70 stations) over Mexico City for the 1993 - 2000 period. The temporal resolution of this data set allows a detailed description of the evolution of precipitation events. Most rain gauges in Mexico City are distributed over relatively flat terrain, but some are located in the mountainous western sector of the basin, where the most intense precipitation occurs. Using time series of summer precipitation from stations in the Mexico City basin, the hourly characteristics of precipitation may be examined. Analyses for five stations in the northern (Lindavista – 03), southern (Caseta forestal – 39), eastern (Santa Catarina - 31), western (La Venta – 22) and central (Xotepingo – 27) parts of the city will be used as examples of the entire rain gauge network. The two available data sets have been merged for the 1993-2000 period to obtain gridded daily precipitation data sets with a spatial resolution of 8 km X 8 km centered in Mexico City. The interpolation of scattered data into a regular grid was done using a universal Kriging method (Carr, 1990). This resolution was selected to make the precipitation fields comparable to the output from a NWP model. The analysis of precipitation data included the development of monthly mean fields to determine the spatial distribution of rainfall over the city. Considering the summer months as the most convectively active (Figure 2), the statistics of extreme precipitation events will be evaluated for the JuneSeptember period. The statistics of extreme events and the comparisons with the numerical simulations correspond to accumulated rainfall in 24 hours (between 6AM LT day i and 6AM LT day i+1). b) A numerical weather prediction model for the Mexico basin In order to test the current capacity to predict extreme precipitation events, mesoscale NWP models may be used (Warner 1997). The term mesoscale refers to atmospheric processes with horizontal length scales between 2 km and 2000 km (Orlanski 1975). The model selected for this study is the Pennsylvania State University / National Center for Atmospheric Research (PSU/NCAR) mesoscale model, known as MM5. This model was originally developed by Anthes and Warner (1978) and further refined by the international community, particularly at NCAR (Duhdia et al. 1999). The MM5 system has been widely used by the meteorological community for a number of purposes (Magaña and Pérez, 1998), including the study of severe weather phenomena. The MM5 has proven to be a useful tool in
Extreme precipitation in Mexico City
Fig. 1. Topography and location of the surface stations used in the study. Crosses correspond to stations from the National Weather Service. Circles correspond to stations from the Office of Water Management of Mexico City. Contour interval 100 m. Stars correspond to stations where a detailed analysis is performed.
NWP (Haagenson et al., 1992), and it has been selected for the present study, considering it is currently used for operational NWP in Mexico. Its modular structure allows for a number of modifications in the land use data, selected parameterizations, or spatial resolution. There are other models (e.g. Regional Atmospheric Model System, Nair et al., 1997) also used for studies of weather and mesoescale circulations. However, such models are not widely available within the scientific community. The PSU/NCAR mesoscale model MM5 is a limitedarea, nonhydrostatic, terrain-following sigma-coordinate
designed to simulate or predict mesoscale and regional-scale atmospheric circulations. Since MM5 is a regional model, it requires initial as well as lateral boundary conditions. The initial conditions are given by gridded analyses of meteorological variables interpolated at the selected spatial resolution of the model. To produce lateral boundary conditions for the model run, one needs global gridded data to cover the entire time period that the model is integrated. For the numerical simulations in this study the initial and lateral boundary conditions correspond to operational predictions and predicted fields of the Aviation Model with a spatial resolution of 1° X 1°. The data given to the model include: tempera249
V. Magaña et al.
Fig. 2. Monthly mean precipitation in the Mexico basin for the 1993-2000 period. a) June, b) July, c) August and d) September.
ture, zonal and meridional components of the wind, geopotential, surface pressure and relative humidity. Since 1999, MM5 has been adapted to run operationally to produce weather predictions for the Mexico basin. The configuration of the model includes: •
a mother domain of 31 x 31 points with a spatial resolution of 24 km, centered at 99.2°W and 19.1°N
•
a nested domain of 31 x 31 points with a spatial resolution of 8 km
•
Lambert conformal projections
•
23 sigma levels in the vertical, from surface to 100 mb
•
Topography with a 9 km resolution
•
Land use with a 19 km resolution
250
•
Kain-Fritsch cumulus parameterization scheme
•
Blackadar boundary layer scheme
•
Radiation scheme every 30 minutes
Parameterizations for cumulunimbus, boundary layer or radiation may be chosen in the MM5 system from a number of options. The ones selected for the present study have proven to adequately reproduce the synoptic characteristics of weather in Mexico. Output from the numerical simulations and the operational NWP runs is saved every hour to have a relatively detailed temporal description of the meteorological systems. The output fields are compared with the observed ones to evaluate the accuracy of the simulations and predictions. The observed precipitation fields used in the evaluation have
Extreme precipitation in Mexico City a spatial resolution comparable to the MM5 simulation. In this way, the mother domain simulations of precipitation are compared with an observed precipitation field interpolated at 24 km resolution. Similarly, precipitation in the nested domain is compared with an 8 km resolution precipitation field. STATISTICS OF EXTREME PRECIPITATION EVENTS Precipitation over the Mexico basin occurs from late May through September. The dominant summer easterly winds usually result in an intense orographic component of precipitation over the western and southern mountains of the basin (Jáuregui 2000). There, annual precipitation may be between 700 and 1200 mm yr-1. In the central and northern parts of the basin, precipitation is just between 450 and 550 mm yr-1. Daily precipitation events in the Mexico City basin exhibit a well-defined diurnal cycle. There are relatively clear skies before noon and frequent storms in the afternoon and in the evening (Figure 3). In general, afternoon precipitation tends to occur relatively earlier (~1 hour) in the eastern part than in the western part of the basin. Severe storms (> 20 mm hr-1) are more probable to occur after 16:00 LT. It is interesting to notice some indications of precipitation during the early morning (around 6 AM LT). Some reports from stations in the western mountains of the basin indicate precipitation at this hour may be as large as 5 mm hr-1. The characteristics and dynamics of this phenomenon are unclear at present. In order to determine when precipitation turns into an extreme event, it is necessary to establish the local characteristics of daily precipitation. An extreme event may be defined as the largest or smallest value of an atmospheric variable among a given number of observations. The probability of having a certain amount of rainfall in 24 hours may be determined using a bounded on the left distribution, such as the Gamma probability density function (PDF). Following Wilks (1995), the unusualness of rainfall above a certain amount may be evaluated adopting the maximumlikelihood estimators for the Gamma PDF of daily precipitation. Dividing the distribution into percentiles, values of precipitation above a certain threshold may be considered to have only a 10% or a 5% probability to occur. In the present study, the criteria to define an extreme precipitation event is that rainfall in 24 hours should be in the percentile corresponding to the 10% probability area in the extreme right of the Gamma PDF. Regions where intense precipitation is common will have large threshold values of rainfall in 24 hours to determine an extreme event, while in regions where precipitation is relatively weak, the threshold value will be relatively low.
The previously described criterion was used for each station of the rain gauge network in the Mexico basin, in order to determine the values above which extreme precipitation occurs. Figure 4 shows the corresponding Gamma distributions of precipitation for five stations of the network and the threshold values of rainfall in 24 hours above which extreme precipitation events are defined. Once the threshold values are determined for the Mexico basin (Figure 5), the spatial variability of severe weather becomes apparent. It is clear that for an extreme precipitation event to occur in the western or southern part of the basin, rainfall in 24 hours should exceed 25 or 30 mm, while in the eastern part of the city, more than 15 mm in 24 hours already constitute an extreme event. As previously mentioned, the interaction of the mountains with the easterly flow results in substantially more rainfall in the west than in the east of the basin, i.e. the orographic component of precipitation (Barros 1994). On average, there are no more than 12 extreme events occurring every summer in a particular location of Mexico City (Table 1). However, there is interannual variability in the number of these phenomena during the last seven years. Even during relatively dry summers, various severe storms and intense precipitation may occur. Therefore, operational weather predictions may be a useful tool in disaster preparedness activities. Table 1 Number of extreme precipitation events in five stations of Mexico City Station-number (location)/year Lindavista-03 (north) La Venta-22 (west) Santa Catarina-31 (east) Caseta Forestal-39 (south) Xotepingo-27 (center)
1993 1994 1995 1996 1997 1998 1999
10 4 5 12 3
5 8 6 6 8
8 11 6 9 6
6 5 2 2 6
5 5 5 3 5
5 7 5 6 5
3 8 4 6 4
NUMERICAL SIMULATIONS OF PRECIPITATION IN MEXICO CITY Extreme events information turns valuable when preventive actions may be implemented to ameliorate the damage these phenomena cause. However, prevention is only possible when adequate predictions on the amount of rainfall at certain locations are available at least 12 hours in advance. The significant progress made on NWP has made numerical models one of the most efficient tools to obtain accurate weather forecasts for the following 24 and 48 hours. 251
V. Magaña et al.
Fig. 3. Hourly mean precipitation (bars) and mean number of precipitation events (solid line) during summer in five stations of Mexico City: a) Lindavista-03, b) La Venta-22, c) Santa Catarina31, d) Caseta Forestal-39, and e) Xotepingo-27.
252
Extreme precipitation in Mexico City
Fig. 4. Mean distribution of the daily accumulated precipitation in ranges of 5 mm for a) Lindavista-03, b) La Venta-22, c) Santa Catarina-31, d) Caseta Forestal-39, and e) Xotepingo-27.
For NWP in a limited area, such as the Mexico basin, it is necessary to use a mesoscale model, whose configuration depends on the specific purpose for which it is being used. General features of these models include boundary layer, cumulus parameterization, long and short wave radiation and
cloud microphysics schemes, as well as surface-atmosphere interactions. The MM5 model has been adapted for simulations and predictions for the Mexico basin, and used for a number of purposes (e.g., weather prediction, trajectory analysis, etc.). Prior to operational NWP with MM5, a num253
V. Magaña et al.
Fig. 5. Threshold values to determine daily extreme precipitation event. Topography is shown in shades of gray.
ber of simulation experiments were conducted for particular weather events, aimed at determining its best configuration. Since June 2000, the MM5 has been running operationally as a NWP model for Mexico and the Mexico basin. The skill of the model to predict daily weather appears to be high enough as to resolve circulations with spatial scales of 24 km. For the present study, it is necessary to determine its skill with higher spatial resolution i.e., for predictions of localized extreme events. One way to evaluate the quality of precipitation predictions is to compare observed values with predicted ones at a particular location. For instance, the occurrence of precipitation in Tacubaya during September 2000 was adequately predicted (Figure 6) by the routine MM5 system for Mexico 254
(24 km resolution). It is observed though, that the extreme event on September 14th was not adequately predicted by MM5. Predicted precipitation was not more than 10 mm in 24 hours, while the observed precipitation reached more than 20 mm in 24 hours. The spatial patterns of observed and predicted precipitation with relatively coarse resolution (24 km) show a good correspondence. However, the values of precipitation show substantial differences (Figure 7). A weather prediction experiment for the same date was run using a nested domain with a finer spatial resolution (8 km). When the spatial pattern of predicted accumulated rainfall in 24 hours (Figure 8a) is compared with a gridded (8 km) observed field of precipitation (Figure 8b), the errors in the location of the maxima and minima become evident. With
Extreme precipitation in Mexico City
Fig. 6. Time series of observed and predicted daily precipitation at Tacubaya, during September 2000. Negative values correspond to lack of data for that date.
8 km spatial resolution, MM5 shows a systematic bias to produce precipitation in the southwestern part of the basin. There are a number of factors that make predictions of precipitation less than perfect. These factors include: quality of initial (interpolated) data and limitations of the physical parameterization schemes. For instance, the initial condition for the 24 hours prediction of the 14th of September 2000 in the nested domain (8 km spatial resolution) was obtained from an Aviation model field with a spatial resolution of more than 100 km. In order to make the mesoscale condition closer to the observed data, an objective analysis of the meteorological fields was performed using data from surface stations and the sounding at Tacubaya at 0:00 UTC. The initial condition analyzed at a mesoscale level resulted in a predicted precipitation pattern (Figure 8c) closer to the observed one, but sitill, with substantially less precipitation. Additional simulations of extreme precipitation events in other parts of the city show that the MM5 model is capable of detecting the location of the precipitation maxima and minima when coarse (~24 km) resolution is used. In most cases, intense precipitation in the southwestern part of the basin was determined during periods when strong convec-
tive activity over the Mexico basin was observed. However, the exact location and amount of precipitation during an extreme precipitation event was seldom predicted by the model, at least in the domain with fine spatial resolution (8 km). SUMMARY AND CONCLUSIONS Extreme precipitation events in the Mexico basin have become a major threat in recent years, given an increase in the number of severe storms and the higher vulnerability of the city to intense precipitation. In the present paper, some aspects of the temporal and spatial characteristics of daily precipitation have been examined using observed data and a mesoscale model. A criterion to determine when intense precipitation should be considered an extreme event was developed based on a Gamma PDF of the observed amount of daily rainfall, for each station of the rain gauge network. It was found that for intense precipitation to be considered an extreme event, the accumulated precipitation in 24 hours should exceed a larger threshold value in the south and western parts of the city than in the eastern and northern parts. This is related to the role played by the mountains of the basin, interacting with the dominant easterly flow. 255
V. Magaña et al.
a)
Fig. 7. Accumulated precipitation in the Mexico basin from 14 September 2000 6AM LT to 15 September 2000 6 AM LT, with a 24 km spatial resolution representation. a) observed and b) predicted.
Numerical models, such as the MM5, are capable of reproducing the spatial distribution of precipitation at a mesoscale level, with resolution of around 24 km. However, the observed details of precipitation at a finer resolution (spatial scales of less than 10 km) are hard to predict at least in a region of complex topography as the Mexico basin. The problem of predicting the exact values of rainfall continues as a challenge for the atmospheric sciences community. Numerous groups work on problems related to physical parameterizations and initialization to obtain better simulations of convective activity (Matsuno 1987). For the case of the Mexico basin, part of the problem is related to the quality of the initial condition. The inclusion 256
of more refined information for high resolution simulations results in precipitation patterns closer to the observed ones. Unfortunately, the sounding information for Mexico is not always available on time to be included in the initial conditions for operational NWP. Consequently, only the coarse operational analyses from NCEP or the Aviation Model are used as initial condition most of the time. Weather information obtained from numerical models does not have to be perfect to be used as an additional element in the decision making process. In particular, numerical weather predictions from mesoscale models constitute the most valuable source of information in the early warning systems to prevent hydrometeorological disasters. In the short
Extreme precipitation in Mexico City
b)
Fig. 7. (Continued).
term (one or two days) the predictions of precipitation or surface temperature should be used in conjunction with additional information from runoff models or diagnostics of the vulnerability of the regions to design Disaster Preparedness strategies. The post – processing NWP information may result useful to interpret model output related to severe weather. In the case of Mexico City, the vulnerability of a region depends on the topographic conditions which may lead to large runoffs and flooding. In addition, the socioeconomic conditions of various parts of the city determine its vulnerability. The most densely populated regions of the city are located in the central and northeastern parts. There, precipi-
tation above 15 mm day-1 constitutes an extreme event. As determined in this study, more than three extreme events occur every summer. If some of these correspond to severe storms (> 20 mm hr-1), the risk for the population is high. If the tendencies for more precipitation in most of Mexico City continue, an early warning system based on NWP and other modern tools (meteorological radars) should be seriously considered in the Civil Protection agencies. ACKNOWLEDGEMENTS We appreciate the technical support provided by Jorge L. Vázquez and Vladimir Hernández in the use of MM5. Miguel Angel Villanueva kindly provided precipitation data 257
V. Magaña et al.
a)
b)
c)
Fig. 8. As in Fig. 7 but for the Mexico basin using finer resolution representation (8 km). a) observed, b) simulated, and c) simulated using information from surface stations and the radiosonde at Tacubaya in the initial condition.
258
Extreme precipitation in Mexico City from the Mexican National Weather Service. Comments from Carlos Gay and Ernesto Caetano were valuable. We want to thank the Dirección General de Construcción y Operación Hidráulica for having released the precipitation data used in the present study and for providing financial support to carry it out. The present study has also been financially supported with a grant from CONACYT 32516T and a grant from Dirección General de Asuntos del Personal Académico (DGAPA) PAPIIT 122001. BIBLIOGRAPHY ANTHES, R. A. and T. T. WARNER, 1978. Development of hydrodynamic models suitable for air pollution and other meteorological studies. Mon. Weath. Rev., 106, 10451078. BARROS, A. P. 1994. Dynamic modeling of orographically induced precipitation. Rev. Geophys., 32, 265-284. CARR, J. R., 1990. UVKRIG: A Fortran-77 program for universal Kriging. Computer and Geosciences, 16, 211-236. DUDHIA, J., D. GILL, Y.-R. GUO, D. HANSEN, K. MANNING and W. WANG, 1999. PSU/NCAR Mesoscale Modeling System Tutorial Class Notes and Users’ Guide (MM5 Modeling System Version 2). HAAGENSON, P. H., D. O. GILL and Y. H. KUO, 1992. Real time forecasts for WISP-91 using the Penn State / NCAR mesoscale model. NCAR Technical note. NCAR/TN-380+STR. 42 p. HUFF, F. A. and S. A. CHANGNON Jr., 1973. Precipitation modification by major urban areas. Bull. Amer. Met. Soc., 54, 1220-1231. JÁUREGUI, E., 1971. Mesomicroclima de la Ciudad de México. Instituto de Geografía. UNAM, 87p. JÁUREGUI, E., 2000. El Clima de la Ciudad de México. Edited by Instituto de Geografía and Plaza y Valdés Editores. 131 p.
JÁUREGUI, E. and ROMALES, 1996. Urban effects on convective precipitation in Mexico city. Atmospheric Environment. 30, 3383-3389. MAGAÑA, V. and J. L. PÉREZ, 1998. Usos de un modelo de mesoescala en el estudio de la dinámica atmosférica regional de México. GEOUNAM, 5, 33-39. MATSUNO, T., 1987. Short- and medium range numerical weather prediction. Collection of papers presented at the WMO/IUGG NWP Simposium. Tokyo, 4-8 August 1986. 831 p. NAIR, U. S., M. R. HJELMFELT and R. A. PIELKE, 1997. Numerical simulation of the June 9-10 1972 Black Hills storm using CSU RAMS. Mon. Weath. Rev., 125, 17531766. ORLANSKI, I., 1975. A rational subdivision of scales for atmospheric processes. Bull. Amer. Met. Soc., 56, 527530. WARNER, T. T., 1997. Environmental applications of mesoscale atmospheric models. In: Numerical Simulations in the Environmental and Earth Sciences. Proceedings of the Second UNAM-CRAY Supercomputing Conference. Ed. F. García García, G. Cisneros, A. Fernández Eguiarte and R. Alvarez. Cambridge University Press. 283 p. WILKS, D. S., 1995. Statistical methods in the atmospheric sciences. Ed. Academic Press. 467p. ______________
Víctor Magaña, Joel Pérez and Matías Méndez Centro de Ciencias de la Atmósfera, Universidad Nacional Autónoma de México Ciudad Universitaria, 04510 México, D.F., México Email:
[email protected]
259