ORIGINAL CONTRIBUTION
Diagnosis-Independent Alzheimer Disease Biomarker Signature in Cognitively Normal Elderly People Geert De Meyer, PhD; Fred Shapiro, MLS; Hugo Vanderstichele, PhD; Eugeen Vanmechelen, PhD; Sebastiaan Engelborghs, MD, PhD; Peter Paul De Deyn, MD, PhD; Els Coart, PhD; Oskar Hansson, MD; Lennart Minthon, MD; Henrik Zetterberg, MD, PhD; Kaj Blennow, MD, PhD; Leslie Shaw, PhD; John Q. Trojanowski, MD, PhD; for the Alzheimer’s Disease Neuroimaging Initiative
Objective: To identify biomarker patterns typical for Alzheimer disease (AD) in an independent, unsupervised way, without using information on the clinical diagnosis. Design: Mixture modeling approach. Setting: Alzheimer’s Disease Neuroimaging Initiative
database. Patients or Other Participants: Cognitively normal persons, patients with AD, and individuals with mild cognitive impairment. Main Outcome Measures: Cerebrospinal fluid– derived -amyloid protein 1-42, total tau protein, and phosphorylated tau181P protein concentrations were used as biomarkers on a clinically well-characterized data set. The outcome of the qualification analysis was validated on 2 additional data sets, 1 of which was autopsy confirmed. Results: Using the US Alzheimer’s Disease Neuroimaging Initiative data set, a cerebrospinal fluid -amyloid pro-
tein 1-42/phosphorylated tau181P biomarker mixture model identified 1 feature linked to AD, while the other matched the “healthy” status. The AD signature was found in 90%, 72%, and 36% of patients in the AD, mild cognitive impairment, and cognitively normal groups, respectively. The cognitively normal group with the AD signature was enriched in apolipoprotein E ε4 allele carriers. Results were validated on 2 other data sets. In 1 study consisting of 68 autopsy-confirmed AD cases, 64 of 68 patients (94% sensitivity) were correctly classified with the AD feature. In another data set with patients (n=57) with mild cognitive impairment followed up for 5 years, the model showed a sensitivity of 100% in patients progressing to AD. Conclusions: The mixture modeling approach, totally
independent of clinical AD diagnosis, correctly classified patients with AD. The unexpected presence of the AD signature in more than one-third of cognitively normal subjects suggests that AD pathology is active and detectable earlier than has heretofore been envisioned. Arch Neurol. 2010;67(8):949-956
T
HE INITIATION OF THE ALZheimer disease (AD) pathogenic process is typically unobserved and has been thought to precede the first symptoms by 10 years or more. Therefore, demonstrating that AD biomarkers,
For editorial comment see page 918
Author Affiliations are listed at the end of this article. Group Information: A list of the Alzheimer’s Disease Neuroimaging Initiative members appears at http://www.adni-info.org/ISAB/ ISABMembers.aspx.
such as cerebrospinal fluid -amyloid protein 1-42 (CSF A1-42), total CSF tau protein, and CSF phosphorylated tau181P (PTau181P) protein concentrations,1 are true indicators of the pathogenic process at an early stage is a major challenge. Although other biomarkers determined in CSF or plasma can also be envisioned,2,3 P-Tau and A biomarkers are currently already being considered for inclusion in revised AD diagnostic criteria.4
(REPRINTED) ARCH NEUROL / VOL 67 (NO. 8), AUG 2010 949
To date, assessment of biomarker accuracy relies on the clinical AD diagnosis as its point of reference. Early detection of AD is generally rephrased as predicting the progression from mild cognitive impairment (MCI) to AD. In this scenario, biomarker information obtained at the MCI stage is used to infer a future AD diagnosis, for instance, in a time-to-event analysis (with AD clinical diagnosis as the event) using
CME available online at www.jamaarchivescme.com and questions on page 913 Kaplan-Meier or Cox proportional hazards regression methods.1 Despite the conceptual simplicity of biomarker assessment, it is debatable whether the methods used truly assess to what extent biomarkers are indicators of the pathogenic process. One issue is the time lag between the
WWW.ARCHNEUROL.COM
©2010 American Medical Association. All rights reserved. Downloaded From: http://archneur.jamanetwork.com/ on 01/13/2013
Table 1. Demographics of the US-ADNI Study Population a Diagnosis
Normal
MCI
AD
Subjects with lumbar puncture Median age, y (p25-p75)
114 200 102 75.8 74.8 76.0 (72.0-78.4) (70.2-79.8) (70.9-80.5) Sex (M/F) 56/58 66/134 43/59 APOE ε4 genotype (no/yes) 87/27 92/108 31/71 Results for 3 biomarkers available 114 196 100 Complete biomarker results and 112 188 98 follow-up diagnosis available
Abbreviations: AD, Alzheimer disease; APOE, apolipoprotein E; MCI, mild cognitive impairment; p25, percentile 25; p75, percentile 75; US-ADNI, US Alzheimer’s Disease Neuroimaging Initiative. a More detailed information on the study population is described in Shaw et al.6
pathogenic process and clinical diagnosis; the other confounding issue is errors in the clinical AD diagnosis. These issues are related to the use of clinical diagnosis as the point of reference for the pathogenic process, which can bias biomarker performance assessment and lead to suboptimal decisions criteria. To circumvent or possibly remedy this situation, we applied an alternative unsupervised learning approach to biomarker assessment that does not use the clinical diagnosis as the point of reference. First, we illustrate the key ideas when applying a single biomarker in this way and then proceed to build a model for a multibiomarker setting. Finally, we validate the model obtained using independent data sets and discuss our results in view of future AD biomarker development and our current understanding of the AD pathogenic process.
cognitive domains, essentially preserved activities of daily living, and absence of dementia. The cognitively normal group had Mini-Mental State Examination scores between 24 and 30 and a Clinical Dementia Rating of 0 and did not have depression, MCI, or dementia. From this pool, we studied a subsample consisting of 114 cognitively normal subjects, 200 subjects with MCI, and 102 subjects with AD who had agreed to undergo a lumbar puncture at baseline. Demographics of the study population are shown in Table 1. The last available follow-up clinical diagnosis information on this subsample was obtained from the ADNI database as of April 28, 2008 (only baseline information, n=12; completed up to 6 months, n=37; 12 months, n=297; and 24 months, n=64). A first validation analysis of the model was performed on a Belgian data set consisting of 73 subjects with an autopsyconfirmed diagnosis (65 individuals with an AD autopsy diagnosis, and 8 others showing mixed pathology that included AD), for which details have been reported.5 For the majority of these subjects, the CSF sample was taken within 1 year preceding autopsy. Of this group, valid results could be obtained from 68 subjects based on determinations of CSF A1-42, total tau, and CSF P-Tau181P concentrations with INNO-BIA AlzBio3 (Innogenetics, Gent, Belgium) (for 2 of the 73 subjects, no CSF sample was available; for 3 subjects, 1 of the 3 biomarkers gave a result outside the assay range). A second validation analysis was performed on a subset of subjects with MCI who converted to AD in a follow-up period of about 5 years (n=57), previously reported using the original biomarker values obtained with INNO-BIA AlzBio3.1
BIOMARKER DETERMINATIONS
METHODS
The CSF samples were analyzed for concentrations of A1-42, total tau, and P-Tau181P using the xMAP platform (Luminex Corp, Austin, Texas) and INNO-BIA AlzBio3 research-use-only reagents, as previously described.6-8 Only subjects with a valid test result for all 3 biomarkers were included (Table 1). Apolipoprotein E (APOE) genotyping data were obtained on each subject.
STUDY PARTICIPANTS AND DIAGNOSIS
STATISTICAL ANALYSIS
Detailed information on the patient population, including statements on appropriate approvals by the institutional review boards, is described in the original articles of the study1,5,6 (Table 1). Model building and initial validation was performed on data obtained from the Alzheimer’s Disease Neuroimaging Initiative (ADNI) database (www.loni.ucla.edu\ADNI). The ADNI was launched in 2004 to test whether imaging and biomarkers can be combined to measure the progression of MCI and early AD. Determination of sensitive and specific markers of very early AD progression is intended to aid researchers and clinicians to develop new treatments and monitor their effectiveness, as well as lessen the time and cost of clinical trials. The initial aim of ADNI was to recruit 800 adults, aged 55 to 90 years, to participate in the research: 200 cognitively normal older individuals to be followed up for 3 years, 400 people with MCI to be followed up for 3 years, and 200 people with early AD to be followed up for 2 years Briefly, the ADNI study includes 3 groups classified according to a baseline clinical assessment. The (mild) AD group had Mini-Mental State Examination scores between 20 and 26 and Clinical Dementia Ratings of 0.5 or 1.0 and met the National Institute of Neurological and Communicative Disorders and Stroke/Alzheimer’s Disease and Related Disorders Association criteria for probable AD. The MCI group had Mini-Mental State Examination scores between 24 and 30, memory complaint, Clinical Dementia Rating of 0.5, absence of impairment in other
All data analysis was performed using R version 2.6.1.9 Twocomponent mixture models of normal distributions (single biomarker) or multivariate normal distributions (2 biomarkers) were fitted.10 Briefly, mixture modeling is a 2-step iterative process based on the expectation-maximization algorithm, under the model assumption that the data at hand are a mix sampled from 2 different normal distributions. For the individual data points, the originating distribution is unknown and is treated as a latent variable. In a first E (expectation) step, the latent class membership is estimated based on random parameter estimates for the originating distributions (2 means and 2 SDs for the single biomarker analysis). The latent class information is then used (M step) to calculate better parameter estimates for the originating distributions. The process is then iterated to convergence.11 Mixture modeling was finalized with a formal evaluation of the number of components that provided the best fit to the data. Classic receiver operating characteristic analysis was performed using the R package ROCR.12 The associations between the predicted AD feature group membership and either APOE genotype or follow-up diagnosis were addressed with 2 tests or an exact alternative where appropriate. In subjects with an AD feature, biomarker levels were compared using a general linear model. Finally, recent FDA guidelines (http://www.fda.gov /downloads/MedicalDevices/DeviceRegulationandGuidance /GuidanceDocuments/UCM071287.pdf) that have tried to ad-
(REPRINTED) ARCH NEUROL / VOL 67 (NO. 8), AUG 2010 950
WWW.ARCHNEUROL.COM
©2010 American Medical Association. All rights reserved. Downloaded From: http://archneur.jamanetwork.com/ on 01/13/2013
A
B
Group 1 Group 2 Joint
150
Count
100
50
0 50
150
100
200
250
300
350
50
100
150
CSF Aβ1-42 Level, pg/mL
200
250
300
350
CSF Aβ1-42 Level, pg/mL
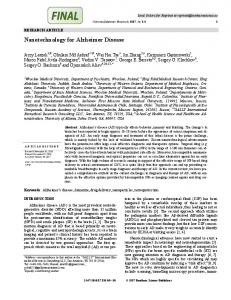
Figure 1. Mixture model classification for cerebrospinal fluid–derived -amyloid protein 1-42 (CSF A1-42). Results are presented as a histogram of observed counts overlaid with the 2 mixture distributions and the joined distribution based on the mixture proportion (A). The mixture distributions and their overlap is also shown (B).
Diagnosis normal
Count
60
Diagnosis MCI
60
50
50
50
40
40
40
30
30
30
20
20
20
10
10
10
0
0 50
100
150
200
250
300
350
Diagnosis AD
60
0 50
100
CSF Aβ1-42 Level, pg/mL
150
200
250
300
350
50
100
CSF Aβ1-42 Level, pg/mL
150
200
250
300
350
CSF Aβ1-42 Level, pg/mL
Figure 2. Cerebrospinal fluid–derived -amyloid protein 1-42 (CSF A1-42) mixture model applied to the clinically diagnosed subject groups. AD indicates Alzheimer disease; MCI, mild cognitive impairment.
dress the issue of biased estimates of diagnostic performance recommend that the terms positive percentage of agreement and negative percentage of agreement be used instead of specificity and sensitivity in cases where no gold standard (nonreference standard) is available. In the present study, 2 data sets (USADNI6 and Swedish data set1) were not autopsy confirmed, whereas 1 data set (Belgian data set5) was. Given this mix, we have retained the conventional terms sensitivity and specificity to avoid confusion. RESULTS
MIXTURE MODEL BUILDING BASED ON A SINGLE BIOMARKER (CSF A1-42) The unsupervised learning mixture modeling method simply assumes that the CSF A1-42 data are obtained from 2 populations (eg, subjects with AD and healthy controls). To identify these latent subpopulations, we initially modeled the US-ADNI data set (normal, MCI, and AD) without using the group labels. As seen in Figure 1A, a bimodal, 2-component mixture distribution fit the ac-
tual data summarized in the histogram. The mixture distribution was dominated by the first component, which covered 68% of the population. A more detailed look at the mixture components (Figure 1B) revealed that these were clearly separated. With equal weight for both distributions, an optimal decision boundary was set at 188 pg/ mL, with an overlap or incorrect classification rate of 3% on each side. Because the identified mixture components had no meaning as such, a validation step was required for biological interpretation. A straightforward approach was to assess the mixture proportions in the subject groups clinically diagnosed as being normal or having MCI or AD (Figure 2). In the AD subgroup, the mixture proportion of component 1 was 90%, strongly suggesting that this component can be considered as bearing the AD signature and thereby making component 2 the healthy signature. The AD signature mixture proportion was 73% and 39% in the MCI and normal groups, respectively. Using the mixture model, it was reasonable to select a cutoff value of 188 pg/mL, which in a classic receiver operating characteristic analysis (Figure 3) yielded 91% sensitivity (91
(REPRINTED) ARCH NEUROL / VOL 67 (NO. 8), AUG 2010 951
WWW.ARCHNEUROL.COM
©2010 American Medical Association. All rights reserved. Downloaded From: http://archneur.jamanetwork.com/ on 01/13/2013
of 100) and 62% specificity (71 of 114). A straightforward selection of a decision criterion that balanced sensitivity and specificity by minimizing the difference between both performance characteristics yielded a cutoff value of 159 pg/mL with 74% sensitivity (74 of 100) and 75% specificity (86 of 114).
to the number of biomarkers (eg, bivariate normal for 2 biomarkers). Following earlier reports,1,13 we combined CSF A1-42 concentration with either CSF total tau and/or CSF P-Tau181P concentration, with both tau biomarkers log transformed before analysis to improve normality. The model fit, indicating Akaike Information Criterion (AIC) was 4137 for the combined CSF A1-42/CSF P-Tau181P mixture model and 4163 for the combined CSF A1-42/CSF total tau mixture model. With lower AIC values indicating a relatively better fit, this implies that a combined CSF A1-42/CSF P-Tau181P mixture model is the most adequate of the 2 combinations. In any case, both combined models are superior to the simple CSF A1-42 model that yielded an AIC of 4356. This was confirmed by tests for significance of regression coefficients in the combined CSF A1-42/CSF P-Tau181P mixture model (weighted generalized linear model fitted to each component with the posterior probabilities as weights). Highly significant contributions for both CSF A1-42 and CSF P-Tau181P in both components of the mixture model were found (all P values ⬍.001). Future evaluation of the possible additional utility of a mixture model containing all 3 biomarkers should be performed on a data set containing subjects with different dementia diagnoses. To finalize the mixture modeling process, a combined CSF A1-42/CSF P-Tau181P mixture model was fitted to the data with the number of components ranging from 1 to 5. Again, AIC was applied to evaluate model fit and select the optimal number of components. The combined CSF A1-42/CSF P-Tau181P mixture model with 2 components revealed the lowest AIC (4138, 4139, and 4289 for 2 [CSF A1-42/CSF P-Tau181P], 3, and 1 [CSF A1-42] component, respectively) and was selected as the final mixture model. The combined CSF A1-42/CSF P-Tau181P mixture model showed a mixture proportion of 66% and 34% for the 2 signatures in the complete data set. A breakdown of these signatures over the subject groups (Figure 4) revealed that signature 1 (red in Figure 4) can be considered the AD signature. On classifying subjects based on the combined CSF A1-42/CSF P-Tau181P mixture model, 41
EXTENDING THE MIXTURE MODEL FOR MULTIPLE BIOMARKERS The simple mixture model outlined earlier can easily be extended to include multiple biomarkers. When applied this way, one then considers a mixture of multivariate normal distributions, with the multivariate dimension equal 1.0
188 pg/mL 159 pg/mL
True-Positive Rate
0.8
0.6
0.4
0.2
AUC = 0.803
0 0.0
0.4
0.2
0.8
0.6
1.0
False-Positive Rate
Figure 3. Receiver operating characteristic curve analysis for cerebrospinal fluid–derived -amyloid protein 1-42 (CSF A1-42)–based identification of Alzheimer disease (AD). Sensitivity (“true-positive rate”) was assessed in the AD group, and specificity (“false-positive rate”) was assessed in the normal group. AUC indicates area under the curve. Numbers with arrows indicate optimal decision boundaries (1) obtained with classic receiver operating characteristic analysis and minimizing the difference between sensitivity and specificity (159 pg/mL) and (2) between 2 components identified by unsupervised mixture modeling (188 pg/mL).
CSF P-Tau181P Level, pg/mL (Log Transformed)
Normal (n = 114)
MCI (n = 196)
AD (n = 100)
2.0
2.0
2.0
1.8
1.8
1.8
1.6
1.6
1
1.4
1.6
1
1.4
1.4
2
2
2
1.2
1.2
1.2
1.0
1.0
1.0
50
100
150
200
250
CSF Aβ1-42 Level, pg/mL
1
300
50
100
150
200
250
300
50
CSF Aβ1-42 Level, pg/mL
100
150
200
250
300
CSF Aβ1-42 Level, pg/mL
Figure 4. A combined cerebrospinal fluid–derived -amyloid protein 1-42 (CSF A1-42)/CSF phosphorylated tau181P (CSF P-Tau181P) mixture model applied to the subject groups. Densities of each signature are represented with confidence ellipses, and signature membership of the subject based on the mixture is indicated with the corresponding color (signature 1 is the Alzheimer disease [AD] signature [red]; signature 2 is the healthy signature [green]). MCI indicates mild cognitive impairment.
(REPRINTED) ARCH NEUROL / VOL 67 (NO. 8), AUG 2010 952
WWW.ARCHNEUROL.COM
©2010 American Medical Association. All rights reserved. Downloaded From: http://archneur.jamanetwork.com/ on 01/13/2013
CSF P-Tau181P Level, pg/mL (Log Transformed)
A
B 2.0
2.0
1.8
1.8
1.6
1.6
1
1
1.4
1.4
2
2 1.2
1.2
1.0
1.0
50
100
150
200
250
50
300
100
200
150
250
300
CSF Aβ1-42 Level, pg/mL
CSF Aβ1-42 Level, pg/mL
Figure 5. Validation of the combined cerebrospinal fluid–derived -amyloid protein 1-42 (CSF A1-42)/CSF phosphorylated tau181P (CSF P-Tau181P) mixture model in 2 data sets. A, Patients with mild cognitive impairment who developed Alzheimer disease within 5 years after the CSF sample.2 B, Patients with autopsy-confirmed Alzheimer disease with mostly less than 1 year between CSF sample and autopsy (n = 68).12 Signature 1 is the Alzheimer disease signature (red); signature 2 is the healthy signature (green).
Table 2. Association Between CSF A1-42/ CSF P-Tau181P Mixture Model Classification and Diagnostic Follow-up Broken Down by Diagnosis at Baseline Latest Follow-up Diagnosis, No. (%) Diagnosis at Baseline Normal MCI AD
Mixture Model Classification
Normal
MCI
AD Healthy AD Healthy AD Healthy
37 (91) 71 (99) 2 (1) 3 (6) 0 0
3 (8) 1 (1) 100 (73) 42 (82) 0 0
AD
P Value for Association a
0 0 35 (26) 6 (12) 88 (100) 10 (100)
.13 .04 ⬎.99
Abbreviations: AD, Alzheimer disease; CSF A1-42, cerebrospinal fluid–derived -amyloid protein 1-42; CSF P-Tau181P, cerebrospinal fluid–derived phosphorylated tau181P; MCI, mild cognitive impairment. a Fisher exact test.
of 114 normal subjects (36%) could be allocated to the AD signature, which also was found in 142 of 196 subjects with MCI (72%) and 90 of 100 subjects with AD (90%). This corresponds to classic sensitivity and specificity estimates of 90% and 64%, respectively. These results indicate that the combined CSF A1-42/ CSF P-Tau181P mixture model (with better AIC) provides a similar decision as compared with the simple CSF A1-42 mixture model. The lower AIC reflects a better separation between the 2 signatures in 2 dimensions (Figure 4) as compared with the single dimension (Figure 2), probably making the CSF A1-42/CSF P-Tau181P approach more robust. VALIDATING THE SINGLE AND MULTIPLE MIXTURE MODELS Because of their essentially diagnosis-independent origin, mixture models are less sensitive to overfitting, making independent validation less of an issue. Nevertheless, we explored the validity of the CSF A1-42 and CSF A1-42/
CSF P-Tau181P mixture models in 2 independent studies. For the sensitivity aspect, both mixture models showed a sensitivity of 57 of 57 subjects with MCI (100%) progressing to AD over the next 5 years (derived from Hansson et al1) (Figure 5A), while sensitivity for autopsy-confirmed cases5 was 63 of 68 (93%) and 64 of 68 (94%) for CSF A1-42 and CSF A1-42/CSF P-Tau181P mixture models, respectively (Figure 5B). From the 4 misclassifications in the latter study, 1 was completely in the center of the control feature, whereas 3 were results that were not likely to belong to either the AD or the healthy feature. Both of these data sets included a population with slightly lower CSF A1-42 levels and higher CSF P-Tau181P levels as compared with the typical AD signature in the ADNI data. In addition, we investigated the relation between the CSF A1-42/CSF P-Tau181P mixture model and the diagnostic evolution (Table 2). Although there were few differences between follow-up diagnosis and baseline diagnosis in this short (mostly 1-year) follow-up period, there was a tendency for more progression to MCI in cognitively normal
(REPRINTED) ARCH NEUROL / VOL 67 (NO. 8), AUG 2010 953
WWW.ARCHNEUROL.COM
©2010 American Medical Association. All rights reserved. Downloaded From: http://archneur.jamanetwork.com/ on 01/13/2013
subjects with the AD feature as compared with cognitively normal subjects with the healthy feature (P=.13). Subjects with MCI with the AD feature were more likely to progress to AD and less likely to regress to cognitively normal as compared with subjects with MCI with the healthy feature (P=.04). In all cases, the evolution observed was consistent with the mixture model classification. CHARACTERIZING COGNITIVELY NORMAL SUBJECTS WITH AN AD FEATURE To better understand the 36% of cognitively normal subjects who had the CSF A1-42/CSF P-Tau181P mixture model AD feature (Figure 4), this subpopulation was characterized in more detail. With respect to common risk factors, there was no evidence for differences between cognitively normal subjects with the AD feature or healthy feature for age (P=.17, t test), Mini-Mental State Examination score (P=.51, t test), or sex (P=.92; Fisher exact test). However, there was a clear association (Table 3) between mixture model feature and APOE genotype in cognitively normal subjects (P⬍.001, Fisher exact test), with the odds for having an APOE ε4 allele in the AD cluster being 6.88 times (95% confidence interval, 2.46-20.92) the odds for having an APOE ε4 allele in the non-AD cluster. In other words, the population of cognitively normal individuals classified as having an AD biomarker signature was significantly enriched in APOE ε4 carriers. In addition, a comparison of CSF A1-42 and CSF P-Tau181P biomarker levels between cognitively normal subjects and subjects with MCI and AD having the AD mixture model feature re-
Table 3. Association Between Mixture Model Classification and APOE Genotype in Normal Subjects From the US-ADNI Study a APOE Genotype, Count (%)
Cluster AD Non-AD Total
No 4 Allele
1 or 2 4 Alleles
Total
22 (54) 65 (89) 87
19 (46) 8 (11) 27
41 73 114
Abbreviations: AD, Alzheimer disease; APOE, apolipoprotein E; US-ADNI, US Alzheimer’s Disease Neuroimaging Initiative. a More detailed information on the study population is described in Shaw et al.6
vealed no evidence for differences between the diagnosis groups for CSF A1-42 (P =.17) but a clear difference (P⬍ .001) for CSF P-Tau181P. Contrasting the clinical diagnosis group averages (for subjects with the AD feature) with the mixture model averages (Table 4) revealed that the CSF A1-42 component was nearly complete (reaching AD feature average) in cognitively normal subjects, while the CSF P-Tau181P component was roughly halfway between the healthy and AD stage. COMMENT
On introducing a mixture modeling approach to characterize AD biomarkers using the US-ADNI data set without relying on clinical information, the model identified 2 distinct signatures in the data: 1 related to an AD group and the other to a non-AD group. Thus, the AD signature appears to be “naturally” present in the data and is expressed as a homogenous group, consistent with a single pathological process underlying AD. The signature was observed for a mixture model based on CSF A1-42 concentration only, as well as for a combined CSF A1-42/CSF P-Tau181P mixture model. Both models were equally able to classify subjects, but the somewhat better fit of the combined model suggests it might allow a more robust classification. The features of the AD signature—reduced CSF A1-42 and increased CSF P-Tau181P concentrations—are consistent with previous findings.1,5 Remarkably, the cutoff of 188 pg/mL selected in the mixture model based on CSF A1-42 concentration only is quite similar to the value of 192 pg/mL determined by Shaw et al6 by receiver operating characteristic analyses of an ADNI-independent set of premortem CSF samples obtained from subjects with autopsy-based AD and age-matched controls. As compared with Shaw et al,6 our cutoff value was obtained without using diagnostic information and also incorporated the full data set rather than being restricted to the AD and cognitively normal groups. Both approaches can thus be considered as independent, mutually validating the results obtained. To further verify our findings, validation of the combined CSF A1-42/CSF P-Tau181P mixture model was carried out in 2 independent data sets. This confirmed its sensitivity with estimates of 100% in a population of patients with MCI evolving to AD within 5 years and 94% in a population of autopsy-confirmed AD cases. It also appeared that those subjects with a more advanced AD stage appeared
Table 4. CSF A1-42 and CSF P-Tau181P Biomarker Levels in Subjects With the AD Mixture Model Feature Contrasted With the Mean Values of the Mixture Model Feature Mean (% AD Trajectory), pg/mL Mixture Model Feature
CSF A1-42 concentration CSF P-Tau181P concentration (log transformed)
Clinical Diagnosis Group for Subjects With AD Feature
Healthy
AD
Normal
MCI
AD
239 1.28
135 1.57
142 (93) 1.46 (62)
134 (101) 1.58 (103)
133 (102) 1.60 (110)
Abbreviations: AD, Alzheimer disease; CSF A1-42, cerebrospinal fluid–derived -amyloid protein 1-42; CSF P-Tau181P, cerebrospinal fluid–derived phosphorylated tau181P.
(REPRINTED) ARCH NEUROL / VOL 67 (NO. 8), AUG 2010 954
WWW.ARCHNEUROL.COM
©2010 American Medical Association. All rights reserved. Downloaded From: http://archneur.jamanetwork.com/ on 01/13/2013
to have higher CSF P-Tau181P levels as compared with the AD signature in the ADNI population. This finding is consistent with an observed CSF P-Tau181P level increase during cognitive decline and dementia.14 It also suggests an intrinsically different role for the 2 biomarkers in the mixture model, with CSF A1-42 as an initial marker and CSF P-Tau181P as a subsequent stage marker related to dementia symptoms and disease progression. This could also imply that CSF A1-42 is the initial driver of AD pathology and that changes in CSF total tau and/or CSF P-Tau181P concentrations are a secondary effect, although other interpretations are possible since CSF tau concentration is not elevated in all neurodegenerative tauopathies.15 The view that A1-42 changes occur earlier than tau pathology is further corroborated by (1) follow-up studies showing that reduction of CSF A1-42 concentration predicts cognitive decline and incident dementia in healthy elderly individuals before observed increases in CSF total tau or CSF P-Tau181P concentrations,16-18 (2) genetic data showing that polymorphisms in the tau-encoding MAPT gene influence CSF tau levels only in individuals with low CSF A1-42 concentration,19 and (3) repeated Pittsburgh Compound B positron emission tomography on patients with AD showed no increased amyloid load in the brain with time.20 A salient outcome of the mixture modeling approach is the presence of an AD signature in more than onethird of cognitively normal subjects (39% based on CSF A1-42 concentration only; 36% based on the combined model). This is not surprising because many neuropathological studies on cognitively normal elderly individuals reveal that a large portion of healthy elderly individuals exhibit amyloid-containing plaques and taucontaining neurofibrillary tangles in their brains.21,22 Moreover, Pittsburgh Compound B positron emission tomography studies show that many healthy elderly controls also exhibit increased A levels in their brains.23,24 Furthermore, this finding is directly supported by the enrichment of APOE ε4 carriers, a well-characterized risk factor for AD.25 It also reflects the documented decline of CSF A1-42 concentration with age in cognitively normal APOE ε4 carriers26 and underscores the presence of AD pathology before the onset of symptoms. Nevertheless, such findings will need to be confirmed in subsequent studies that include cognitively normal subjects who can be followed up for possibly 10 years or more. In summary, the analytical approach reported herein demonstrates that mixture modeling provides valuable insights for biomarker assessment in the field of AD. The unsupervised learning method that downplays the clinical diagnosis paints a different picture than clinical diagnostic methods and suggests that AD pathology is active considerably earlier than has heretofore been envisioned. Thus, taken together, these data provide further support for the view that revision of current diagnostic criteria4 for AD is needed, or at least as far as early-stage AD is concerned. Accepted for Publication: November 12, 2009. Author Affiliations: Stat-Gent CRESCENDO, Department of Applied Mathematics and Computer Science, Ghent University (Dr De Meyer), and Innogenetics NV (Mr Shapiro and Drs Vanderstichele, Vanmechelen, and Coart), Gent, and Department of Neurology and Memory
Clinic, Middelheim General Hospital and Institute BornBunge, University of Antwerp, Antwerp (Drs Engelborghs and De Deyn), Belgium; Clinical Memory Research Unit, Department of Clinical Sciences, Lund University, Malmö (Drs Hansson and Minthon), and Institute of Neuroscience and Physiology, Department of Psychiatry and Neurochemistry, the Sahlgrenska Academy at University of Gothenburg, Molndal (Drs Zetterberg and Blennow), Sweden; and Department of Pathology and Laboratory Medicine, Institute on Aging, Alzheimer’s Disease Center, Center for Neurodegenerative Disease Research, University of Pennsylvania School of Medicine, Philadelphia (Drs Shaw and Trojanowski). Correspondence: Hugo Vanderstichele, PhD, Innogenetics, Industriepark Zwijnaarde 7, Box 4, B-9052 Gent, Belgium (
[email protected]). Author Contributions: Study concept and design: De Meyer, Shapiro, and Trojanowski. Acquisition of data: Engelborghs, De Deyn, Hansson, Minthon, Zetterberg, Shaw, and Trojanowski. Analysis and interpretation of data: De Meyer, Shapiro, Vanderstichele, Vanmechelen, Coart, Zetterberg, Blennow, Shaw, and Trojanowski. Drafting of the manuscript: De Meyer, Shapiro, Vanderstichele, Coart, Shaw, and Trojanowski. Critical revision of the manuscript for important intellectual content: De Meyer, Shapiro, Vanmechelen, Engelborghs, De Deyn, Coart, Hansson, Minthon, Zetterberg, Blennow, Shaw, and Trojanowski. Statistical analysis: De Meyer, Coart, Shaw, and Trojanowski. Obtained funding: Trojanowski. Administrative, technical, and material support: Shapiro, Vanderstichele, Coart, Minthon, Zetterberg, Shaw, and Trojanowski. Study supervision: Vanderstichele, Blennow, Shaw, and Trojanowski. Financial Disclosure: Drs Vanderstichele, Vanmechelen, and Coart are employees of the company Innogenetics (now part of Solvay-Pharma). Dr De Meyer was a former employee of Innogenetics. Funding/Support: This work was supported mainly by ADNI grant U01 AG024904. Disclaimer: Data used in the preparation of this article were partly obtained from the ADNI database. As such, ADNI investigators (www.loni.ucla.edu\ADNI\Collaboration \ADNI_Authorship_list.pdf) contributed to the design and implementation and/or provided data but did not participate in the analysis or writing of this report. Additional Contributions: We thank the ADNI colleagues for contributions to the work summarized herein. REFERENCES 1. Hansson O, Zetterberg H, Buchhave P, Londos E, Blennow K, Minthon L. Association between CSF biomarkers and incipient Alzheimer’s disease in patients with mild cognitive impairment: a follow-up study. Lancet Neurol. 2006;5(3):228234. 2. Ray S, Britschgi M, Herbert C, et al. Classification and prediction of clinical Alzheimer’s diagnosis based on plasma signalling proteins. Nat Med. 2007;13 (11):1359-1362. 3. Shaw LM, Korecka M, Clark CM, Lee VM, Trojanowski JQ. Biomarkers of neurodegeneration for diagnosis and monitoring therapeutics. Nat Rev Drug Discov. 2007;6(4):295-303. 4. Dubois B, Feldman HH, Jacova C, et al. Research criteria for the diagnosis of Alzheimer’s disease: revising the NINCDS-ADRDA criteria. Lancet Neurol. 2007; 6(8):734-746. 5. Engelborghs S, De Vreese K, Van de Casteele T, et al. Diagnostic performance of
(REPRINTED) ARCH NEUROL / VOL 67 (NO. 8), AUG 2010 955
WWW.ARCHNEUROL.COM
©2010 American Medical Association. All rights reserved. Downloaded From: http://archneur.jamanetwork.com/ on 01/13/2013
6.
7.
8.
9. 10. 11. 12. 13. 14.
15. 16.
a CSF-biomarker panel in autopsy-confirmed dementia. Neurobiol Aging. 2008; 29:1143-1159. Shaw LM, Vanderstichele H, Knapik-Czajka M, et al; Alzheimer’s Disease Neuroimaging Initiative. Cerebrospinal fluid biomarker signature in Alzheimer’s disease neuroimaging initiative subjects. Ann Neurol. 2009;65(4):403-413. Olsson A, Vanderstichele H, Andreasen N, et al. Simultaneous measurement of beta-amyloid(1-42), total tau, and phosphorylated tau (Thr181) in cerebrospinal fluid by the xMAP technology. Clin Chem. 2005;51(2):336-345. Vanderstichele H, Demeyer L, De Roo K, et al. Standardized multiparameter quantification of biomarkers for Alzheimer’s disease in cerebrospinal fluid. In: Fisher A, Hanin I, Memo M, Stocchi F, eds. New Trends in Alzheimer and Parkinson Related Disorders: ADPD 2005. Bologna, Italy: Medimond Srl; 2005:183-189. R Development Core Team. R: A Language and Environment for Statistical Computing. Vienna, Austria: R Foundation for Statistical Computing; 2007. Gruen B, Leisch F. Fitting finite mixtures of generalized linear regressions in R. Comput Stat Data Anal. 2007;51(11):5247-5252. Hastie T, Tibshirani R, Friedman J. The Elements of Statistical Learning. New York, NY: Springer-Verlag; 2001. Sing T, Sander O, Beerenwinkel N, Lengauer T. ROCR: visualizing classifier performance in R. Bioinformatics. 2005;21(20):3940-3941. Hulstaert F, Blennow K, Ivanoiu A, et al. Improved discrimination of AD patients using beta-amyloid (1-42) and tau levels in CSF. Neurology. 1999;52(8):1555-1562. Andersson C, Blennow K, Almkvist O, et al. Increasing CSF phospho-tau levels during cognitive decline and progression to dementia. Neurobiol Aging. 2008; 29(10):1466-1473. Bian H, Van Swieten JC, Leight S, et al. CSF biomarkers in frontotemporal lobar degeneration with known pathology. Neurology. 2008;70(19, pt 2):1827-1835. Skoog I, Davidsson P, Aevarsson O, Vanderstichele H, Vanmechelen E, Blennow K. Cerebrospinal fluid beta-amyloid 42 is reduced before the onset of sporadic dementia: a population-based study in 85-year-olds. Dement Geriatr Cogn Disord. 2003;15(3):169-176.
17. Stomrud E, Hansson O, Blennow K, Minthon L, Londos E. Cerebrospinal fluid biomarkers predict decline in subjective cognitive function over 3 years in healthy elderly. Dement Geriatr Cogn Disord. 2007;24(2):118-124. 18. Gustafson DR, Skoog I, Rosengren L, Zetterberg H, Blennow K. Cerebrospinal fluid beta-amyloid 1-42 concentration may predict cognitive decline in older women. J Neurol Neurosurg Psychiatry. 2007;78(5):461-464. 19. Kauwe JS, Cruchaga C, Mayo K, et al. Variation in MAPT is associated with cerebrospinal fluid tau levels in the presence of amyloid-beta deposition. Proc Natl Acad Sci U S A. 2008;105(23):8050-8054. 20. Engler H, Forsberg A, Almkvist O, et al. Two-year follow-up of amyloid deposition in patients with Alzheimer’s disease. Brain. 2006;129(pt 11):2856-2866. 21. Lin H, McCulloch CE, Turnbull BW, Slate EH, Clark LC. A latent class mixed model for analysing biomarker trajectories with irregularly scheduled observations. Stat Med. 2000;19(10):1303-1318. 22. Davis DG, Schmitt FA, Wekstein DR, Markesbery WR. Alzheimer neuropathologic alterations in aged cognitively normal subjects. J Neuropathol Exp Neurol. 1999;58(4):376-388. 23. Fagan AM, Mintun MA, Mach RH, et al. Inverse relation between in vivo amyloid imaging load and cerebrospinal fluid Abeta42 in humans. Ann Neurol. 2006; 59(3):512-519. 24. Pike KE, Savage G, Villemagne VL, et al. Beta-amyloid imaging and memory in non-demented individuals: evidence for preclinical Alzheimer’s disease. Brain. 2007;130(pt 11):2837-2844. 25. Farrer LA, Cupples LA, Haines JL, et al; APOE and Alzheimer Disease Meta Analysis Consortium. Effects of age, sex, and ethnicity on the association between apolipoprotein E genotype and Alzheimer disease: a meta-analysis. JAMA. 1997; 278(16):1349-1356. 26. Peskind ER, Li G, Shofer J, et al. Age and apolipoprotein E*4 allele effects on cerebrospinal fluid -amyloid 42 in adults with normal cognition. Arch Neurol. 2006;63(7):936-939.
Announcement Topic Collections. Archives offers collections of articles in specific topic areas to make it easier for physicians to find the most recent publications in a field. These are available by subspecialty, study type, disease, or problem. In addition, you can sign up to receive a Collection E-Mail Alert when new articles on specific topics are published. Go to http://archneur.ama-assn.org /collections to see these collections of articles.
(REPRINTED) ARCH NEUROL / VOL 67 (NO. 8), AUG 2010 956
WWW.ARCHNEUROL.COM
©2010 American Medical Association. All rights reserved. Downloaded From: http://archneur.jamanetwork.com/ on 01/13/2013