Sep 21, 2017 - [111] S. Friel, L. J. Barosh, and M. Lawrence, âTowards healthy and ... [123] M. S. Tom, B. S. Paul Fischbeck, and B. T. Chris Hendrickson, ...
DIETARY PATTERN-INDUCED GREENHOUSE GAS EMISSION AND WATER FOOTPRINT ESTIMATIONS IN TURKEY
A THESIS SUBMITTED TO THE GRADUATE SCHOOL OF NATURAL AND APPLIED SCIENCES OF MIDDLE EAST TECHNICAL UNIVERSITY
BY DENİZ BAŞOĞLU ACET
IN PARTIAL FULFILLMENT OF THE REQUIREMENTS FOR THE DEGREE OF MASTER OF SCIENCE IN EARTH SYSTEM SCIENCE
SEPTEMBER 2017
ii
Approval of the thesis:
DIETARY PATTERN-INDUCED GREENHOUSE GAS EMISSION AND WATER FOOTPRINT ESTMATIONS IN TURKEY submitted by DENİZ BAŞOĞLU ACET in partial fulfillment of the requirements for the degree of Master of Science in Earth System Science, Middle East Technical University by, Prof. Dr. Gülbin Dural Ünver _____________________ Dean, Graduate School of Natural and Applied Sciences Prof. Dr. Ayşen Yılmaz Head of Program, Earth System Science, METU
_____________________
Prof. Dr. Meryem Beklioğlu Supervisor, Biology Dept. and ESS, METU
_____________________
Prof. Dr. Hami Alpas Co-Supervisor, Food Eng. Dept. and ESS, METU
_____________________
Examining Committee Members: Prof. Dr. Ayşen Yılmaz Inst. of Marine Sciences and ESS, METU
_____________________
Prof. Dr. Meryem Beklioğlu Supervisor, Biology Dept. and ESS, METU
_____________________
Prof. Dr. Gaye Teksöz _____________________ Dept. of Elementary and Early Childhood Edu., METU Prof. Dr. Murat Baş Nutrition and Dietetics Dept., Acıbadem University
____________________
Assoc. Prof. Dr. Gülhan Samur Nutrition and Dietetics Dept., Hacettepe University
_____________________
Date: 21.09.2017
I hereby declare that all information in this document has been obtained and presented in accordance with academic rules and ethical conduct. I also declare that, as required by these rules and conduct, I have fully cited and referenced all material and results that are not original to this work.
Name, Last name
: Deniz, BAŞOĞLU ACET
Signature
: iv
ABSTRACT
DIETARY PATTERN-INDUCED GREENHOUSE GAS EMISSION AND WATER FOOTPRINT ESTMATIONS IN TURKEY Başoğlu Acet, Deniz MSc., Earth System Science (ESS) Supervisor: Prof. Dr. Meryem Beklioğlu
September 2017, 147 pages
The recent studies in literature established a link between diets and several environmental impacts. As the environmental implications of commonly followed diets in Turkey have not been previously studied, the general aim of this study is to estimate the environmental impacts of the average dietary patterns in Turkey from 1960 to 2050 through quantification of water footprint and greenhouse gas emissions and to evaluate the health implications of those dietary patterns. With this exploratory study, all dietary scenarios created were evaluated for their water footprint, using the water footprint assessment methodology and greenhouse gas emissions, using the average Mediterranean greenhouse gas emission factors; which were compiled from life cycle assessment studies in literature. The health implications of the dietary scenarios were qualitatively assessed by using the dietary guidelines and recent epidemiological studies, which provide causal relationships between nutrition and dietary indicators and health outcomes. Moreover, two healthy dietary scenarios were constructed based on the recent Turkey Dietary Guidelines and the Mediterranean recommendations in order to evaluate the environmental and health implications of all dietary scenarios for Turkey. v
Results of this study showed that the environmental impact of food consumption in Turkey is lower than the environmental impact associated with average European and Mediterranean food consumption. In addition, the future diet-related GHG emissions and water footprint are not expected to exceed the average environmental impacts associated with average diets in Europe or other developed regions. However, the dietary scenarios for the current as well as future food consumption in Turkey did not reveal adherence to nutritional guidelines and resulted in lower health scores in comparison with the dietary guidelines and the Mediterranean Diet. The dietary scenario created based on the dietary guidelines performed best in terms of health implications whereas, it was the most environmentally burdensome dietary scenario. The Mediterranean-based dietary scenario, on the other hand, performed second in terms of health score and it performed best in terms of greenhouse gas emissions and water footprint. In line with other studies, the increasing share of animal-oriented foods in the dietary scenarios increase the associated greenhouse gas and water footprint emissions. This study followed an interdisciplinary approach to combine nutritional and environmental research in order to provide an opportunity to formulate an environmentally friendly, healthy, socially and economically acceptable diet; which corresponds to the sustainable diet for Turkey. Despite all the outlined key limitations in this diet-related environmental study, it is expected to provide a useful basis for future studies in both environment and nutrition in Turkey.
Key Words: greenhouse gas emissions, water footprint assessment, life cycle assessment, health implications of diets, dietary guidelines, dietary patterns
vi
ÖZ
TÜRKİYE’DE YAYGIN OLAN BESLENME ÖRÜNTÜLERİNE İLİŞKİN SERA GAZI EMİSYONLARI VE SU AYAK İZİ DEĞERLENDİRMESİ
Başoğlu Acet, Deniz Yüksek Lisans, Yer Sistem Bilimleri EABD Tez Yöneticisi: Prof. Dr. Meryem Beklioğlu
Eylül 2017, 147 sayfa
Çevresel etki analizi literatüründe gerçekleştirilen son çalışmalar, beslenme ve diyet örüntüleri ile çok çeşitli çevresel etkiler arasındaki ilişkiyi ortaya koymaktadır. Türkiye’de yaşayan ortalama bir kişinin, diyet örüntüsü ve beslenmesine ilişkin çevresel etkilerin henüz araştırılmamış olması nedeniyle; bu çalışma 1960 yılından günümüze ve daha sonar 2050’ye ortalama gıda tüketimin su ayak izi ve sera gazı emisyonlarını hesaplamayı hedeflemektedir. Beslenme ve diyet örüntülerinin sağlıkla yakın ilişkisi göz önünde bulundurulduğunda, çevresel etki ile birlikte sağlık üzerindeki etkilerin de değerlendirilmesi temel hedeflerden biri haline gelmiştir. Bu çalışma dahilinde, oluşturulan tüm diyet senaryoları, su ayak izi yaklaşımı ve faktörleri ile, literatürde bulunan yaşam döngüsü analizi çalışmaları derlemesi sonucu elde edilen ortalama Akdeniz sera gazı emisyon faktörleri kullanılarak, çevresel etkileri bakımından değerlendirilmiştir. Diyet senaryolarının sağlık üzerindeki etkilerinin niteliksel olarak değerlendirilmesi için, Türkiye’ye özel hazırlanan diyet önerileri kılavuzu ve son zamanlarda gerçekleştirilen ve beslenme, diyet göstergeleri ile sağlık arasındaki nedensel ilişkiyi ortaya koyan epidemiyolojik araştırmalardan faydalanılmıştır. Bunun yanı sıra, Türkiye Beslenme Rehberi ve vii
Akdeniz Diyeti önerileri temel alınarak, iki farklı sağlıklı diyet senaryosu oluşturmak yoluyla, ortalama tüketimi yansıtan diğer diyet senaryoları hem sağlık hem de çevresel etki bakımından karşılaştırılmıştır. Bu çalışmanın sonuçları, Türkiye'de gıda tüketiminin çevresel etkisinin, Avrupa ve Akdeniz ortalamalardan daha düşük olduğunu ortaya koymuştur. Buna ek olarak, 2050 yılı için öngörülen diyetle ilişkili sera gazı emisyonları ve su ayak izinin, Avrupa ya da diğer gelişmiş ülkelerdeki mevcut ortalama diyetle ilişkili çevresel etkileri aşmadığı tespit edilmiştir. Ancak, Türkiye'de mevcut gıda tüketimini gösterir diyet senaryoları, beslenme önerilerinden önemli ölçüde farklılaşmaktadır ve bu nedenle, diğer iki sağlıklı diyet senaryosu ile karşılaştırıldığında, daha düşük sağlık skorları elde edilmektedir. Türkiye Beslenme Rehberi’ne dayalı olarak oluşturulan diyet senaryosu, sağlık puanı açısından en iyi sonucu vermesine rağmen, en yüksek çevresel etkiye sahip diyet senaryosu olmuştur. Öte yandan, Akdeniz Diyeti önerileri temel alınarak hazırlanan diyet senaryosu ise sağlık puanı açısından ikinci sırada yer almış ve sera gazı emisyonları ile su ayak izi açısından en iyi performansı göstermiştir. Literatürde yer alan diğer çalışmalar ile uyumlu olarak, diyet senaryolarında hayvansal gıdaların artan payı ile sera gazı ve su ayak izi emisyonlarının arttığı gözlemlenmiştir. Bu çalışma, disiplinler arası bir yaklaşım ile; beslenme ve çevresel etki araştırmalarını bilimsel yaklaşımlar yoluyla birleştirerek, Türkiye için sağlıklı, çevre dostu ve hem ekonomik hem de sosyal açıdan kabul edilebilir bir diyet önerisinin geliştirilmesine katkı sağlamaktadır. Bu ve daha sonar yapılacak olan çalışmalar ile Türkiye için bir sürdürülebilir diyet önerisi hazırlanması mümkündür. Araştırma süresince kullanılan yöntem ve araçlara ilişkin tüm kısıtlara rağmen, bu çalışmanın hem çevre hem de beslenme alanında gerçekleştirilecek diğer çalışmalara yararlı bir temel oluşturması beklenmektedir. Anahtar Kelimeler: sera gazı emisyonları, su ayak izi değerlendirmesi, yaşam döngüsü değerlendirmesi (analizi), diyetlerin sağlık üzerindeki etkileri, beslenme önerileri, beslenme örüntüleri viii
To my precious family and my dear husband…
“Knowing is not enough; we must apply. Willing is not enough; we must do.” — Goethe
ix
AKNOWLEDGEMENTS
I would first like to thank to my supervisor Prof. Dr. Meryem Beklioğlu, who always inspired me with her immense knowledge. I cannot thank her enough for accepting me as her student, supporting and guiding me throughout this study. She always encouraged me in creating this study as my own work, but also led me in the right direction whenever she thought I needed it. I also wish to express my heartfelt gratefulness to my co-supervisor, Prof. Dr. Hami Alpas for his complete guidance, motivation and patience, to Prof. Dr. Ayşen Yılmaz, for providing me an invaluable encouragement every time I need and to Prof. Dr. Sevil Başoğlu for patiently guiding me in diet and health-related areas of this thesis. Furthermore, I would like to thank to the rest of my thesis committee, Prof. Dr. Gaye Teksöz, Prof. Dr. Murat Baş and Assoc. Prof. Dr. Gülhan Samur for their invaluable contributions and comments. Finally, I must express my very profound gratitude and love to my precious grandmother Nebahat Samur, mothers, Prof. Dr. Sevil Başoğlu and Ergül Acet, to my dear fathers, Eyyüp Ümit Başoğlu and Recep Tekin Acet; who are watching us over all the time, and my dear husband & best friend Cemil Acet for his sincere love and friendship and providing me continuous support and encouragement throughout my life and through the process of researching and writing this thesis. Speaking of friendship, I would love to express my profound thanks to Dr. Asmin Kavas for her endless support, who always embellished my life; to Gökçe Durgut who never let me down through thick and thin, to Gökhan Urul for his intelligence, chitchats full of ideas and encouraging guidance, to Dr. Semih Dikkatli for believing in me before I do, to Serkan Naneci for his friendship and impressive ideas on shaping this study, to Yeliz Galioğlu for her tirelessly help and her cheering smile, and to all people who has great and small impact on making me who I am. This accomplishment would not have been possible without them….
x
TABLE OF CONTENTS
ABSTRACT................................................................................................................. v ÖZ .............................................................................................................................. vii AKNOWLEDGEMENTS ........................................................................................... x TABLE OF CONTENTS............................................................................................ xi LIST OF TABLES .................................................................................................... xiv LIST OF FIGURES .................................................................................................. xvi LIST OF ABBREVIATIONS .................................................................................... xx CHAPTERS 1. INTRODUCTION ................................................................................................. 1 1.1 Sustainability in Food Systems and Diets .................................................. 1 1.2 Greenhouse Gas Emission Estimates with Life Cycle Approaches ........... 6 1.3 Water Footprint Assessment of Food Consumption ................................ 10 1.4 The Construction of Dietary Scenarios to Assess the Environmental Impacts ........................................................................................................... 12 1.5 Assessment of Environmental Outcomes of Diets together with Health Implications .................................................................................................... 14 1.6 Turkish Food Consumption, Health and Environmental Implications .... 16 1.6.1 The Average Dietary Pattern and the Dietary Guidelines in Turkey ................................................................................................ 16 1.6.2 Diet and Food-related Environmental Outcomes in Turkey ..... 19 1.7 Thesis Objectives ..................................................................................... 21 2. MATERIALS AND METHODOLOGY ............................................................. 23 2.1 The Dietary Scenarios .............................................................................. 23 2.1.1 Statistical Analysis: Extrapolation of the Food Consumption Data to Project the Income-dependent 2050 Dietary Scenarios for Turkey ................................................................................................ 28 xi
2.2 Water Footprint Assessment to Quantify the Dietary Water Consumption ........................................................................................................................ 31 2.3 Life Cycle Approaches to Quantify the Dietary GHG emissions ............ 32 2.4 Assessment of Health Implications of the Dietary Patterns ..................... 34 3. RESULTS ............................................................................................................ 37 3.1 The Dietary Scenarios for 1961, 2013 and 2050 ..................................... 37 3.1.1 The Income-Dependent Dietary Scenarios ............................... 37 3.2 Change in Environmental Impact due to Nutritional Transition in Turkey from 1961 to 2013 .......................................................................................... 41 3.3 Environmental Assessment of the Turkish Dietary Consumption ........... 45 3.3.1 Water Footprint Assessment of the Dietary Scenarios for the years 1961, 2013 and 2050, in comparison with the Mediterranean and Healthy Dietary Scenarios .................................................................. 45 3.3.2 GHG Emission Estimates of the Dietary Scenarios for the years 1961, 2013 and 2050, in comparison with the Mediterranean and Healthy Dietary Scenarios .................................................................. 49 3.3.3 The Food Loss and Waste ......................................................... 52 3.4 Overall Assessment of the Dietary Scenarios with Health Implications . 53 3.4.1 Comparison of the Dietary Scenarios over GHG emissions, Water Footprint and Health Implications ........................................... 53 3.4.2 Environmental Outcomes of shift to Healthier Diets ................ 60 4. DISCUSSION AND CONCLUSIONS ............................................................... 63 4.1.1 The Nutrition Transition in Turkey and the Related Change in Environmental Impact ........................................................................ 65 4.1.2 Water Footprint Assessment of the Dietary Scenarios.............. 67 4.1.3 Greenhouse Gas Emission Estimations of the Dietary Scenarios ............................................................................................................ 72 xii
4.4 Food Waste and Loss ............................................................................... 75 4.5 Environmental Impact together with Health Implications ....................... 78 4.6 Limitations of the Thesis and Recommendations for Future Studies ...... 80 4.6.1 Constructing Dietary Scenarios ................................................. 80 4.6.2 Quantifying the Environmental Impact associated with Food Consumption ...................................................................................... 81 4.6.3 Assessment of Health Implications of the Dietary Scenarios ... 82 4.7 Conclusions .............................................................................................. 82 REFERENCES .......................................................................................................... 85 APPENDICES ......................................................................................................... 113 APPENDIX A .............................................................................................. 113 APPENDIX B .............................................................................................. 115 APPENDIX C .............................................................................................. 117 APPENDIX D .............................................................................................. 123 APPENDIX E .............................................................................................. 129 APPENDIX F ............................................................................................... 133 APPENDIX G .............................................................................................. 135 APPENDIX H .............................................................................................. 137 APPENDIX I................................................................................................ 139 APPENDIX J ............................................................................................... 141 APPENDIX K .............................................................................................. 143
xiii
LIST OF TABLES TABLES Table 1. Yearly average GHG emissions associated with global food production ..... 5 Table 2. Amount of water needed to produce 1 kg of animal-oriented food product (Tabularized from [132] and [133]) ........................................................................... 11 Table 3. Average Daily Intake per Food Group in 2010 (Tabularized from [169]) .. 17 Table 4. The key food groups and the recommended consumption amounts in Turkey Dietary Guidelines (Tabularized from [170]) ............................................................ 17 Table 5. The daily energy and macronutrient intake recommended for a healthy adult in Turkey .................................................................................................................... 18 Table 6. The factors used in converting serving sizes to grams [170] ....................... 24 Table 7.Total Recommended Intake Amounts from TDG for a 2000 kcal-day healthy diet and assumptions used to simulate the TDG-based Healthy Diet (TDG-H) ........ 26 Table 8. The Food Loss and Waste Rates in Turkey (Tabularized from [178]) ........ 27 Table 9. Estimates of causal relationships of dietary factors with probable or convincing evidence and risk of CHD (Tabularized from [156]) .............................. 35 Table 10. The Regression Results for the Meat Demand and Income Relationship . 37 Table 11. The Regression Results for the Total and Empty Calorie Demand in relation with income .................................................................................................. 39 Table 12. Relative change in food consumption (% by weight and by calories), GHG emissions and water footprint (%) between 1961 to 2013. Positive values indicate an increase and negative values indicate a decrease. ...................................................... 43 Table 13. The Ratio of water footprint contributions of the food groups to the dietary water footprint, in decreasing order ........................................................................... 48 Table 14. The Ratio of Contributions of the Food Groups to the Dietary GHG emissions, in decreasing order ................................................................................... 51 Table 15. The calculated rate of food loss and waste in the dietary scenarios and the GHG emissions and water footprint associated with food loss or waste ................... 53 Table 16. Comparison of the change in supply of calories (per capita per food group) from 2001 to 2011...................................................................................................... 66 xiv
Table 17. Comparison of the total water footprint associated with the dietary scenarios in this study with the studies carried out in indicated regions ................... 70 Table 18. Comparison of the greenhouse gas emissions associated with the dietary scenarios in this study with the studies carried out in indicated regions ................... 77 Table A-1. Outstanding studies on the environmental impacts of local, regional or global food consumption with Life Cycle approaches…………………………….109 Table B-1. The literature on environmental impacts associated with food products produced in Turkey……………………………………………………………….. 111 Table C-1. Dietary scenarios constructed for environmental assessments……….. 112 Table C-2. Dietary scenarios constructed for health assessments……………….. 115 Table D-1. The average Mediterranean life cycle GHG emissions associated with 1 kg of food product with references………………………………………………. 118
xv
LIST OF FIGURES FIGURES Figure 1. CO2, N2O and CH4 (CO2eq) GHG emissions per kg-product (Visualized from [59]) ..................................................................................................................... 8 Figure 2. The Green, Blue and Grey Water Footprints associated with selected food products (compiled from [65] and [132]) .................................................................. 12 Figure 3. Main Causes of Deaths in Turkey in 2014 (Visualized from [171]) .......... 19 Figure 4. The proportion of a) Agricultural CO2 and equivalent emissions, b) Agricultural Land Use, c) Agricultural Water Withdrawal and d) Emissions from Fertilizer Use, globally, in EU28 and Turkey (Calculated from [17] and [174]) ...... 20 Figure 5. The relationship between meat demand and income (Turkey and EU28). EU: European Union, TR: Turkey. (A: The relationship between meat demand by weight and the income in GDP/capita; B: The relationship between total calories and the income in GDP/capita) ......................................................................................... 29 Figure 6. The relationship between total energy and empty calories with income (Turkey and EU28). EU: European Union, TR: Turkey ............................................ 31 Figure 7. The historical and forecasted meat demand. MC: meat consumption. The red circles are the historical meat consumption per capita per year; gathered from FAOSTAT [17]. The green plus signs and the blue circles indicate the trend in meat consumption to the year 2050 with respect to the change in income. ....................... 38 Figure 8. The historical and forecasted total energy and empty calories. The red circles are the historical total energy and energy from empty calories per capita daily, gathered from FAOSTAT [18]. The green plus signs and the blue circles indicate the trend in calories extrapolated to the year 2050 with respect to change in income. ... 40 Figure 9. The trend in total energy and empty calories supply for Turkey and EU28 (1961 - 2013) (Visualized using the FBSs, [17]) ....................................................... 41 Figure 10. The proportion of fat and protein calories in total energy supply (%E) (Visualized using the FBS data for Turkey, [18])...................................................... 42 Figure 11. The GHG emissions associated with the food supply in Turkey (1961 2013). The GHG emission estimations were calculated based on the minimum, xvi
average and maximum Mediterranean life-cycle GHG emission factors per kg of each food product. ...................................................................................................... 44 Figure 12. The green, blue and grey water footprint associated with isocaloric dietary scenarios (at 2000 kcal/day). MED: The hypothetical Mediterranean Diet; 1961, 2013: The dietary scenarios representing the food consumption in 1961 and 2013; ID 2050 (A1), (A2): The dietary scenario forecasting the food consumption in 2050 based on A1 and A2 income projections; TDG-H: The healthy dietary scenario constructed based on Turkey Dietary Guidelines. ..................................................... 46 Figure 13. The water footprint of the dietary scenarios, per kcal and per gram ........ 47 Figure 14. Total GHG emissions associated with Isocaloric Dietary Scenarios at 2000 kcal/day. MED: The hypothetical Mediterranean Diet; 1961, 2013: The dietary scenarios representing the food consumption in 1961 and 2013; ID 2050 (A1), (A2): The dietary scenario forecasting the food consumption in 2050 based on A1 and A2 income projections; TDG-H: The healthy dietary scenario constructed based on Turkey Dietary Guidelines. ........................................................................................ 49 Figure 15. The greenhouse gas emissions of the dietary scenarios, per kcal and gram .................................................................................................................................... 50 Figure 16. Greenhouse gas emissions and water footprint associated with the food loss and waste in the Dietary Scenarios; 1961, 2013 and 2050 (A1 and A2) ............ 52 Figure 17. The GHG emissions and water footprint associated with the dietary scenarios..................................................................................................................... 54 Figure 18. Difference in macronutrient intake (in percentage of total energy intake, %E) within the dietary scenarios 1961, 2013, 2050 and the Mediterranean, in comparison with the healthy (TDG-H). (PUFA: Polyunsaturated fatty acids, SFA: saturated fatty acids). ................................................................................................. 57 Figure 19. Comparison of the health and environmental implications (GHG emissions and water footprint) of the dietary scenarios. Health score of 100 indicates a full adherence to optimal intake levels given in [156]. ........................................... 58 Figure 20. Differences in (a) Quantity of food products consumed (in % variation from TDG-H), (b) GHG emissions consumption if consumed at recommended levels (%) an (C) water footprint of consumption if consumed at recommended levels (%). xvii
(Fish is excluded from the graph b as the increase in GHG emissions would be larger than 500% for the dietary scenarios, except the Mediterranean diet (18%)). Cumulative Difference is the difference in environmental impact if the dietary scenario is shifted to TDG-H. .................................................................................... 59 Figure 21. Environmental outcomes of a probable shift to healthier diets ................ 61 Figure 22.The highest blue-green water footprint ratios associated with the food products, produced and consumed in Turkey ............................................................ 71 Figure 23. Common protein sources and the corresponding GHG emissions per gram of those food products................................................................................................ 75 Figure E-1. The Trend in Supply of Meat calories in Turkey and EU28 (Visualized using the FBSs, [16])…………………………………………………………….. 123 Figure E-2. The Trend in Supply of Dairy Calories in Turkey and EU28 (Visualized using the FBSs, [16])…………………………………………………………….. 123 Figure E-3. The Trend in supply of vegetable oil calories in Turkey and EU28 (Visualized using the FBS data, [16])……………………………………………. 124 Figure E-4.The Trend in Supply of Vegetable calories in Turkey and EU28 (Visualized using the FBS data, [16])……………………………………………. 124 Figure E-5. The trend in supply of fruit calories in Turkey and EU28 (Visualized using the FBS data, [16])……………………………………………………….... 125 Figure F-1. Water Footprint Contributions of the Food Groups to the Dietary WF 126 Figure G-1. Contributions of the Food Groups to Dietary GHG emissions……… 127 Figure H-1. The main fat and protein supplier food groups in Turkey (1961 - 2013). (Visualized using the FBS data, [16])…………………………………………….. 128 Figure J-1. Variation from the Recommended Intake given in TDG for a 2000 kcal diet. For all the food groups, the recommended intake, as calculated in TDG-H, was displayed with 100%. For the other dietary scenarios, the relative intake levels for the food groups were calculated based on the recommended intake…………….. 130 Figure K-1. The GHG emission and Water Footprint Impacts of the 1961 Dietary Scenario with the recommended change in intake levels of the food groups to achieve the Dietary Guidelines…………………………………………………… 131
xviii
Figure K-2. The GHG emission and Water Footprint Impacts of the 2013 Dietary Scenario with the recommended change in intake levels of the food groups to achieve the Dietary Guidelines…………………………………………………… 132 Figure K-3. The GHG emission and Water Footprint Impacts of the income dependent 2050 Dietary Scenario (A1) with the recommended change in intake levels of the food groups to achieve the Dietary Guidelines……………………... 133 Figure K-4. The GHG emission and Water Footprint Impacts of the income dependent 2050 Dietary Scenario (A2) with the recommended change in intake levels of the food groups to achieve the Dietary Guidelines……………………... 134 Figure K-5. The GHG emission and Water Footprint Impacts of the income dependent 2050 Dietary Scenario (A2) with the recommended change in intake levels of the food groups to achieve the Dietary Guidelines………………………135
xix
LIST OF ABBREVIATIONS AFOLU
Agriculture, Forestry and Other Land Use
BMI
Body Mass Index
CH4
Methane
CO2
Carbon Dioxide
CVD
Cardiovascular Diseases
DALY
Disability adjusted life years
EIO-LCA
Economic Input-Output Life Cycle Assessment
EIPRO
The Environmental Impacts of Products
EU
European Union
FAO
Food and Agriculture Organization of the United Nations
FAOSTAT
FAO Statistics
FBS
Food Balance Sheets
GDP
Gross Domestic Product
GEC
Global Environmental Change
GHG
Greenhouse Gas
GWP
Global Warming Potential
IOA
Input-Output Analysis
IPCC
Intergovernmental Panel on Climate Change
LC
Life Cycle
LCA
Life Cycle Assessment
LCI
Life Cycle Inventory
LUC
Land Use Change
MoH
Ministry of Health of Republic of Turkey
MRIO
Multi Regional Input-Output
N2 O
Nitrous Oxide
NCDs
Non-communicable Diseases
OECD
Organisation for Economic Co-operation and Development xx
PED
Primary Energy Demand
SCP
Sustainable Consumption and Production
SDG
Sustainable Development Goal
SFS
Sustainable Food Systems
SRES
Special Report on Emissions Scenarios
TBM
Triple burden of malnutrition
TDG
Turkey Dietary Guidelines
UNEP/SETAC
United Nations Environment Programme Society of Environmental Toxicology and Chemistry
US EPA
Unites States Environmental Protection Agency
USDA
United States Department of Agriculture
WCED
United Nations World Commission on Environment and Development
WFA
Water Footprint Assessment
WFN
Water Footprint Network
WHO
World Health Organization
WULCA
Water Use in Life Cycle Assessment
xxi
CHAPTER 1
INTRODUCTION
1.1 Sustainability in Food Systems and Diets The concepts, sustainability and sustainable development, are in the middle of international debate since the United Nations World Commission on Environment and Development (WCED) in 1987, when the Brundtland Report or ‘Our Common Future’ was published. At the Oslo Symposium in 1994, the very first definition of Sustainable Consumption and Production (SCP) was formulated as “the use of services and related products, which respond to basic needs”, while ensuring life quality for people and diminishing the use of resources and emissions [1]. In the forthcoming years, SCP is accepted as one of the most important objectives and requirements to reach sustainable development, together with poverty eradication and natural resource management [2]. The importance of SCP for sustainable development is expressed in Sustainable Development Goals (SDGs), that are adopted in 2015 at the UN Sustainable Development Summit as the 2030 Sustainable Development Agenda, as a standalone goal. SDG 12, Responsible Consumption and Production is to “ensure sustainable consumption and production patterns” as more people are expected to “join the middle class” in the coming years and the demand for already limited natural resources are increasing [3]. Food consumption and food waste, energy use in households and water use and pollution are highlighted in Goal 12, as food-energy-water nexus. In addition to SDG 12, there are other goals and targets related to the sustainability of consumption and production of food. SDG 2, Zero Hunger; with the Target 2.4 which is to ensure sustainable food production systems with increased efficiency in production and resource use and maintained ecosystems, SDG 6, Clean Water and Sanitation; with the Target 6.4 which is to increase the water use efficiency, mostly during the agricultural production as it is the major consumer, SDG 8, Decent Work and Economic Growth; with the Target 1
8.4 which is to improve resource efficiency in consumption and production of domestic products while ensuring economic development and decoupling of it from environmental degradation and SDG 13, Climate Action; with the Target 13.2 which is to integrate climate change measures into national strategies in order to minimize the impacts of food production, are the other goals that are closely related to decreasing the unsustainability in the global food production and consumption [4]. Food consumption is one of the problematic issues discussed under SCP, with water and energy [5]. SCP studies claim that more than 70% of the environmental deterioration can be allocated to the consumption and production of food, energy, transportation and housing ([6]–[10]). Food and getting the sufficient nutrition is one of the basic needs of people. The current global food systems can provide the sufficient amount of food. However, the food security and sufficient nutrients are not provided equally at global and local scale. Accordingly, the life quality of every person is not ensured. Moreover, the current global food system, including the food consumption, has a significant contribution to the climate and global environmental change (GEC) through resource use and emissions ([11]–[13]). Food systems contribute to GEC especially through strengthening the change in climate and increasing the demand from the natural resources, such as the freshwater and land. Accordingly, the food systems are also affected by the changes in natural resource levels as well as the climate and ecosystem services [14]. The feedbacks occurring in between the food systems and the environmental change engender the challenge of feeding a growing population in the future and their food security [15]. Approximately, 30% of greenhouse gas emissions (GHG) and 37% of land use are associated with the food systems ([16], [17], [18]). The agricultural activities account for at least 70% of total water withdrawal globally [19]. In addition to drain on water quantity, quality of freshwater resources also decreases with increasing agricultural chemical use. The environmental implications will be worsened under the effect of climate change, which will naturally limit the use of resources for the food system.
2
The term, sustainable diet, was firstly proposed by Gussow and Clancy in 1986 to consider the “resource cost of dietary recommendations” [20, p. 2]. Two decades later, Food and Agriculture Organization of the United Nations (FAO) and Bioversity International organized an international symposium ‘Biodiversity and Sustainable Diets: United Against Hunger’ in Rome in 2010 to discuss the sustainability in diets. The participants reached to a consensus on a definition for sustainable diets, which is “diets with low environmental impacts which contribute to food and nutrition security and to healthy life for present and future generations” [21, p. 83]. There is enough scientific evidence showing the unsustainability of current local, regional or global diets ([16], [22]–[25]) and the unsustainable shift of the dietary patterns with increasing income and globalization ([17], [26]). Considering the growing world population, which was 7.3 billion in 2015 and is expected to become 8.5 billion and 9.7 billion in 2030 and 2050, respectively [27], who are also expected to be richer and more urbanized, agri-food sector is under the pressure of providing qualitatively and quantitatively enough food to meet the nutritional needs while ensuring the sustainability in the three pillars. FAO estimates at least 70% increase in the food production, necessary to feed every one in 2050, which especially consists of the increase in the annual cereal and meat production levels [28]. The increase in production, borne from the consumption, will increase the burden of food and diets on environment and natural resources. The environmental impact of production in the agri-food sector can be reduced by technological development and diminishing the food losses [29] however, the production-side improvements are limited to a maximum 20% decrease in environmental impacts ([30], [31]). That’s why the consumption side is important for the mitigation of elevated environmental degradation associated with food. Furthermore, the outcome of the rise in food consumption is not only environmental but also in close relation to health globally. “Nutrition transition” term and the historical model, proposed by Barry M. Popkin in 1993 [26], stands for the dietary transition, driven by increasing income and urbanization. The current nutrition transition occurs in between the stages of the third and the fourth dietary patterns, especially in developing regions of the world, which is from a traditional diet to a 3
“Western Diet” [26, p. 138] (which can also be defined as “Westernization” of the diet [32, p. 31]). Nutrition transition taking place have both health and environmentally burdensome outcomes. The occurrence of overweight, obesity and diet-related disease risks have increased mainly because of the dietary shifts [33], [34]. Triple burden of malnutrition (TBM), the occurrence of deficiency in calorie intake, nutrient deficiency and obesity or overweight co-existing together in several countries or regions ([35], [36]) is another outcome of the changing dietary patterns. From the environmental perspective, dietary shift-originated increase in food production create extra environmental impact, that are not associated with the growing population [37]. The per capita food consumption for specific products is increasing proportionally with income especially in developing regions of the world. The daily calorie intake per person on average is expected to rise to 3130 Calories daily [38]. Health implications of this dietary shift, combined with the environmental impact, will be a challenge to provide food and nutrition sustainably in future. The need for studies on the potential environmental impacts of dietary choices and initiations to reduce the food consumption, which is unhealthy for both human and environment, for efficient mitigation in both areas is increasing. Food system activities contribute directly to the emissions of greenhouse gases including carbon dioxide (CO2) from fossil fuel use and land use change, nitrous oxide (N2O) from fertilizer use and methane (CH4) from livestock and rice production. The Global Warming Potential (GWP) of the food systems, which is determined based on the carbon and equivalent emissions associated with the studied system and expressed in terms of GHG emissions in CO2 equivalents (CO2eq), are the most commonly studied aspect of the global food production from an environmental perspective. Table 1 summarizes some of the results of the studies in literature on the magnitude of global GHG emission associated with food production. In the 5th assessment report of Intergovernmental Panel on Climate Change (IPCC), the ratio of global GHG emissions attributed to Agriculture, Forestry and Other Land Use (AFOLU) sector was calculated as 24% of total GHG emissions [39]. In the report, the pre- and post-production stages and associated GHG emissions are not 4
accounted under the AFOLU sector category. It is claimed by FAO that including the GHG emissions from the stages mentioned above, the total magnitude of emissions associated to AFOLU would increase by 30% [13].
Table 1. Yearly average GHG emissions associated with global food production The Process Fertilizer Production Pesticide Production Feed Production Agriculture, Forestry and Other Land Use sector (AFOLU) Fossil fuel-related agricultural CO2 emissions Non-CO2 GHG emissions linked to the agriculture Food Waste (including land use change (LUC)) The Global Food System
GHG Emissions (MtCO2eq) 284 – 575 3 – 140 60 10000 – 12000 400 – 600 5200 – 5800 4400 9800–16900
Year 2007 2007 2005 Per year 2010 2010 2011 2008
Reference [40] [40] [38] [39] [39] [39] [41] [12]
The impacts of agricultural production on GHG emissions in coming decades are expected to increase globally and regionally. According to the report published by Unites States Environmental Protection Agency (US EPA) and Climate Change Division [42], emissions from the agricultural soils are estimated to increase by 35%, from 1840 to 2483 MtCO2eq in between 2005–2030. CH4 emissions born from enteric fermentation are also estimated to increase by 22%, equal to an increase of 426 MtCO2eq in between 2005–2030. By 2030, it is important to state that the largest increase in fertilizer use among the countries from Organisation for Economic Cooperation and Development (OECD) are expected to become in United States, Canada, Turkey, New Zealand and Australia. Not only the global climate but also the global freshwater resources face with the risk of deterioration because of the irrigated crop production and associated pollution. Agriculture is the major consumer of water resources and the demand is expected to grow in future, challenging the countries, which are especially facing with water scarcity problems. Agricultural production accounted for minimum 70%, though it may be as high as 90%, of total water withdrawal globally [19]. Since 1974, total 5
area equipped for irrigation infrastructure to provide the crops sufficient water, have increased more than 65% and it is expected to grow 11% by 2050 globally [43]. This growth is estimated to take place especially in developing countries [43]. Not only quantity, but also quality of freshwater resources faces the risk of deterioration. As there are numerous studies showing the global and regional eutrophication and chemical pollution potential of diets, associated with ascending fertilizer and pesticide use ([44]–[46]), degradation and salinization of soils ([21], [47]), which are expected to be worsen under climate change conditions ([39]). There are many other large impacts of agriculture and food consumption on environmental change along with water use and GHG emissions such as land use change, biodiversity loss, alteration of the nutrient cycles, desertification, emission of other acidifying pollutants and cumulative energy demand (CED) ([39], [48]–[50]). The effects and consequences of land use change is more than the transformed land and climate change. Land use change is claimed to have the largest impact on the biodiversity loss especially for the terrestrial ecosystems [51]. Land use change and related biodiversity loss, are mostly associated with the food systems, especially the agricultural production stage. According to Tilman and Clark [17], “half of the ice free land area of Earth” is used for agricultural purposes and food production. The latest estimations of FAO reveal that the agriculture covers 37% of terrestrial land all around the world [18]. By 2050, the increase in the demand for food is estimated to be satisfied especially by intensifying the agricultural practices for more yields. 90% in developed world and 80% in developing regions of the increase in supply will be associated with increased yields [43]. The rest is estimated to provide through land expansion for agricultural production. The land is estimated to be expanded by 5% and 12% in developed and developing regions respectively [43]. 1.2 Greenhouse Gas Emission Estimates with Life Cycle Approaches Life Cycle Assessment (LCA) is used commonly to quantify the potential environmental impacts of the food products as well as related activities, such as global warming potential (GWP), acidification and eutrophication potential [52]. LCA was developed as a decision-support tool to compile and evaluate the 6
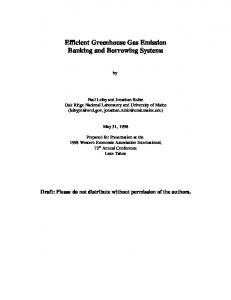
environmental impacts associated with the studied products or processes by considering the inputs and outputs of the system throughout the life cycle [53]. ISO 14040:2006 [53] provided the standards for practicing a Life Cycle Inventory or Life Cycle Assessment study. ISO 14040:2006 defined 4 phases for a LCA study that included goal and scope definition, life cycle inventory analysis, life cycle impact assessment, and interpretation. The studies with a proper goal and scope definition and which can be satisfied with only an inventory analyses, are called Life Cycle Inventory (LCI) studies. Functional Unit is the quantitative reference flow that is related to other flows, inputs and outputs in the product system under study, which is determined at the goal and scope definition stage of an LCA study [53]. The selection of functional unit for the specific subject in LCA should be the quantification of the function of that subject ([54], [52]). In an LCA study, the processes included in the assessment are defined by system boundaries, which are also determined at the goal and scope stage of the study [53]. LCA studies should include a total life cycle of the studied product or service and so, the system boundaries should be from cradle-to-grave [53]. However, most of the LCA studies on food products and diets only include the agricultural production processes as the environmental impact associated with it is the largest of all processes [55]. Those system boundaries for such studies are defined as cradle-to-farm gate. There are now several studies on food products, production methods, food system sustainability, food processing and food consumption as well as methodological studies using Life Cycle Assessment (LCA) ([12], [55], [56]). The potential environmental impacts of single food products and their consumption have been assessed prior to diets. In current literature, there are extensive amount of studies carried out to quantify the environmental impacts of single food products with LC approaches. Red meat ([57]–[62]), dairy ([57], [59], [61], [63]), sea foods ([58], [59]), rice ([60], [63]), white meat ([60], [64]), fruits, and vegetables ([23], [60]) grains ([60]) and legumes ([58], [60], [62], [65]) are some of the examples using LC approaches in assessment. The studies on potential environmental impacts of meat and dairy products become prominent in between those and are emphasized as emission intensive compared to plant-based food products by many international 7
organizations ([11], [38], [66]–[68]) and in peer-reviewed papers ([56], [60], [69]– [74]). Including the impacts born as a result of land use change (LUC) attributed to meat and dairy production, the contribution from animal-based food consumption rises ([38], [11]). The environmental impacts associated with food products differ according to the geographic location and production methods followed. Figure 1 below demonstrates the GHG emission contributions of some food products sold in Sweden, which can provide a basis to compare the environmental impacts of animal and plant-based products [60]. Apart from the environmental burden of agriculture and food production processes, food consumption and dietary choices have been evaluated in relation to their environmental impacts since the middle of 1980s. Gussow and Clancy (1986) firstly pointed out the importance of studying the natural resource use in food consumption by proposing the nutrition education to be enhanced with not only human healthrelated information but also include education on agricultural practices, environmental science and economics [20]. Then, Gussow [75] proposed to assess and compare different dietary patterns around the globe based on their efficiency in land, water and energy use.
Carrots (domestic) Potatoes (domestic) Honey Whole Wheat (domestic) Apples (by boat) Milk (domestic) Sugar (domestic) Oranges (by boat) Rice Green beans (South EU) Vegetables (frozen, by boat) Eggs Chicken (domestic) Cod (domestic) Cheese (domestic) Fruits (tropical, by plane) Beef (domestic) 0
5
10
15
20
25
30
35
kg CO2 equivalent/kg product CO2
N2O
CH4
Figure 1. CO2, N2O and CH4 (CO2eq) GHG emissions per kg-product (Visualized from [59]) 8
The studies evaluating the relationship between food consumption and environment started to appear in the literature firstly in Europe. Pioneering studies can be grouped according to their study boundaries, the countries. The outstanding and recent studies in the Europe region are carried out in Austria ([76]–[78]), Brazil [79], Denmark, ([25], [80], [81], [82]), Finland ([83]–[86], France ([87]–[91]), Germany ([29], [48], [92], [93]), Greece [94], Ireland [95], Italy ([59], [96]–[99]), Norway [100], Spain ([65], [61]), Sweden ([58], [65], [101]–[105]), Switzerland ([64], [44]), The Netherlands ([16], [57], [106]–[108]) and United Kingdom ([11], [23], [24], [45], [109]). The Environmental Impacts of Products (EIPRO) study started in 2004 by the Joint Research Center (JRC) Institute for Prospective Technical Studies (IPTS) revealed that food is one of the main drivers of environmental impacts born from consumption in Europe [6]. Following that, a study targeting to quantify the environmental impacts associated with food consumption and widespread dietary patterns in the EU-27 countries was published in 2009 ([49], [110]). In the EU, the consumption of food and beverages generates 22-31% of total GHG emissions from overall consumption ([110],[31]) revealing that the consumer choices on what to eat and drink have a significant impact on the amount of GHG emissions. Apart from Europe, there are some outstanding studies, evaluating the relationship between food consumption and environment carried out in Australia ([62], [111], [112]), Canada [113], China ([114]–[116]), India [63], New Zealand [117], Qatar [118] and USA ([119]–[124]). Recently, studies on environmental life cycle impacts associated with global food consumption in 2007 have been carried out [125]. However, there is lack of research in environmental impacts of food consumption (the average dietary pattern) in Turkey. The prominent environmental impact categories selected to quantify the environmental impacts of food consumption are GHG emissions, water use, land use and cumulative energy demand (CED). GHG emissions and GWP calculation were chosen as the main impact to be studied in most of the studies ([19], [20], [22], [86], [90], [103], [108], [125], [132], [145]). The prominent studies that follow a LC
9
approach in assessing the GHG emissions as well as other impacts of food consumption are provided in Appendix A in details. 1.3 Water Footprint Assessment of Food Consumption There are numerous studies quantifying the agricultural demand of water. The methodology developed by the Water Footprint Network (WFN), the Water Footprint Assessment, is one of the quantification methods of water use. The water footprint (WF) concept was firstly proposed by Hoekstra in 2002 as to measure the water use along the supply chains of the products and processes [126]. Since then, WF is used as an indicator for the freshwater use of products or services [127]. WF of production and WF of consumption differ when assessing the water use of products and services. The first one is the total amount of direct and indirect water use from the regional water sources. The latter one is, on the other hand, the total amount of direct and indirect water use of both regional and foreign water resources [128]. The WF of consumption is calculated by summing the WF of production and the virtual water import; the total amount of water virtually used in foreign waters, and subtracting the virtual water export; the total amount of water used by foreign consumers [127]. According to Hoekstra (2011), the water consumption is accounted as the sum of demand for and pollution of water [127]. In that sense, WFA lets the researcher to assess the water use over three main components, green, blue and grey water. Green water use is the amount of water made available for plants by precipitation and stored in the unsaturated zone of the soil until it evaporates or transpires through plants [128], [129]. Blue water use is the amount of water used from freshwater resources. The irrigated agricultural areas use both blue and green water whereas, rainfed agricultural areas use only green water resources. The grey water use, on the other hand, is the total amount of water polluted as a result of production or consumption [127]. The WF concept has been employed widespread in the literature to measure the magnitude of agricultural water use [128]. The global WF of anthropogenic activities for the period 1996 – 2005 was calculated as 9087 Gm3/year by Hoekstra and 10
Mekonnen [130]. They also calculated the total WF of agricultural production as 92% of the total WF, which equals to the sum of water use in crop production, pasture and animal production. The studies on the accounting of water use, consumption and pollution associated with dietary consumption are more recent in comparison with GHG emissions. Firstly, Hoekstra and Hung (2002) calculated the consumptive water use (green and blue WF) of main crops according to the geographical area they were produced [131]. Following that, Hoekstra and others [127] developed a guide to standardize the WF assessment. The green, blue and grey WFs of many crops and livestock products were calculated based on the published manual ([132], [73]). When global estimations on water consumption of food products are considered, animal-oriented food products are more water intensive than plant-based ones [133] (Figure 2). In between animal-oriented food products, there is still a variation of water consumption, especially due to the farming system and the region of the farming (Table 2).
Table 2. Amount of water needed to produce 1 kg of animal-oriented food product (Tabularized from [132] and [133]) Animal Products Chicken Meat
Water Required (liters/kg) a 3500
Water Footprint (m3/ton) a 4325
Pig
6000
5988
Beef
43000
15415
Sheep
51000
10412
a
m^3/ton ≡ l/kg
The WFs calculated were used in numerous diet-related water use studies, of which, the outstanding ones are [129], [134]–[137]. The study design and the main outcomes of those studies are provided in Appendix A in details. Additively, new methodologies to quantify the water use were established. Water use in LCA (WULCA) developed by the United Nations Environment Programme (UNEP)/Society of Environmental Toxicology and Chemistry (SETAC) Life Cycle 11
Initiative is, in general terms, a framework to quantify and assess the use of
The Food Products
freshwater resources with an LCA methodology [138].
Beef (grazing) Virgin Olive Oil Poultry (grazing) Butter (grazing) Dry Beans Wheat Paddy rice Milk (grazing) Apples Potatoes Tomatoes Sugar Cane
1827 1673 1191 822 287 214 210 0
6484 5053
5000
9370
10000 15000 Water Footprint (m3/ton)
Green
Blue
21829
14431
20000
25000
Grey
Figure 2. The Green, Blue and Grey Water Footprints associated with selected food products (compiled from [65] and [132]) 1.4 The Construction of Dietary Scenarios to Assess the Environmental Impacts The dietary consumption is assessed environmentally over dietary scenarios, which can be constructed based on actual consumption data or hypothetical data on food consumption. The actual consumption data contains average consumption amounts for a selected population or can be aggregated from self-selected diets. Hypothetical dietary scenarios, on the other hand, are constructed to represent the associated environmental impacts related to food consumption or to measure the change in impact in case there is a shift from actual to hypothetical dietary scenarios. Food balance sheets (FBS), constructed by FAO from the national accounts to represent the food supply pattern of a country for a specific period [139] are used commonly to develop basic dietary scenarios for a specific time and region [52]. The average availability of food products, as provided in FBSs, is the amount of food produced and imported minus the food exported, fed to animals and the ones that are not available for human consumption, divided by the population size of the specific nation for the period and named as food supply per capita. 12
There are studies constructing hypothetical dietary scenarios to project the future food demand and the potential environmental and health impact associated with the demand [17]. Total food demand in terms of total calorie intake per person, total demand for meat in terms weight and calories, demand for other animal-oriented food products such as dairy and eggs, and demand for unhealthy or empty calories are modelled to create future food demand and consumption scenarios. There are numerous studies showing a positive relationship between income and food demand in environmental ([17], [140]–[142]) as well as in nutrition and health field ([26], [34]). Engel’s Law, which is an economic law for demand prediction, claims that the increase in food demand is less than proportional to the increase in income [143]. Another economic approach, Bennet’s Law claims that the impact of income on the food demand depends on the type of the food and the demand for starchy foods decrease with increasing income. However, the demand for meat products is expected to grow more than other food groups. Distinct from economic approaches, there are studies modelling the relationship of food demand in relation to income for analyzing the environmental and health outcomes of changing dietary patterns ([17], [144], [145]). The other determinants affecting the food demand are the degree of urbanization, demographical features of a society, food industry including the food prices, the level of globalization and climate change ([26], [32]). Bodirsky and others (2015) employed “time-dependent regression models” to define the relationship between income and food demand, based on the economic approaches mentioned above [140, p. 1]. On the other hand, Tilman and Clark (2014) [17] employed a nonlinear, logistic-like regression model with a Gompertz 4P function to predict the composition of the global diet in 2050. Vranken and colleagues (2014) [146] studied the relationship between meat consumption and income in 120 countries and found the evidence that meat consumption and income has an inverted U-shape curve, which is very similar to Environmental Kuznets Curve (EKC), named after Kuznets [147] and emerged in 1990s following the attempt by Grossman and Krueger [148]. Kuznets hypothesized that the economic inequality will rise first with rising income until a tipping point where the inequality in between a population would start to decrease [147]. Grossman and Krueger 13
applied the Kuznets Curve approach to claim a relationship between environmental degradation and income, which would rise and fall after some income level when the economic growth continues [148]. Meat consumption, which is hypothesized as having an inverted-U shape curve with income, was also studied with an EKC. Cole and McCoskey [142] applied a regression model based on the EKC formulation and tried to find a similar relationship, with a tipping point in income that the meat consumption would decrease. Their results showed that, an EKC was possible in case the studied countries’ income levels are upper-middle or high. 1.5 Assessment of Environmental Outcomes of Diets together with Health Implications The main function of a diet is to provide nutrition to human beings. Following a healthy diet is an important determinant of good health and has the potential to prevent NCDs in addition to any type of malnutrition, including both insufficient nourishment and over-consumption ([149], [150]). Accordingly, assessment of diets from an environmental perspective cannot eliminate the health perspective. Tilman and Clark (2014) entitled the problem of feeding a growing population under the constraints of health and environment as “diet – environment – health trilemma” [17, p. 521]. The recent studies in the field generally assess the environmental and health implications together as to achieve sustainability in diets ([87]–[89], [106], [109], [151]). The health implications of the diets are under debate and they are not easily quantified directly [16]. Assessing the health implications; adherence to regional or local guidelines and food pyramids, protein content and the nutritional quality of diets are some of the approaches used in environmental studies. The dietary guidelines and food pyramids are used commonly in literature to construct healthy dietary scenarios to quantify the associated environmental impact (See [48], [50]). Those dietary scenarios are used as benchmark for healthy nutrition. Quantifying the nutritional quality of the dietary patterns has already been assessed with diverse approaches among environmental studies (See [23], [24], [59], [64], [86]–[88]). Nutrient profiling, nutrition quality indices and qualitative analysis using the 14
epidemiological studies are the most commonly used approaches [52]. The first two approaches assume that the high nutritional quality is associated with improved health. The epidemiological studies as well as the recommendations by WHO [152], World Cancer Research Fund [153] and national guidelines are used to qualitatively assess the nutritional and health implications of diets over the health indicators ([16], [17], [52], [108], [122], [154]). The commonly used nutritional indicators are low intake of fruits, vegetables and fish; type and amount of fatty acids; low fiber and high salt consumption, which have probable or convincing causal relationship with obesity, coronary heart disease (CHD) and cancer ([149], [152], [155]–[158]). Fruit and vegetable intake at least at recommended levels decrease the risk of obesity and cardiovascular diseases (CVDs) ([149], [152], [156], [159]). In addition, fruit and vegetables are linked to decreased risk of occurrence of type II diabetes and some type of cancers with probable evidence [152]. Fish consumption is linked to the decreased risk of CHD when consumed at optimal intake levels [156]. The type of fatty acids consumed (monounsaturated fatty acids-MUFA, polyunsaturated fatty acids-PUFA, saturated fatty acids-SFA) is also a determinant on the health implications of diets [152]. PUFA are abundant in vegetable oils such as soybean and sunflower whereas MUFA are abundant in olive and canola oil [152]. Nuts are also high in unsaturated fatty acids and low in saturated ones. Saturated fats are abundant in animal-based food products and some vegetable-based oils such as coconut, palm and palm kernel oils [152]. The intake of unsaturated fatty acids is favored over SFAs and carbohydrates as the latter ones are associated with increasing incidence of NCDs with convincing evidence ([152], [156]–[158]). The SFA intake in high levels increase the risk of CVDs whereas the shift to unsaturated fatty acids from SFA and carbohydrates are associated with lower risk of coronary heart diseases (CHD) ([152], [156], [158]). Healthy Eating Index (HEI), a concept proposed for assessing the adherence to the dietary guidelines for United States by Kennedy and others (1995) [160] is also used to examine relationships between diet and health implications in environmental
15
studies ([16], [108]). It is not directly applicable but a health score for diets can be calculated based on the concept as described in [15]. FAO, when proposing the sustainable diet concept, selected the Mediterranean Diet as an example dietary pattern for the concept [21]. Several epidemiological studies showed the link between adherence to the Mediterranean Diet and better health ([161]–[165]). In addition, the Mediterranean-type dietary pattern was assessed from an environmental perspective and those studies concluded that adherence to such dietary patterns are also better for environment ([17], [75], [166]). The Mediterranean Diet scenario is included in a substantial majority of studies as a benchmark for a sustainable diet ([16], [17], [96], [99], [154], [167]). 1.6 Turkish Food Consumption, Health and Environmental Implications 1.6.1 The Average Dietary Pattern and the Dietary Guidelines in Turkey The nutritional habits of Turkish people change spatially, temporally and socioeconomically [168]. However; it is right to state that Turkish people’s main food comes from cereals and grains. According to the statistics provided by the Ministry of Health (MoH), 44% of daily calorie intake in Turkey is from bread. When the other grains and cereals are considered, the ratio rises to 58% [168]. The most recent nutrition and health survey in Turkey was completed in 2010 [169]. The main results of the Survey related to the average daily consumption of main food groups, for the adults older than 19 years old, are presented in Table 3. The very first food-based dietary guidelines in Turkey was published in 2004. The last dietary guidelines was published in 2016 [170] by Ministry of Health (MoH). Turkey Dietary Guidelines (TDG), provided the healthy food plate for Turkish people. The guidelines categorize the foods under 5 main food groups [170], as provided in Table 4.
16
Table 3. Average Daily Intake per Food Group in 2010 (Tabularized from [169]) Food Groups Meat
Average Daily Intake (adults > 19 years old) (g/day) 69,3
Egg
24,4
Legumes
9,1
Nuts, seeds, oil crops
6,9
Dairy and products
188,9
Fruits and Vegetables
548,3
Bread and other grains
277,2
Total fat and oil
32,8
Sugar-added food products
33
Water and other beverages
1682,3
Table 4. The key food groups and the recommended consumption amounts in Turkey Dietary Guidelines (Tabularized from [170])
Food Group Milk and Dairy (including yogurt, ayran and cheese) Meat, poultry, fish, eggs, legumes, nuts, seeds
Recommended Consumption [170] (for an average healthy adult) 3 portion/day 2,5 – 3 portion/day
Fresh Vegetables
3 – 4 portion/day
Fresh Fruits Bread and cereals
2 – 3 portion/day 3 – 7 portions/day
1 portion equivalence in measurement unit -240 ml milk -200 – 240 ml yogurt -40 – 60 gr cheese -80 gr cooked meat/chicken -150 gr fish -130 gr legumes -30 gr nuts (hazelnut/walnut) -2 eggs -150 gr cooked green leafy vegetables
-(50 – 100 kcal) -50 gr bread -70 gr macaroni -90 gr bulghur -90 gr rice -30 gr breakfast cereal
17
NOTES
Fish ≥ 2 portion/week Eggs = 3-4 portions/week Legumes ≥ 2-3 portions/week Nuts and Seeds ≥ 1 portion/day
Fruits and Vegetables ≥ 5 portions/day Green leafy vegetables ≥2,5 – 3 portion/day Fruits ≥ 2 – 3 portion/day Food commodities: wheat, oat, rye, rice, barley, corn Foods: Bread, rice, macaroni, noodles, couscous, bulghur, oat, barley and breakfast cereals
The TDG provided the recommended levels of energy and macronutrients based on gender and per each age group. The daily recommended levels of energy and macronutrients for healthy men and women in the age group 19-49, is presented in Table 5.
Table 5. The daily energy and macronutrient intake recommended for a healthy adult in Turkey
Total Calorie Intake (kcal/day) Carbohydrates (%E) Fat (%E) Protein (g/day)
Age Group 19-29 30-39 40-49
Men
Women
Average Recommendations
25581 24521 24291
20412 19772 19342
18-50
45-603
45-604
45-60 %E
18-50 19-29
3
20-35 74.85
4
20-35 62.46
20-35 %E
30-39 40-49
82.15 82.25
70.36 776
10-20 %E
-
1
The recommendations for an adult healthy man who is assumed to be moderately active, with a height of 171 - 173 cm and BMI of 22 kg/m2 in the 50% percentile are provided in the table. 2 The recommendations for an adult healthy woman who is assumed to be moderately active, with a height of 156 – 159 cm and BMI of 22 kg/m2 in the 50% percentile are provided in the table. 3 For a healthy adult man 4 For a healthy adult woman 5 For a healthy adult man with a weight range in 72 – 79 kg. 6 For a healthy adult woman with a weight range in 60 – 74 kg.
The occurrence of diet and weight-related diseases in Turkey was also reviewed to understand the trend in health outcomes of the dietary patterns. In 2008, obesity became the third most important risk factor for NCDs for adults in Turkey [171]. According to an estimation by WHO EU [172], 84% of all deaths during 2014 in Turkey were accounted to NCDs, 47% of which was associated with cardiovascular diseases. A detailed analysis of death-related demographic information can be found in Figure 3.
18
14% 7% 2% 8%
CVDs Cancer
47%
Chronic Respiratory Disease Diabetes Other NCDs
22%
non-NCDs
Figure 3. Main Causes of Deaths in Turkey in 2014 (Visualized from [171])
1.6.2 Diet and Food-related Environmental Outcomes in Turkey Based on the planetary boundaries approach, proposed by Rockström and others [173], the selected issues; climate change, land system change, freshwater use and biogeochemical flows are examined based on the impacts associated with agricultural production. As an indicator for climate change, the percentage of agricultural global GHG emissions for Turkey and EU28 are calculated from the data provided by FAO for the year 2010 [18]. The world average ratio for agricultural GHG emissions is 10%. Agricultural GHG emissions ratio for EU28 (8.5%) and Turkey (9%) is lower than the world average. Land system change is assessed with the indicator; percentage of agricultural area to land area, calculated from the data provided by FAO [18]. Approximately 40% of global lands are used for agriculture. The ratio of agricultural land use is higher for EU28 (44%). The ratio of agricultural land use in Turkey is higher than the world and EU28 average and equal to 50%. Freshwater use is assessed based on the percentage of agricultural water withdrawal to total water withdrawal gathered from the AQUASTAT database [174]. The global ratio of agricultural water withdrawal is approximately 70%. The agricultural water withdrawal for EU28 countries are calculated excluding Bulgaria, Finland, Greece, Ireland, Italy and Portugal as there were not enough data to assess the countries mentioned. Agricultural production accounted for nearly 70% of total water withdrawal globally and more than 80% for Turkey in 2010 ([18] and [174]). From 1974, total area equipped for irrigation infrastructure to provide the crops sufficient 19
water, have increased more than 65% globally and more than doubled (145% increase) in Turkey (Calculated from [18]). The change in biogeochemical flows that can be attributed to the agricultural production, is assessed with the indicator, percentage of synthetic fertilizer emissions in total agricultural emissions, calculated from the data provided by FAO for the year 2014 [18]. GHG emissions associated with synthetic fertilizers are the total emissions of N2O expressed in CO2 equivalent. The global GHG emissions associated with the use of synthetic fertilizers is 13%, which is lower than the EU28 and Turkey average. Approximately one third of agricultural emissions are associated with the use of synthetic fertilizers in Turkey (28%), which is higher than the EU28 average (19%). Figure 4 summarizes the selected indicators’ ratio for the World, EU28 and Turkey to highlight the impact of
Percentage
agricultural production on the issues having planetary boundaries.
90% 80% 70% 60% 50% 40% 30% 20% 10% 0% Agricultural Agricultural Land Agricultural Water % of synthetic CO2eq. emissions Use (2014) Withdrawal (2008 fertilizer emissions (2010) - 2012) of agricultural emissions (2014) World
Turkey
EU28
Figure 4. The proportion of a) Agricultural CO2 and equivalent emissions, b) Agricultural Land Use, c) Agricultural Water Withdrawal and d) Emissions from Fertilizer Use, globally, in EU28 and Turkey (Calculated from [17] and [174])
Related to agricultural production, main contributor activities to greenhouse gas emissions in Turkey are livestock production, nitrogenous manure use, stubble 20
burning; which is the burning of residual crops following the harvest of cereals, and paddy rice production [175]. Most of the contribution to emissions are from CH4 and N2O, which are non-CO2 greenhouse gases. Livestock production is responsible for the emission of CH4 due to digestion of animals. Moreover, nitrogenous manure use is responsible for the emission of N2O due to the storage of animal-oriented manure under oxygen-free environments. The stubble burning as a waste management activity in agricultural production is responsible for both CH4 and N2O emissions due to the burning process. Based on the compiled results, GHG emissions and water footprint associated with food consumption in Turkey is selected as environmental impact categories that will be assessed over dietary scenarios. The study design and the main outcomes of other food-related environmental impact studies carried out in Turkey are provided in Appendix B in details. 1.7 Thesis Objectives The general purpose of this thesis is to understand the nature of Turkish dietary pattern and the potential nutrition transition from 1960 to the future (2050), to assess the environmental impacts through quantification of water footprint and GHG emissions, and to evaluate the health implications of the dietary patterns. The special purposes of this thesis are to: •
Construct dietary scenarios for the years 1961, 2013 representing the food consumption,
•
Develop the income-dependent 2050 dietary scenarios for Turkey,
•
Estimate the GHG emissions and water footprint of those dietary scenarios, identify the main contributors to environmental impacts, compare the results with other hypothetical diets; the Mediterranean Diet and the Turkey Dietary Guidelines (considering the importance of the two impact categories for Turkey and the data accessibility (availability of the data for a wide range of food products, which is also significant for other researchers), other impact categories are not included), 21
•
Evaluate the health implications of the dietary scenarios in relation with the environmental implications,
•
Highlight the improvement potentials of the dietary pattern into a more sustainable diet.
The main hypotheses of this study are: 1) The environmental impacts associated with the food consumption of an average person in Turkey is expected to be lower than the European averages. 2) The environmental impacts associated with the food consumption of an average person in Turkey in 2050 is anticipated to be higher than present due to the increasing consumption of meat and other energy-dense foods. 3) The shift to a healthy diet is expected to have better health and environment implications than the current average diets followed in Turkey.
22
CHAPTER 2
MATERIALS AND METHODOLOGY
2.1 The Dietary Scenarios FAO food balance sheets (FBSs) provide yearly supply levels of the food products for a specific country or region. Use of FBSs as a resource to construct dietary scenarios is widespread in the literature ([94], [134], [166]). Based on the data provided for the years 1961 and 2013, the change in food supply levels in Turkey were examined and the probable nutrition transition in Turkey was evaluated over the dietary scenarios representing the Turkish food consumption from 1961 to 2013. 1961 was the first and 2013 was the last years that the yearly food supply levels were provided by FAO for Turkey at the time of this study. The 1960s and 2010s have distinct properties economically, socially and environmentally in relation to agricultural production and consumption. The intensification of agriculture, use of fertilizers and pesticides, greenhouse cultivation and import of agricultural technology; which are associated with increasing environmental impact of agriculture, were limited until the mid-1960s in Turkey [175]. In addition, both protection and conservation acts, such as wetland protection practices, were also firstly initiated in the same period. From 1960 to 2000; the average agricultural enterprise-owned land increased by 10% [175] and the agricultural land use expanded by 6% from 1961 to 2013 [18]. Moreover, the total population more than doubled approaching to 2010 while the share of rural population shrank from 68% to 32% in total population [175]. The food groups that were examined to understand the nutritional transition in Turkey were meat products, fruits, vegetables, cereals and the hypothetical group of empty calories, which was constructed to describe the change in food supply to a more calorie and fat-dense foods (sum of total intake of sugar and sweeteners, animal fats, vegetable oils and alcoholic beverages in terms of kg capita-1 year-1 and kcal 23
capita-1 day-1) in addition to the total caloric intake. For benchmarking, EU28 average values provided by FAOSTAT for the same period were used in examination. In addition, the change in environmental impact associated with the food consumption in Turkey, in terms of GHG emissions and water footprint were evaluated. For the environmental and nutritional assessment, the 1961 and 2013 dietary scenarios, the hypothetical income-dependent 2050 dietary scenarios (ID 2050 (A1) and ID 2050 (A2)), the Mediterranean diet scenario (MED) and a healthy dietary scenario with 2000 Calories daily, provided by Turkey Dietary Guidelines [170] (TDG-H) were developed. Using the suggested daily intake levels provided in [16], [165], [176], a hypothetical 2000 kcal/day Mediterranean diet for this study was constructed. The proportions within the food groups were kept identical to 2013 levels. The ratio of each food product supply in the 2013 diet was used to determine the daily intake levels of the same food products in the simulated Mediterranean diet. Turkey Dietary Guidelines (TDG) provided the recommended daily and weekly portions of the key food groups for a 2000 kcal day-1 diet [170]. The average daily calorie requirements of low active men and moderately active women aged between 18-49 years in Turkey, which were calculated due the 50th percentile height and BMI = 22 kg/m2, were calculated as 2057 kcal day-1 [170]1. Accordingly, the 2000 kcal day-1 diet was selected as a reference healthy diet for the population. In order to determine the daily consumption of food products in grams, the reference values per one portion of a food product provided in TDG were used in calculations (Table 6). Table 6. The factors used in converting serving sizes to grams [170]
a
Food Products
Fruits
Vegetables
Milk Eggs Poultry
g/portion
150
150 a
240
100
100 a
Red Meat
100 a
Fish Legumes
250 a
50 a
Nuts & Starchy Seeds Roots
30
90 a
Portion size of uncooked food products
1 The writer discussed about it with one of the co-writers of TDG; Prof. Dr. Sevil Başoğlu. 24
The recommendations of TDG for the food groups, were converted into daily recommended intake in grams, are summarized in Table 7, with the methodology followed in constructing the 2000 kcal day-1 healthy diet (TDG-H). Bread was converted to wheat equivalent, using the conversion factors applied as in FBS calculations by FAO [177]. The calories associated with foods and the diet in TDGH were calculated based on the nutrition facts applied in FBS calculations by FAO [139]. For the environmental assessment, all dietary scenarios were adjusted to 2000 Calories daily (isocaloric). Thus, the environmental impact of the dietary scenarios was compared on a caloric-equivalent basis. In addition, the change in environmental impact in case a shift from one dietary scenario to another was possible without changing the energy intake. In addition, as the MED and TDG-H only included the recommended intake per food products, the food loss and waste rates per food products were incorporated into the indicated scenarios. Prior to assessment, all dietary scenarios were equivalent over total calories per day and for food loss and waste. On the other hand, for the nutritional assessment and to point out the health implications, all dietary scenarios were adjusted to loss and waste and then the total calories associated with them were adjusted to 2000 Calories daily. As the main dietary scenarios for Turkish Food Consumption was developed using FBSs, the amount of food supply or food calories were the food/calorie available for human consumption. The terms, food consumption or intake (when used especially in assessing the dietary scenarios) stand for the availability of food and calories in Turkey for the indicated period of time.
25
Table 7.Total Recommended Intake Amounts from TDG for a 2000 kcal-day healthy diet and assumptions used to simulate the TDG-based Healthy Diet (TDG-H) The Food Groups Meat, poultry, fish, eggs, legumes Red Meat Poultry Fish Eggs Legumes Nuts and Seeds
Total (g/cap/day) 218.2 35.5 35.5 71.5 35.7 25 15
Fresh Vegetables
410
Fresh Fruits
375
Starchy Vegetables Milk, yoghurt and cheese
38,5 720
NOTES AND ASSUMPTIONS Proportions within the food group, as recommended in TDG [170], were used to calculate the sub-food products. Daily Recommendation = 0,60 portion a day Daily Recommendation = 0,60 portion a day Daily Recommendation = 0,29 portion a day Daily Recommendation = 0,35 portion a day Daily Recommendation = 0,50 portion a day Daily Recommendation = 0,50 portion a day Proportions within the food groups were kept identical to 2013 levels. Proportions within the food groups were kept identical to 2013 levels. Potatoes are selected as to represent the starchy vegetables. Proportions within the food groups were kept identical to 2013 levels. All is assumed to be taken from milk. No conversion factors were used. Olive Oil is recommended only. Other oils and fats are excluded from this dietary scenario. Wheat Equivalent is calculated: The world average of getting wheat flour from wheat = 79% [177]. The bread has 100 -130% more weight than the wheat flour (115% in average) [177].
Oil
30
Bread and Cereals Group
225
225 g of bread = (225/1,15) = 195,7 g wheat flour; (195,7/0,79) = 247,67 g of wheat per day
Total Energy (kcal)
2002
The calculated amounts in TDG [170]
Total Protein (g)
95
The calculated amounts in TDG [170]
Protein, (% kcal) Total Fat (g)
19% 78 – 80
The calculated amounts in TDG [170] The calculated amounts in TDG [170]
34 - 35%
The calculated amounts in TDG [170]
Fat (% kcal)
26
The food loss and waste ratios were compiled from the FAO-supported report [178] prepared for Turkey. To the best of the writer’s knowledge, it is the possible best approach that is available to adjust the FBS data for food loss and waste. The food waste and loss rate estimates for the key food groups at each supply chain stage, that were used to calculate the percentage of mass that is lost or wasted within each group are provided in Table 8.
Table 8. The Food Loss and Waste Rates in Turkey (Tabularized from [178]) THE SUPPLY CHAIN STAGES Postharvest handling and storage (%)
Processing & Packaging Distribution (%) (%)
Consumption at household (%)
Food Waste & Loss (%) (Calculated Average)
FOOD GROUPS
PRIMARY FOOD PRODUCTS
Cereals
Wheat, barley, corn
4
2
1
5
11.52
Roots and Tubers
Sugar beet, Potatoes
6
2
3
2
12.43
Oilseeds
Sunflower seeds and sesame seeds, Oil crops, Vegetable Oils (excl. Olive oil)
5
7
1
4
16.03
Pulses
Chickpeas, lentils and dry beans
5
7
1
4
16.03
Vegetables
Tomatoes, peppers and cucumbers
8
10
10
5
29.21
Fruits
Grapes, olives and apples; Olive oils
8
10
10
5
29.21
Meat
Meat (beef, chicken, mutton and goat)
0,2
5
0,5
1
6.61
Fish and Seafood
All
0,02
0,04
0,01
2
2.07
Milk
Milk (cattle, sheep, goat and buffalo)
1
1,5
6
1,5
9.71
Eggs
Eggs
1
2
1
0,01
3.96
The waste and loss rates at the agricultural production stage were excluded from calculations as the FBS data are assumed to be compiled from the official statistics, recorded after the agricultural production is complete. The average food loss and 27
waste rates were the average of rates at the supply chain stages indicated in the Table above. 2.1.1 Statistical Analysis: Extrapolation of the Food Consumption Data to Project the Income-dependent 2050 Dietary Scenarios for Turkey FAO FBS data were used to construct the income-dependent 2050 dietary scenarios for Turkey. The historical food demand data was put together from the FAOSTAT database for the years 1980 to 2010. The historical demand for the selected food groups in EU28 was also gathered as a benchmark for Turkish consumption. Historical data on per-capita income were gathered from an open-source study, carried out in 2015 to project the global food demand in the coming century [140]. They also provided the per capita income projections for more than 160 countries, which were in constant US$2005 based on market exchange [140]. The EU28 weighted average income per capita was calculated using the same data. The historical population data were multiplied with the per capita GDP to calculate the EU28 total GDP for each year. Then, the total GDP of EU28 was divided by the total population of EU28 to obtain weighted average income per capita in EU28. Bodirsky and others (2015) [140] calculated the income projections based on the Special Report on Emissions Scenarios (SRES) storylines, which are developed by IPCC to describe the relationship of the drivers of GHG emissions and climate change as well as to predict the future relationships to develop mitigation strategies. There are 4 storylines developed by IPCC [179]. A1 and A2 scenarios describe a world where the main emphasis is on the economic and technological growth. A1 scenario describes a globalized world with globalized economic growth whereas, A2 describes a regional one. For this study, A1 and A2-based income scenarios, gathered from [140], were used to statistically model the relationship between the income and meat demand, total calorie supply and empty calorie supply as the intake of meat and empty calories are claimed to increase with rising income [17], increasing the total calories daily. Then, the A1 and A2 income scenarios-based projections were used to predict the income-dependent food demand in 2050. 28
Different linear or non-linear regression models can be applied to formulate the relationship between food demand and income (See [17], [140], [142], [146]). For this study, the food demand was assumed to be in relation with income only as the data on other regressors are not available for use. Following the approach by Cole and McCoskey [142], EKC in a quadratic shape was applied to extrapolate and forecast the income-dependent 2050 diet. The data was prepared and analyzed using the statistical software JMP by SAS [180]. The linear and nonlinear regressions were carried out to compare the accordance of them to the data points based on the main statistical approaches. The meat demand and total calories were plotted against the historical data on percapita income for the years 1980 to 2010. The Figure 5 (A and B) presents the scatterplot drawn to see the potential relationship between income and meat demand in Turkey and in EU28.
A
B
Figure 5. The relationship between meat demand and income (Turkey and EU28). EU: European Union, TR: Turkey. (A: The relationship between meat demand by weight and the income in GDP/capita; B: The relationship between total calories and the income in GDP/capita) The linear relationships, which are curvilinear as shown above, between income (GDP capita-1 year-1), meat demand (kg capita-1 year-1) and total calorie demand 29
(kcal capita-1 day-1) were ensured by plotting a scatter diagram. Then, the possibility of an Environmental Kuznets relationship was examined and a quadratic relationship was tested for the formulation below: 𝑀𝑒𝑎𝑡 = 𝛼 + 𝛽* 𝑥 𝐼𝑛𝑐𝑜𝑚𝑒 + 𝛽1 𝑥 𝐼𝑛𝑐𝑜𝑚𝑒 1 + 𝜀
(1)
The empty calories are the total caloric demand for the animal fats, oils, sugars and alcohol [17]. The assumption of Environmental Kuznets Curve was also applied to the total empty calories demand. The total empty calories demand per capita in Turkey was plotted against the historical data on per-capita income for the years 1980 to 2010 to test any relationship. The scatterplot of this relationship is given in Figure 6 (A and B). The scatter plot reveals a linear relationship between income (GDP capita-1 year-1) and empty calories demand (kcal capita-1 day-1). In order to make sure that the empty calories supply and income has a similarity to EKC, the EU28 data for empty calories supply and income was also settled into the graph (as EU28 is selected as a benchmark because of their higher income levels). The Figure 6-B provides both empty calories supply for EU28 and Turkey versus the average income levels per capita. When the EU28 data for empty calories were added to the scatter plot, the linear relationship between the income and empty calories turned into a quadratic polynomial. Based on this result, it was assumed that, the Turkish empty calories supply would follow a trend similar to the EU28.
30
A
B
Figure 6. The relationship between total energy and empty calories with income (Turkey and EU28). EU: European Union, TR: Turkey The projected meat supply/demand in kg capita-1 year-1, total calorie supply and empty calories supply in kcal capita-1 day-1 values for 2050 were used to construct two income-dependent 2050 diets (ID 2050 A1 and A2), as the projections were made based on two income scenarios. The daily meat calorie supply levels were calculated from meat supply in kg capita-1 year-1. The sum of projected meat calories and empty calories per day were extracted from the projected total calorie supply. The rest of the calories were compared with the 2013 diet and a ratio of change was calculated. The ratio was applied to the rest of the food groups and without changing the food pattern in the groups, the calorie and kg per year supply levels for all food products were determined. All dietary scenarios that were constructed to be used in environmental and nutritional assessment are provided in Appendix C. 2.2 Water Footprint Assessment to Quantify the Dietary Water Consumption There are two main approaches for the assessment of Water Footprint (WF) in scientific literature. The first one is the approach developed by the Water Footprint Network [127] and the second one is developed for the Life Cycle Approaches by the LCA community [181]. As the WF methodology is more detailed and employed 31
by numerous studies to assess the WF related to the dietary consumption (See: [129], [134], [137]), the same approach is used in this study. Mekonnen and Hoekstra [182] calculated the water footprint of consumption for food products for regions, countries and the basins of a specific country. In addition, weighted averages for the countries were also calculated for the time period 1996 to 2005. The average water footprint of consumption data for the food products in Turkey were gathered from the data set as provided in [182]. The WF of consumption for fish and other seafood are not included in the data set so they were excluded from the WF assessment of the dietary scenarios. The weighted average water footprint of consumption of the food products in Turkey was multiplied by the food supply amounts constituting the dietary scenarios. All three components of the WF (green, blue and grey) were calculated for the Turkish dietary scenarios constructed. 2.3 Life Cycle Approaches to Quantify the Dietary GHG emissions The GHG emissions associated with food products are generally calculated by using life cycle methodologies in the literature. To find the GHG emissions for the food products, a meta-analysis was conducted as there is not enough country-specific life cycle or carbon footprint data in Turkey to calculate the actual GHG emissions of food supply. The meta-analysis conducted in the life cycle assessment studies that were carried out in the Mediterranean Region were used to compile the Mediterranean average life cycle GHG emission factors per kg of each food product. The life cycle assessment studies carried out in Mediterranean countries including France, Greece, Italy, Spain and if possible, Turkey, Portugal and Cyprus were used to compile the Mediterranean average GHG emission factors for food products and groups. The food life cycle databases, AGRIBALYSE [183] and Agri-Footprint [184] were also examined to find additional GHG emission factors on food products. The emission factors found for each food product in literature were selected kgproduct as the functional unit. They were classified according to the system boundaries selected by the scientific study for life cycle assessment. Then, the data with same system boundaries (and mostly cradle-to-gate) were chosen to calculate 32
the Mediterranean average for that specific food product. Due to the differences in climate, production methods and technologies as well as the use of chemicals, applied among the Mediterranean countries in agricultural production; the maximum, minimum and average life cycle GHG emission factors found for most of the food products were incorporated in estimating the GHG emissions of the dietary scenarios. The minimum and maximum emission factors were used to provide a range of GHG intensity for each food product. GHG emission factors for 64 food products were compiled. Based on the countryspecific GHG emissions, a Mediterranean average was calculated for more than 50% of the food products in the food supply list provided by FAOSTAT (38 food products). For some of the products, there was only one scientific publication or data provided for one of the countries in the selected research region. For that reason, that single GHG emission factor was used as the Mediterranean average in calculations (13 food products). For the food products that did not have any LCA studies carried out in the research region, the GHG emissions calculated with a Life Cycle approach in other countries (US, The Netherlands, Sweden, Brazil, Philippines, Ecuador) were used as emission factors (13 food products). The Mediterranean Average GHG emission factors of food products were used in quantifying the GHG emissions associating with food consumption given in the dietary scenarios. The minimum and maximum GHG emission estimates were also included to create ranges of emission for each food product. The Appendix D includes the detailed results of the metaanalysis carried out in literature as well as the Mediterranean average GHG emission factors for foods. To quantify the total GHG emissions of the dietary scenarios, the Mediterranean average GHG emissions associated with food products were multiplied with the food supply per capita per day in the dietary scenarios. Then, the daily GHG emissions associated with the dietary scenario as well as the GHG emission per kcal of diet were calculated to carry out comparisons in between the dietary scenarios.
33
2.4 Assessment of Health Implications of the Dietary Patterns For the nutrition and health assessment, all dietary scenarios were adjusted to probable food loss and waste, then the total calories were degraded to 2000 kcal-day basis. The total energy of the Mediterranean and healthy dietary scenarios (TDG-H) was calculated using the nutritional information provided in FAOSTAT [18] to make those scenarios compatible with other diets. The energy associated with TDG-H was found to be 7% higher than the energy level calculated for the same diet in the guidelines, [170]. The total calories associated with the Mediterranean Diet was calculated as 2579 kcal capita-1 day-1; which was 29% more than the calculated calories in [16]. Secondly, the dietary scenarios developed were assessed due to their health implications. The adherence to the dietary guidelines was selected as the first indicator to qualitatively assess the nutritional quality of the dietary scenarios. In addition, the epidemiological studies were referred in discussing the health implications of the dietary scenarios. For this study, coronary heart disease (CHD) was selected as the indicator of health gain and the dietary indicators were determined based on the probable or convincing causal relationships they have on CHD. The following causal relationships were considered in qualitatively assessing the diets in terms of health: 1) Higher consumption of fruits and vegetables lower the risk of obesity and cardiovascular diseases (especially CHD) with evidence ([149], [156]). 2) Increase in the consumption of fish is associated with lower risk of coronary heart disease (CHD) ([156]). 3) The limited saturated fatty acid (SFA) intake is associated with lower risk of CHD ([149], [158]). 4) Replacing calories from carbohydrates or SFA with PUFA have significant benefits on CHD ([156], [158]). 5) Increased consumption of pulses, nuts and seeds will lower the risk of CHD [156]. 34
Risk relationships of fruits, vegetables, pulses, nuts and seeds and fish intake as well as share of PUFA calories in total energy with coronary heart disease (CHD) were compiled from recently published epidemiological studies. The indicated food groups and PUFA content were selected as the indicator for assessing the health implications of diets as they were the most frequently studied dietary and nutritional factors in relation to health as there is causal relationships between them and CHD with probable or convincing evidence [156]. The optimal intake levels in [156], that were determined considering the lowest disease risk-associated amounts in metaanalyses, feasibility and consistency with global extensive dietary guidelines, were assumed to be another healthy eating indicator. The risk relationships for the intake levels of the indicated food groups and the share of PUFA in total energy are summarized in Table 9.
Table 9. Estimates of causal relationships of dietary factors with probable or convincing evidence and risk of CHD (Tabularized from [156]) DIETARY FACTORS
Relative Risk (a)
Food Group
Optimal Intake Health (b) Outcome
MIN
MAX
AVG
Fruits
300
Lower CHD
0,91
0,98
0,94
Vegetables
400
Lower CHD
0,92
0,98
0,95
Pulses
100
Lower CHD
0,65
0,9
0,77
Lower CHD Lower CHD Fish and Seafood 50 (fatal) NUTRIENT-RELATED FACTORS
0,67
0,84
0,78
Nuts and Seeds
20
0,9 0,98 0,94 Relative Risk (a)
Nutrients
Optimal Intake Health (b) Outcome
MIN
MAX
AVG
PUFA replacing carbohydrates
11%E
Lower CHD
0,85
0,94
0,9
PUFA replacing SFA
11%E
Lower CHD
0,87
0,96
PUFA replacing SFA or carbohydrates
12%E ± 1.2%E
Lower CHD
Unit of Relative Risk in case of increase per 100 g/day intake per 100 g/day intake per 100 g/day intake per 4 servings/week per 15 g/day intake Unit of Relative Risk in case of increase
[156] [156] [156] [156] [156]
Reference
[156]
0,96
per 5%E/day intake per 5%E/day intake
0,87
per 5%E/day intake
[158]
(a) increased consumption of each dietary target per unit of relative risk and respective change in disease risk (b) Calculated For 2000 kcal per day diet
35
Reference
[156]
In addition, using the approach in Healthy Eating Index by Kennedy and others (1995) [160] and the optimal intake levels, as indicated in Table 9, the health scores for the dietary scenarios were calculated based on the 5 nutritional indicators; the intake of fruits, vegetables, pulses, nuts and seeds and fish, using the following formula: 𝐻𝑒𝑎𝑙𝑡ℎ 𝑆𝑐𝑜𝑟𝑒89: = ; NJADEF: 1H
+
; ?@;@A=BC@DEF:
; IKDOEF: PH
GHH
+
; I