Verhoeven et al. Int J Health Geogr (2018) 17:16 https://doi.org/10.1186/s12942-018-0136-x
International Journal of Health Geographics Open Access
RESEARCH
Differences in physical environmental characteristics between adolescents’ actual and shortest cycling routes: a study using a Google Street View‑based audit Hannah Verhoeven1,2,3* , Linde Van Hecke1,2,3, Delfien Van Dyck3,4, Tim Baert5, Nico Van de Weghe5, Peter Clarys2, Benedicte Deforche1,2 and Jelle Van Cauwenberg1,3
Abstract Background: The objective evaluation of the physical environmental characteristics (e.g. speed limit, cycling infrastructure) along adolescents’ actual cycling routes remains understudied, although it may provide important insights into why adolescents prefer one cycling route over another. The present study aims to gain insight into the physical environmental characteristics determining the route choice of adolescent cyclists by comparing differences in physical environmental characteristics between their actual cycling routes and the shortest possible cycling routes. Methods: Adolescents (n = 204; 46.5% boys; 14.4 ± 1.2 years) recruited at secondary schools in and around Ghent (city in Flanders, northern part of Belgium) were instructed to wear a Global Positioning System device in order to identify cycling trips. For all identified cycling trips, the shortest possible route that could have been taken was calculated. Actual cycling routes that were not the shortest possible cycling routes were divided into street segments. Segments were audited with a Google Street View-based tool to assess physical environmental characteristics along actual and shortest cycling routes. Results: Out of 160 actual cycling trips, 73.1% did not differ from the shortest possible cycling route. For actual cycling routes that were not the shortest cycling route, a speed limit of 30 km/h, roads having few buildings with windows on the street side and roads without cycle lane were more frequently present compared to the shortest possible cycling routes. A mixed land use, roads with commercial destinations, arterial roads, cycle lanes separated from traffic by white lines, small cycle lanes and cycle lanes covered by lighting were less frequently present along actual cycling routes compared to the shortest possible cycling routes. Conclusions: Results showed that distance mainly determines the route along which adolescents cycle. In addition, adolescents cycled more along residential streets (even if no cycle lane was present) and less along busy, arterial roads. Local authorities should provide shortcuts free from motorised traffic to meet adolescents’ preference to cycle along the shortest route and to avoid cycling along arterial roads. Keywords: Active transport, Cycling, Route choice, Physical environment, Audit, Youth
*Correspondence:
[email protected] 1 Department of Public Health, Faculty of Medicine and Health Sciences, Ghent University, Corneel Heymanslaan 10, 9000 Ghent, Belgium Full list of author information is available at the end of the article © The Author(s) 2018. This article is distributed under the terms of the Creative Commons Attribution 4.0 International License (http://creativecommons.org/licenses/by/4.0/), which permits unrestricted use, distribution, and reproduction in any medium, provided you give appropriate credit to the original author(s) and the source, provide a link to the Creative Commons license, and indicate if changes were made. The Creative Commons Public Domain Dedication waiver (http://creativecommons.org/ publicdomain/zero/1.0/) applies to the data made available in this article, unless otherwise stated.
Verhoeven et al. Int J Health Geogr (2018) 17:16
Background Air pollution, which is partially caused by vehicle emissions, is consistently related to acute respiratory infections among young children, cardiopulmonary disease and lung cancer [1]. By replacing private car use (passive transport) by active modes of transport such as cycling, carbon dioxide emissions can be reduced substantially [2]. Although the risk of a higher intake of carbon dioxide can be considered as a negative aspect of active transport [3], a growing body of evidence emphasizes the potential benefits of cycling for transport for public health [2, 4]. Since adolescence is characterised by a steep decrease in physical activity levels [5], increasing cycling for transport is also a promising strategy to meet the recommended 60 min of daily physical activity among adolescents [4, 6]. Cycling for transport has been associated with higher levels of cardiorespiratory fitness [7] and lower levels of overweight [8] among adolescents and it can easily be incorporated into their daily lives once the skills for cycling have been acquired [9]. The role of the physical environment for health behaviours such as cycling for transport has been acknowledged by socio-ecological models and previous research [10–12]. However, the majority of previous studies investigating physical environmental correlates of cycling for transport focused on the neighbourhood environment close to home, although cycling for transport does not necessarily take place in the immediate neighbourhood environment. Nevertheless, the evaluation of physical environmental characteristics along adolescents’ actual cycling routes remains understudied, although it is important to find out why individuals chose a specific cycling route. In addition, although previous studies emphasized the importance of distance for adolescents’ cycling for transport [12–14], it is likely that adolescents do not always take the shortest cycling route. By comparing adolescents’ actual cycling routes with the shortest possible cycling routes, important information regarding which physical environmental characteristics determine the route choice of adolescent cyclists may be obtained. Among adults, two recent studies compared physical environmental characteristics of actual and shortest cycling routes [15, 16]. Winters et al. [16] found that actual cycling routes of Canadian adults had significantly more traffic calming facilities (e.g. traffic circles or median barriers to slow or block motorized traffic) and participants cycled less along arterial (busy) roads and more along local roads, off-street paths and roads with cycling facilities. Krenn et al. [15] also found that Austrian cyclists avoid busy roads and prefer roads with cycle lanes. Actual cycling routes included more green and aquatic areas and had fewer traffic lights, fewer crossings and less hilly roads compared to the shortest routes.
Page 2 of 15
Compared to the shortest routes, land use mix (i.e. the extent to which several types of land use, such as residential and industrial areas, shops, services, are included in an area) was significantly higher along actual cycling routes. A study among children in the Netherlands (8–12 years) found that there were significantly fewer trees, zebra crossings and sidewalks along actual cycling routes compared to the shortest routes [17]. In addition, actual cycling routes had significantly more traffic lights, junctions and a higher chance of being on residential streets compared to the shortest routes. Safety showed thus to be an important factor among children in this study. According to Dessing et al. [17], most of the zebra crossings in the Netherlands are located on or near busy streets, that were avoided by the children. Furthermore, when main roads have to be crossed children preferred signalized intersections. Because of some inconsistent results across these previous studies, similar studies among adolescents may provide additional insights into which physical environmental factors are related to an individuals’ route choice. Methodologies to assess the physical environment include both subjective and objective measurements. Subjective measurements, such as self-reported questionnaires, encounter limitations such as recall bias [18] and may not accurately assess the effect of the actual physical environmental factors on cycling for transport [11]. Therefore, observational field audits are frequently applied as an objective tool for measuring the physical environment related to physical activity [19–21]. Vanwolleghem et al. [22] developed EGA-Cycling (Environmental Google Street View Based Audit-Cycling) to virtually assess physical micro- and macro-environmental characteristics along cycling routes using Google Street View. EGA-Cycling was based on existing audit instruments (e.g. Pikora-SPACES instruments [20], Audit Tool Checklist version [21], Irvine-Minnesota Inventory [23]), but was adapted to the Flemish street infrastructure. In the last decade, using virtual technologies, such as Google Street View, to assess the physical environment is gaining attention [24–29]. Auditors are able to virtually walk through a street which is time- and cost-saving [24, 28] and they are not exposed to unsafe (traffic) situations compared to field audits. Previous studies showed good agreement between virtual and field audit tools [24, 26, 29]. However, virtual audit tools showed to be less accurate when measuring micro-environmental characteristics (e.g. litter, sidewalk condition) [24, 26, 28]. Nevertheless, Ben-Joseph et al. [28] concluded that Google Street View was more accurate in measuring small features compared to Google Maps and MS Visual Oblique. The aim of the present study is to gain insight into the physical environmental characteristics determining the
Verhoeven et al. Int J Health Geogr (2018) 17:16
route choice of adolescent cyclists by comparing differences in physical environmental characteristics between their actual cycling routes and the shortest possible cycling routes using a Google Street View-based audit (EGA-Cycling).
Methods Participants
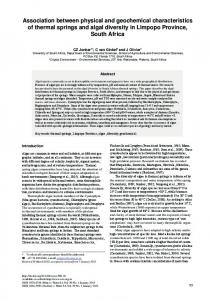
A convenience sample of 12 secondary schools in and around Ghent was contacted to participate in the study. Ghent is a city in Flanders, northern part of Belgium, that has 253,266 inhabitants and comprises an area of 156.2 km2 (population density: 1622 h/km2) [30, 31]. In the six schools that agreed to participate, school principals or staff members randomly selected at least two classes from the first to fourth grade (12–16 years). A total of 18 classes was selected and 283 adolescents were invited to participate in the study. Only participants who were present at school when measurement materials were handed out, could be included in the study. Passive informed consent was obtained from adolescents’ parents. If parents did not agree to let their child participate in the study, they had to sign a form. Furthermore, researchers also obtained active informed consent from adolescents. This procedure resulted in a group of 238
Fig. 1 Flow chart
Page 3 of 15
adolescents (response rate = 84.1%) participating in the study. Study protocol
The study protocol consisted of two parts (see Fig. 1 for a flow chart). In the first part of the study, each participating school was visited three times by the research team between September and December 2015. During a first visit, the purpose of the study was explained to the adolescents and informed consent was obtained. Each participant received a unique ID number in order to be able to link data of all measurements. Participants completed a questionnaire assessing socio-demographics. Furthermore, participants received a Global Positioning System (GPS) device and a charger for the device together with verbal and written instructions on how and when to wear the device. All participants were instructed to wear the GPS device, which was attached to their waist with an elastic belt, during waking hours until the research team returned to the school to collect the devices (4–5 days later). During activities that could damage the GPS device or during which it could be uncomfortable to wear it (e.g. showering, swimming or rugby), the adolescents were asked to temporarily remove the GPS device. They were also instructed not to turn off the GPS device during data collection. Participants were asked for their
Verhoeven et al. Int J Health Geogr (2018) 17:16
mobile phone number. Two text messages per day (in the morning and evening) were sent to the participants willing to give their number in order to remind them to wear the GPS devices and to charge it. During a second visit, researchers returned to the schools to collect the devices. Afterwards, the GPS data were downloaded and a web application was created in order to visualize the data on a personal travel map. During the last visit, which took place within the first week after collection of the GPS devices, researchers conducted a structured one-on-one interview (Additional file 1) during which a researcher chronologically discussed the personal travel maps. Per trip travelled, participants were asked about their transport mode and why they took a particular route. Participants who completed all measurements and returned the GPS device received an incentive (i.e. movie ticket). In the second part of the study, adolescents’ cycling routes were selected, and for each actual cycling route the shortest cycling route was calculated using Google Maps. For each cycling route which was not the shortest cycling route, an adapted version of EGA-Cycling was used to obtain information about physical environmental characteristics along adolescents’ actual cycling routes and along the corresponding shortest routes using Google Street View. The study protocol was approved by the Ethics Committee of the University Hospital of Ghent University (EC 2015/0317). Measurements and data processing Questionnaire
Participants completed a paper-and-pencil questionnaire assessing following socio-demographics: home address, gender, date of birth, grade (first to fourth year), educational type (general, technical or vocational) and highest education of parents (primary education, secondary education, tertiary education-non university, tertiary education-university, I don’t know). Education of parents was used to as a proxy for socio-economic status (SES). Adolescents were identified as being ‘of a higher SES family’ when at least one parent completed tertiary education [32]. GPS device
The geographical position of participants was recorded by the QStarz BT-Q1000X GPS device. In addition, the GPS device recorded participants’ speed which was used to define their transport mode [33]. The GPS devices were set to collect data every 30 s using Q-travel software. Furthermore, the devices were set to stop logging when the memory was full (this did not occur during data collection). Q-travel software was used to download the collected GPS data.
Page 4 of 15
Structured one‑on‑one interview with personal travel maps
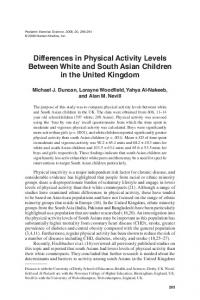
GPS data were stored in a PostgreSQL database with PostGIS in order to generate a personal travel map per day in the web application. This web application showed the geographical position of participants for every 30-second-interval. Figure 2 shows an example of a personal travel map. These personal travel maps were used as a guide to conduct a structured one-onone interview discussing routes on two selected days. The first week- and weekend day with complete data (excluding the day the devices were handed out) were selected for the interview. When no weekdays with complete data were available, two weekend days were selected and vice versa. When only 1 day with complete data was available, the structured interview was completed for 1 day. During these interviews, a researcher chronologically identified, together with the participants, the trips they made during a day. For each identified trip, the participant was asked which transport mode was used. For active trips (walking or cycling/ skateboard/…) the participant was also asked why he/she chose that particular route to reach his/her destination. GPS data processing
Data processing was executed using the Personal Activity and Location Measurement System (PALMS©) [34, 35]. PALMS filtered invalid GPS data when extreme speed (> 150 km/h) or extreme changes in distance (> 1000 m) or elevation (> 100 m) between two consecutive data points were identified. The programming software Python was used to combine the PALMS dataset with information on school schedules of each participating class, school addresses and home addresses of participants. PALMS categorised data into location (home, school, leisure) or transport. Data were categorised in the domain ‘transport’ when a trip was detected. A trip was defined as a period of at least 3 min of movement with the same transport mode, allowing for stationary periods of maximum 3 min. PALMS classified all trips into walking, cycling or motorised transport based on speed. A trip was classified as walking when speed was between 1 and 9 km/h, cycling between 10 and 24 km/h and motorised transport starting from 25 km/h [33, 36]. Subsequently, all data from the structured one-on-one interviews were inserted into the database. For trips or locations that were misclassified by PALMS [e.g. when a car trip was classified as a bicycle trip due to traffic congestion (speed