Neurobiology of Disease 104 (2017) 33–40
Contents lists available at ScienceDirect
Neurobiology of Disease journal homepage: www.elsevier.com/locate/ynbdi
Differences in white matter structure between seizure prone (FAST) and seizure resistant (SLOW) rat strains Pragati Sharma a,⁎, David K. Wright b,c, Leigh A. Johnston b,d, Kim L. Powell a, Mary E. Wlodek e, Sandy R. Shultz a, Terence J. O'Brien a, Krista L. Gilby a a
Department of Medicine, The Royal Melbourne Hospital, The University of Melbourne, Parkville, Victoria 3050, Australia The Florey Institute of Neuroscience and Mental Health, Parkville, Victoria 3052, Australia Anatomy and Neuroscience, The University of Melbourne, Parkville, Victoria 3010, Australia d Department of Electrical and Electronic Engineering, The University of Melbourne, Parkville, Victoria 3010, Australia e Department of Physiology, The University of Melbourne, Parkville, Victoria 3010, Australia b c
a r t i c l e
i n f o
Article history: Received 13 October 2016 Revised 20 March 2017 Accepted 27 April 2017 Available online 1 May 2017 Keywords: White matter Seizure susceptibility Diffusion tensor imaging Epilepsy Neurodevelopmental disorders
a b s t r a c t Alterations in white matter integrity have been well documented in chronic epilepsy and during epileptogenesis. However, the relationship between white matter integrity and a predisposition towards epileptogenesis has been understudied. The FAST rat strain exhibit heightened susceptibility towards kindling epileptogenesis whereas SLOW rats are highly resistant. FAST rats also display behavioral phenotypes reminiscent of those observed in neurodevelopmental disorders that commonly comorbid with epilepsy. In this study, we aim to identify differences in white matter integrity that may contribute to a predisposition towards epileptogenesis and its associated comorbidities in 6 month old FAST (n = 10) and SLOW (n = 10) male rats. Open field and water consumption tests were conducted to confirm the behavioral phenotype difference between FAST and SLOW rats followed by ex-vivo diffusion-weighted magnetic resonance imaging to identify differences in white matter integrity. Diffusion tensor imaging scalar values namely fractional anisotropy, mean diffusivity, axial diffusivity and radial diffusivity were compared in the anterior commissure, corpus callosum, external capsule, internal capsule, fimbria and optic tract. Electron microscopy was used to evaluate microstructural alterations in myelinated axons. Behavioral phenotyping confirmed higher activity levels (distance moved on days 2–4, p b 0.001; number of rearings on days 2 and 4, p b 0.05 at both days) and polydipsia (p b 0.001) in FAST rats. Comparative analysis of diffusion tensor imaging scalars found a significant decrease in fractional anisotropy in the corpus callosum (p b 0.05) of FAST versus SLOW rats. Using electron microscopy, alterations in myelinated axons including increased axon diameter (p b 0.001) and reduced g-ratio (p b 0.001) in the midline of the corpus callosum in 6 month old FAST (n = 3) versus SLOW (n = 4) male rats. These findings suggest that differences in white matter integrity between FAST and SLOW rats could be a contributing factor to the differential seizure susceptibility and behavioral phenotypes observed in these strains. © 2017 Elsevier Inc. All rights reserved.
1. Introduction Myelin plays an important role in efficient signal conduction within neurons, thus aberrations in white matter can negatively impact structural connectivity in the brain (Pannek et al., 2014). Alterations in white matter integrity have been well documented in a spectrum of neurological disorders, including acquired epilepsy (Riley et al., 2010). Progressive changes in white matter integrity have also been
⁎ Corresponding author at: Kenneth Myer Building, 30 Royal Parade, The University of Melbourne, Parkville, Victoria 3010, Australia. E-mail addresses:
[email protected],
[email protected] (P. Sharma). Available online on ScienceDirect (www.sciencedirect.com).
http://dx.doi.org/10.1016/j.nbd.2017.04.022 0969-9961/© 2017 Elsevier Inc. All rights reserved.
documented in chronic epilepsy (Chiang et al., 2016; Glenn et al., 2016), however whether those changes are associated with a higher risk of developing epilepsy is poorly understood. Given the obvious challenge of investigating predisposing factors to epileptogenesis in clinical studies, where patients generally have developed epilepsy at the time of diagnosis, experimental studies in rodent models of acquired epilepsies have been highly beneficial. Such studies have provided insight into neurobiological changes occurring during epileptogenesis and have demonstrated the presence of aberrant white matter prior to the onset of spontaneous seizures (Parekh et al., 2010). However, these studies involved infliction of a brain insult (e.g., status epilepticus), which would clearly influence myelin structure. Therefore, inherent structural abnormalities present prior to the brain insult that may predispose towards epileptogenesis are yet to be investigated.
34
P. Sharma et al. / Neurobiology of Disease 104 (2017) 33–40
To investigate genetically determined neurobiological factors that may predispose towards epileptogenesis, a rodent model was developed through selective breeding deriving two rat strains with differing susceptibility to amygdala kindling epileptogenesis: namely the seizure ‘prone’ FAST and ‘resistant’ SLOW rat strains (Racine et al., 1999). Along with enhanced vulnerability towards kindling, FAST rats also display behavioral phenotypes (Anisman and McIntyre, 2002; Gilby et al., 2007b; Reinhart et al., 2004; Shultz et al., 2015a) reminiscent of those observed in some neurodevelopmental disorders, providing an opportunity to study common underlying factors supporting the comorbidity between epilepsy and associated neurodevelopmental disorders (Chou et al., 2013; Woolfenden et al., 2012). Diffusion Weighted Imaging (DWI)1 is a non-invasive MRI technique that measures the degree of water diffusion, and is a commonly used as a marker of white matter integrity (Dedeurwaerdere et al., 2014; Mukherjee et al., 2008). Water diffusion is restricted perpendicular to myelinated axons and diffuses more freely parallel to myelinated fiber bundles, providing a method by which to characterize white matter structure (Assaf and Pasternak, 2008; Mukherjee et al., 2008). White matter integrity is based on the directionality of water diffusion and can be quantified from DWI acquisitions by Diffusion Tensor Imaging (DTI) scalar measures, such as fractional anisotropy (FA) and mean diffusivity (MD). FA is a measure of the degree of anisotropy and MD is a measure of average diffusivity (Alexander et al., 2007). MD can further be decomposed into axial diffusivity (AD) and radial diffusivity (RD) that correspond to parallel and perpendicular diffusivity, respectively (Alexander et al., 2007; Mukherjee et al., 2008). DWI studies in epilepsy (Riley et al., 2010; Widjaja et al., 2013) and associated neurodevelopmental disorders (Park et al., 2016; Vogan et al., 2016) have documented alterations in various white matter fiber tracts including thalamo-cortical tracts, fimbria-fornix, cortico-spinal tract, anterior commissure, cingulum, cerebellar peduncles, external and internal capsule, optic tract and corpus callosum. In addition, some studies have further examined the DWI reported altered white matter regions using histological studies (Concha et al., 2010; Eijsden et al., 2011) and observed alterations in common parameters that characterize myelinated axons including axon diameter, myelin thickness and g-ratio, the ratio of the inner to the outer diameter of the myelin sheath. In this study we investigated whether alterations in white matter integrity are related to susceptibility towards epileptogenesis by examining specific white matter regions in the brains of adult FAST and SLOW rats using ex-vivo DWI. Additionally, characterization of white matter abnormalities in regions detected using DWI was also conducted at the anatomic cellular level using electron microscopy. 2. Materials and methods 2.1. Animals The FAST and SLOW rat strains were originally developed via selective cross breeding of parental populations of Wistar and LEH rats and were based on fast and slow rate of amygdala kindling (Racine et al., 1999). The rate of kindling was characterized by the number of electrical stimulations needed to induce Class V behavioral seizures, which is the most severe seizure class according to Racine's scale of motor seizures (Racine, 1972). The animals used in this study were bred from colonies established in The Florey Institute of Neuroscience and Mental Health Animal Facility, The University of Melbourne, Melbourne, Australia, from rats imported from the original FAST and SLOW colonies at Carleton University, Ottawa, Ontario, Canada. All experimental
1
DWI = diffusion weighted imaging, DTI = diffusion tensor imaging, FA = fraction anisotropy, MD = mean diffusivity, AD = axial diffusivity, RD = radial diffusivity, ROI = region of interest, TEM = transmission electron microscopy
procedures were in accordance with the Australian Code of Practice for the care and use of animals in scientific purposes by The University of Melbourne Ethics Committee and The Florey Institute of Neuroscience and Mental Health Animal Ethics Committee. Two separate cohorts were used in this study: 1) DWI cohort; 2) histology cohort. Rats were housed in acrylic cages at a controlled temperature (21 ± 1 °C) under a 12 h light/dark cycle (lighting switched on between 7 a.m. and 7 p.m.) with ad libitum access to food and water. 2.2. Behavioral phenotyping To confirm that FAST compared to SLOW rats display similar behavioral phenotypes to those observed in neurodevelopmental disorders, FAST (n = 10) and SLOW (n = 10) male rats (approximately 5 months old, weighing between 350 and 500 g) were examined for hyperactivity and polydipsia, which have both been reported previously in FAST (Gilby and O'Brien, 2013; Gilby et al., 2007b) rats as well as in patients with epilepsy (Okazaki et al., 2007) and neurodevelopmental disorders (Terai et al., 1999), using the open field and water consumption tests respectively. Following the open field test, rats were individually housed to measure water consumption. The two tests were separated by three days to ensure stress levels were normalized. 2.2.1. Open field test This test was used to measure locomotor activity and exploratory behavior over four consecutive days with one trial each day as previously described (Johnstone et al., 2015; Jones et al., 2008; Shultz et al., 2015b). Each rat was placed in the centre of an enclosed circular arena (100 cm diameter) with 30 cm tall surrounding walls and approximately 100 lx lighting. In each trial, rats were allowed to move freely within the arena for 10 min. Total distance travelled (cm) and number of rearings were measured for each trial using Ethovision® 3.1 Tracking Software (Noldus, The Netherlands). 2.2.2. Water consumption Water consumption was measured as previously described (Gilby et al., 2007b) across three consecutive days. Each day, water bottles were weighed and water consumption was calculated (1 g = 1 ml water). Total water consumption for each rat was calculated as total water consumption over three days per gram body weight (ml/g) to ensure water consumption was not merely correlated with body weight. 3. DWI data acquisition and analysis After behavioral testing, FAST (n = 10) and SLOW (n = 10) male rats were deeply anaesthetized intraperitoneally with pentobarbitone sodium (325 mg/ml) at 1 ml/kg dose and brains were transcardially perfused with 200 ml phosphate-buffered saline (PBS) followed by 200 ml of a 4% paraformaldehyde (PFA) solution in 0.1 M PBS, pH 7.4. The perfused brains were post-fixed in a 4% PFA solution overnight at 4 °C, embedded in 4% agar and then stored at 4 °C for scanning with a 4.7 T Bruker Avance III scanner (Bruker™ Biospec®, Germany). The scanning was performed within 24 h of agar embedding to minimize degradation of the tissue. DWI was performed using a 2D echo planar sequence with the following imaging parameters: repetition time = 16 s, field of view = 4 × 4 cm2, echo time = 52 ms, matrix size = 160 × 160, slice thickness = 250 μm and isotropic spatial resolution = 250 × 250 × 250 μm3. Diffusion weighting was performed with diffusion gradient duration (δ) = 5 ms, diffusion gradient separation (Δ) = 14 ms and b-value = 2500 s/mm2, in 126 non-collinear directions with 10 non-diffusion weighted images (b0). 3.1.1. Image processing and analysis Image processing for analysis was done using the FMRIB software library (FSL, http://fsl.fmrib.ox.ac.uk/fsl) and Diffusion Tensor Imaging Toolkit (DTI-TK, http://dti-tk.sourceforge.net) as previously described
P. Sharma et al. / Neurobiology of Disease 104 (2017) 33–40
(Tan et al., 2016; Webster et al., 2015; Wright et al., 2016). Raw DWI data volumes were converted into DTI volumes using DTIFit, part of the FMRIB diffusion toolbox (FDT, part of FSL). The DTI volumes were pre-processed, registered and spatially normalized using DTI-TK to create population specific DTI templates for FAST and SLOW cohorts. These templates were then combined into a study-specific template (SLOW + FAST standard template). After creating the population specific templates and the study specific template, the SLOW and FAST brains in native space were mapped to the SLOW or FAST population template and then to the study-specific template. 3.1.2. Structure tracings and DTI scalar values analysis Based on clinical DTI studies demonstrating white matter aberrations in specific white matter tracts within brains of patients with epilepsy (Riley et al., 2010; Widjaja et al., 2013) and associated neurodevelopmental disorders (Park et al., 2016; Vogan et al., 2016), specific regions were selected for investigation in this study. Manual tracings of anterior commissure, forceps major of the corpus callosum, forceps minor of the corpus callosum, internal capsule, corpus callosum, fimbria, external capsule and optic tract were performed on the SLOW + FAST standard template. Anatomical boundaries were identified by cross-reference between the MRI images and the Stereotaxic Atlas of the Rat Brain, 5th edition (Paxinos and Watson, 2005). These regions were warped from the SLOW + FAST standard template to the SLOW and FAST brain in its native space using the Diffusion Tensor Imaging Toolkit (DTI-TK) (http://dti-tk. sourceforge.net/pmwiki/pmwiki.php?n=Documentation. HomePage). FA, MD, AD and RD were calculated for each region of interest (ROI) in SLOW and FAST brains using fslstats, part of the FSL toolbox. 3.2. Histology FAST (n = 3) and SLOW (n = 4) rats were deeply anaesthetized intraperitoneally with pentobarbitone sodium (325 mg/ml) at 1 ml/kg dose and brains were transcardially perfused with 200 ml phosphatebuffered saline (PBS) followed by 200 ml of 4% paraformaldehyde (PFA) solution in 0.1 M PBS, pH 7.4. A 2 mm thick coronal section containing caudal corpus callosum, corresponding to approximately Bregma −3.0, was dissected from each brain. The coronal brain slices were fixed in 4% PFA, 2.5% glutaraldehyde in 0.1 M sodium cacodylate buffer, pH 7.4 and stored overnight at 4 °C. Each section was sagittally cut at the midline and trimmed to expose the commissural fibers of the caudal
35
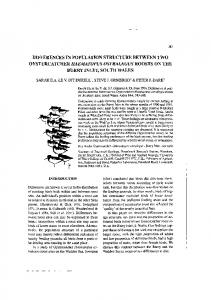
corpus callosum. The tissue was then post fixed in 1% osmium tetroxides and 1.5% potassium fluoride in distilled water to preserve myelin lipids and processed using Lynx II automatic tissue processor for resin embedding. The resin embedded tissue was trimmed into a trapezoid-shaped block containing the region of interest (ROI) using double edged blades (Personna, Verona, USA) under an intralux 4000-1, Volpi light and M0/26 microscope. To identify and check the quality of ROI for electron microscopy, 0.50 μm semi thin sections (Fig. 1A) were prepared from the resin blocks using EM UC7 ultramicrotome (Leica Microsystems, Wetzlar, Germany). Based on identified ROI from semi thin sections, 60 nm ultra thin sections were prepared using the EM UC7 ultramicrotome (Leica Microsystems, Wetzlar, Germany) by the Peter MacCallum Cancer Centre Microscopy Core Facility. The ultrathin sections were then examined using a Jeol 1011 TEM (transmission electron microscope) (Jeol, Tokyo, Japan). TEM Images were captured using a MegaView III CCD cooled camera attached with image acquisition software (Olympus, Münster, Germany) at 3000 ×, 10,000 × and 60,000 × magnification. At least seven images from different sections, covering a 14 μm distance, were captured from each animal at 3000 × magnification and used for quantification analysis. Myelin sheath of myelinated axons was manually outlined (Fig. 1B) by a single operator blinded to the strain to calculate axonal internal and fiber area using ImageJ software, USA. Further, these parameters were used to calculate axon diameter and g-ratio (the ratio of axon diameter to the axon + myelin sheath diameter).
3.3. Statistical analysis Two-way ANOVA for repeated measures with Bonferroni posthoc testing was performed for comparison of the total distance travelled, number of rearings during the open field test and DTI scalars (FA, MD, AD and RD) of ROIs. Comparisons of total water consumption and electron microscopy parameters, including axon diameter, g-ratio and number of myelinated and non-myelinated axons, were assessed for statistical significance using non parametric two tailed Mann-Whitney student U test. Multiple regression analysis was then conducted to examine the relationship between behavioral measurements and the two independent covariates, including FA of corpus callosum and strain. Statistical significance was set at α b 0.05. p values between 0.05 and 0.1 were stated to indicate trends or borderline significant differences. Statistical significance was set at p b 0.05. Data is expressed as mean ± SEM.
Fig. 1. Midline corpus callosum histology. (A) Representative of stained sections (0.5 μm) of midline corpus callosum that were used to identify region of interest (outlined by white box) for preparing sections for electron microscopy. (B) Representative electron microscopy image at 3000× magnification represents images used for manual tracings of axon and myelin sheath area surface using ImageJ software. Inlet at top right side (outline by white box) shows the axon inner (orange line) and outer fiber area (blue line) used to calculate axon diameter and g-ratio (axon diameter/outer fiber diameter).
36
P. Sharma et al. / Neurobiology of Disease 104 (2017) 33–40
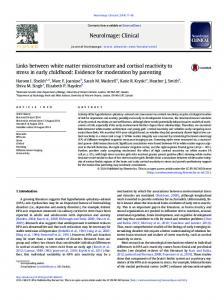
Fig. 2. Behavioral profile of FAST and SLOW rats. Relative hyperactivity and polydipsia in FAST compared to SLOW rats. (A) Total distance moved during the open field test trials; (B) number of rearings in the open field test; and (C) water (ml) consumed per body mass (g) in the water consumption test. *p b 0.05, ***p b 0.001 Two-way ANOVA with Bonferroni multiple comparisons post hoc test for the open field test and non parametric two-tailed Mann Whitney U test for the restraint test and water consumption test.
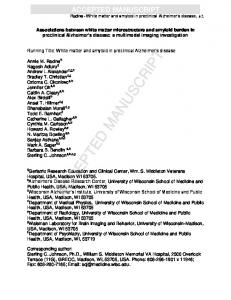
Fig. 3. DTI scalar values comparative analysis of corpus callosum between the two strains. Manual tracings on study specific template and DTI scalar values, (A–C) corpus callosum (cc), decreased FA of FAST compared to SLOW rats; (D–F) minor forceps of corpus callosum (fmi); (G–I) external capsule (ec); (J–L) forceps major of corpus callosum; fractional anisotropy (FA), mean diffusivity (MD), axial diffusivity (AD), radial diffusivity (RD). **p b 0.01 Two-way ANOVA repeated measures with Bonferroni multiple comparisons post hoc test for FA, MD, AD and RD of ROIs.
P. Sharma et al. / Neurobiology of Disease 104 (2017) 33–40
4. Results 4.1. Differential behavioral phenotype between FAST and SLOW rats On day one of the open field test, no significant difference was observed in the total distance travelled (Fig. 2A, p N 0.05) or the number of rearings (indicative of exploratory behavior) (Fig. 2Bp N 0.05) between the two strains. However, after day one, consistently higher locomotor activity was observed in FAST rats (Fig. 2A, days 2–4, p b 0.001). Moreover, activity levels of FAST rats on day 4 were not significantly different from those on day 1, suggesting that, unlike SLOW rats, FAST rats did not habituate to the novel environment. Failure of FAST rats to habituate to repeated environmental exposure was again supported by continued exploratory behavior in FAST rats, as demonstrated by significantly more rearings (Fig. 2B, days 2 and 4, p b 0.05 at both days) in FAST versus SLOW rats. FAST rats also displayed increased
37
water consumption over a three-day period indicating relative polydipsia (Fig. 2C, p b 0.001), a condition reported in patients with epilepsy (Okazaki et al., 2007) and associated neurodevelopmental disorders (Terai et al., 1999).
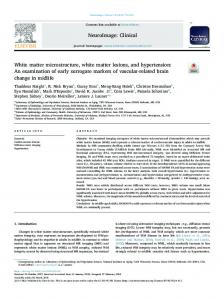
4.2. Altered white matter integrity in FAST versus SLOW rats 4.2.1. DTI scalar values Comparison of DTI scalar values found a significant decrease in FA in the corpus callosum (Fig. 3A & B; p b 0.01) of FAST compared to SLOW rats. There were also trends for increased RD in the corpus callosum (Fig. 3A & C; p = 0.09), increased MD (p = 0.1) and AD (p = 0.07) in the anterior commissure (Fig. 4J & L) of FAST compared to SLOW rats. No significant difference was observed between FA, MD, AD and RD (Figs. 3 & 4A–L) of any of the other ROIs analyzed.
Fig. 4. DTI scalar values comparative analysis of ROIs between the two strains. Manual tracings on study specific template and DTI scalar values, (A–C) optic tract (opt); (D–F) internal capsule (ic); (G–I) fimbria (fi); (J–L) anterior commissure (ac); fraction anisotropy (FA), mean diffusivity (MD), axial diffusivity (AD), radial diffusivity (RD), regions of interest (ROIs).
38
P. Sharma et al. / Neurobiology of Disease 104 (2017) 33–40
4.2.2. Relationship between behavioral measures with fractional anisotropy and strain Multiple regression analyses revealed that corpus callosum FA was negatively related to locomotor activity (total distance travelled) and exploratory behavior (number of rearings) indicating a lower FA value was related to higher locomotor activity and exploratory behavior. A significant effect and a trend to significant effect of the corpus callosum FA in the exploratory behavior on day one (R2 = 0.31, R2Adjusted = 0.23, F(2, 17) = 3.90, p = 0.04) and in the locomotor activity on day three (R2 = 0.56, R2Adjusted = 0.51, F(2, 17) = 11.01, p = 0.1) was found respectively. In addition, as expected from the analysis of behavioral measures, there was a significant effect of strain on the locomotor activity on day two (R2 = 0.45, R2Adjusted = 0.39, F(2, 17) = 6.96, p = 0.01), three (R2 = 0.56, R2Adjusted = 0.51, F(2, 17) = 11.01, p = 0.01) and four (R2 = 0.56, R2Adjusted = 0.51, F(2, 17) = 10.90, p = 0.001); in the exploratory behavior on day two (R2 = 0.36, R2Adjusted = 0.29, F(2, 17) = 4.84, p = 0.04) and four (R2 = 0.49, R2Adjusted = 0.43, F(2, 17) = 8.04, p = 0.02) and a trend to significance on day three (R2 = 0.34, R2Adjusted = 0.26, F(2, 17) = 4.40, p = 0.08); and in water consumption (R2 = 0.72, R2Adjusted = 0.69, F(2, 17) = 22.16, p b 0.001) was found. 4.3. Altered microstructure of corpus callosum of FAST versus SLOW rats Closer examination of the apparent white matter alterations indicated by FA and RD in the corpus callosum was done via histology using TEM. As reduced FA was observed in the corpus callosum of FAST rats, the midline body of the corpus callosum was selected to evaluate myelin quality and myelinated axons density using electron microscopy. No significant difference was observed in the number of myelinated (p b 0.05) and non-myelinated (p b 0.05) axons, indicating no difference in myelinated axon density in FAST versus SLOW rats (Fig. 5A). However, larger myelinated axons demonstrated by significant increased axon diameter (p b 0.001, Fig. 5B) were found in midline of corpus callosum of FAST rats. A significantly reduced g-ratio was also observed in FAST compared to SLOW rats, indicating an increased thickness of the myelin sheath (p b 0.001, Fig. 5C) in FAST rats. 5. Discussion This study was conducted to compare measures of white matter integrity between kindling-prone FAST and -resistant SLOW rat strains. Comparative analysis of DTI scalar metrics for specific white matter tracts demonstrated reduced FA in the corpus callosum, a borderline trend of increased RD in the corpus callosum and a borderline trend of increased MD and AD in the anterior commissure of the FAST rats. These findings suggest widespread differences in white matter microstructure in FAST relative to SLOW rats. The DTI measure FA reflects parallel organization of white matter fiber bundles where myelin integrity modulates the degree of
anisotropy. Reduced FA is known to be associated with lower integrity of intact myelin fibers indicating poor organization of white matter fiber bundles. In line with current observations, reduced FA in the corpus callosum has been documented in patients with epilepsy (Riley et al., 2010; Widjaja et al., 2013) and associated neurodevelopmental disorders (Dougherty et al., 2016; Dramsdahl et al., 2012; Vogan et al., 2016). Moreover, correlation of lower FA values in posterior corpus callosum to earlier age of seizure onset (Riley et al., 2010) suggests a role for the corpus callosum in the development of epilepsy. Surgical transection of corpus callosum (corpus callosotomy) is performed on some patients with intractable epilepsies to inhibit interhemispheric secondary generalization of epileptic seizures (Malmgren et al., 2015; Schaller and Cabrilo, 2016), which is modeled by the later stages of kindling in the rat. Given that corpus callosum is a major cerebral white matter tract involved in attention and motor control systems (Fabri et al., 2014), the fact that FA of the corpus callosum negatively related to the measures of the open field test (locomotor activity and number of rearings) indicate an association of decreased white matter integrity in the corpus callosum with hyperactivity in FAST versus SLOW rats. Indeed, a clinical study on children with developmental coordination disorder, ADHD, or combined developmental coordination disorder + ADHD, demonstrated an association of FA in the corpus callosum with motor and attention functioning (Langevin et al., 2014). Given that FA corresponds to changes in white matter, the microstructural architecture is further characterized by measures of diffusivity including parallel (AD) and perpendicular (RD) diffusivity. Thus, decreased FA might be the result of increased RD in the corpus callosum of FAST compared to SLOW rats suggesting alterations in myelin sheath organization in these rats. In fact, increased RD have been associated with dysmyelination (Song et al., 2002) and along with reduced FA, it have been observed in the corpus callosum of patients with absence epilepsy (Correa et al., 2017), autism (Assis et al., 2015) and ADHD (Wu et al., 2017). Given that FAST rats display the dual phenotype, compared to SLOW rats, of increased susceptibility to epileptogenesis and behavioral impairments; it is uncertain whether the structural differences in white matter observed in this study are related to one or the other of these phenotypes, or both. Given that the white matter structural differences observed in this study have been found both in patients with epilepsy and with associated neurodevelopmental disorders, a developmental genetic influence causing an underlying common pathophysiology for vulnerability to both phenotypes is possible. Indeed, our previous study demonstrated lower expression of the Apolipoprotein E and the sodium voltage-gated channel beta subunit 2 (SCN2B) genes in FAST rats during embryogenesis (Gilby et al., 2007a), which are known to be involved in myelination (Gu et al., 2013; O'Malley et al., 2009), seizures (Baum et al., 2014; Diaz-Arrastia et al., 2003) and behavioral impairments (Chang et al., 2016; Thalmeier et al., 2008). Moreover, similar to FAST rats, behavioral impairments have been observed before
Fig. 5. Increased axon diameter and myelin sheath thickness in FAST rats. Comparative analysis of myelinated axon density, axon diameter and myelin sheath thickness in corpus callosum between FAST and SLOW rats demonstrated (A) no difference in number of myelinated axon density between the two strains, (B) increased axon diameter and (C) reduced g-ratio of myelinated axons in FAST rats; ***p b 0.001, non parametric two-tailed Mann Whitney U test.
P. Sharma et al. / Neurobiology of Disease 104 (2017) 33–40
the onset of epilepsy in Synapsin I and II knockout mice (Greco et al., 2013). Interestingly, Synapsin SYN1 and SYN2 gene variations are known to contribute to epilepsy and ASD predisposition, supporting a common vulnerability to both phenotypes (Greco et al., 2013). The findings of altered white matter integrity and microstructure in FAST compared with SLOW rats in this study compliment those from another recently published study from our group which observed increased volume and longer midline of corpus callosum on structural MRI in FAST rats (Sharma et al., 2016). In this study, we demonstrate using electron microscopy no difference in the number of myelinated and non-myelinated axons between the two strains in the midline of the corpus callosum, suggesting that the reduced FA and increased RD seen on DTI in the FAST rats was not related to differences in axonal cell density. However, when axon diameter and g-ratio of myelinated axons were examined, a marked difference was observed with increased axon diameter and reduced g-ratio in FAST rats, indicating an increased myelin thickness. Given that cell membrane influences diffusion anisotropy in myelin fiber tracts (Takahashi et al., 2002), changes in axon diameter in FAST versus SLOW rats could influence DTI scalars including FA, MD and RD. Notably, an experimental study on different factors influencing integrity of myelin demonstrated that as axons become larger, the strength of cytoskeleton with respect to total myelin fiber strength decreases indicating that large axons contribute to increased vulnerability to myelin damage, effecting structural connectivity (Zhu et al., 2015). In addition to increased axonal size, the g-ratio corresponding to myelin sheath thickness has also been known to be associated with integrity of white matter fiber tracts. While an optimal g-ratio is estimated to be approximately ~ 0.72–0.81 for rat CNS (Chomiak and Hu, 2009), the g-ratio for SLOW and FAST rats was 0.69 ± 0.09 and 0.66 ± 0.10 respectively. The reason for a lower g-ratio than optimal value could be due to myelin tissue shrinkage during histological processes (Chomiak and Hu, 2009). Although, g-ratio in both strains was below the estimated optimal value, the relative reduced g-ratio of FAST compared to SLOW rats suggests increased myelin thickness in FAST rats could be associated with loosely packed myelin fibers, and therefore with reduced FA and increased RD on DWI. Notably, relative increase in myelin thickness (reduced g-ratio) is associated with increased strain on Ranvier nodes of myelinated axons (Zhu et al., 2015), suggesting that relative increased myelin thickness in FAST rats could affect the overall strength of myelinated axons predisposing it to increased susceptibility to diffusion axonal injury which could further contribute to acquired epilepsy. Alterations in axon diameter or myelin thickness indicate abnormalities during neurodevelopment. The underlying molecular mechanisms resulting in this are uncertain, but could involve those regulating cellular growth, proliferation, neuronal cytoarchitecture and myelination. For example, the tumor-suppressor phosphatase with tensin homology (PTEN) is the central negative regulator of the phosphatidylinositol 3kinase signaling pathway that modulates growth, proliferation and some aspects of the nervous system. Experimental studies have demonstrated that PTEN function in oligodendrocytes is involved in regulating myelin thickness and axon integrity (Fraser et al., 2008; Harrington et al., 2010). An experimental study observed PTEN-deficient neurons had increased size of nuclei and somata with enlarged caliber of neuronal projections and increased dendritic spine density, defects in myelination such as thickening and unraveling of the myelin sheath in the corpus callosum, similar to our current findings, enlarged abnormal synaptic structures in the cerebral cortex and cerebellum (Fraser et al., 2008). Interestingly, germline mutations in PTEN have been associated with ASD and epilepsy (Frazier et al., 2015; Marchese et al., 2014; Williams et al., 2015). Moreover, similar to our previous findings (Sharma et al., 2016), these patients had increased corpus callosum volume. There are limitations in this study that should be acknowledged. Given that ROI measurements were from same groups of rats for each test, correction for multiple t-tests for each ROI could not be performed
39
as corrections for multiple comparisons assume that each test is independent from the other. It should also be noted that this study investigated for relative differences between the FAST and SLOW rat strains that were selectively bred to display contrasting phenotypes for vulnerability towards kindling and behavioral features relevant to ASD/ADHD. Neither of these rat strains can be considered “normal” or “abnormal” per se, but rather represent contrasting ends of the spectrum of variability in these traits seen amongst individual rats and rat strains. So the relative differences cannot be necessarily regarded as pathological, but are potentially related to inherited differential seizure susceptibility and its associated behavioral phenotypes that these strains display. Given that large axons observed in FAST relative to SLOW rats could contribute to increased vulnerability to myelin damage, future work on analyzing structural connectivity and myelin damage following different epileptogenic brain insults, such as kindling or status epilepticus, in these rats would be of great interest. In conclusion, DWI analysis of specific white matter tracts and histology analysis demonstrated findings consistent with differences in white matter integrity in the corpus callosum of FAST relative to SLOW rats. From multiple regression analysis, a relationship was demonstrated between decreased FA in the corpus callosum and hyperactivity in FAST versus SLOW rats, which indicates that alterations in white matter could be causally related to the behavioral phenotype seen in these rats, which are reminiscent to those observed in neurodevelopmental disorders comorbid with epilepsy. Given that the FAST and SLOW rats exhibit genetic predisposition for differential vulnerability to kindling epileptogenesis, the white matter microstructural alterations present indicate that these alterations could contribute to risk versus resilience towards developing epilepsy and its associated behavioral comorbidities. Funding This work has been funded by an Early Career Research Grant from the University of Melbourne to Dr. Krista Gilby, and grants from the Royal Melbourne Hospital Neuroscience Foundation and the National Health and Medical Research Council (#1082215) to Professor Terence O′Brien. Conflict of interest None of the authors has any conflict of interest with respect to the research, authorship, finance and/or publication of this article. We confirm that we have read the Journal's position on issues involved in ethical publication and affirm that this report is consistent with those guidelines. Acknowledgements We thank Dr. Ben Emery and Dr. Holly K. Cate from the Florey Institute of Neuroscience and Mental Health, Melbourne, Australia for their guidance and suggestions to perform histology examination using electron microscopy. We thank Dr. Sarah Ellis, Dr. Chaitali Dekiwadia and Dr. Jill Danne at Peter MacCallum Cancer Centre, Melbourne, Australia for their contribution in postfixation steps of tissue preparation and preparation of ultra-thin sections during TEM. We acknowledge the facilities, and the scientific and technical assistance of the National Imaging Facility at the Florey Institute of Neuroscience and Mental Health, Parkville. References Alexander, A.L., et al., 2007. Diffusion tensor imaging of the brain. Neurotherapeutics 4, 316–329. Anisman, H., McIntyre, D.C., 2002. Conceptual, spatial, and cue learning in the Morris water maze in fast or slow kindling rats: attention deficit comorbidity. J. Neurosci. 22, 7809–7817.
40
P. Sharma et al. / Neurobiology of Disease 104 (2017) 33–40
Assaf, Y., Pasternak, O., 2008. Diffusion tensor imaging (DTI)-based white matter mapping in brain research: a review. J. Mol. Neurosci. 34, 51–61. Assis, Z.A., et al., 2015. Childhood autism in India: a case-control study using tract-based spatial statistics analysis. Indian J. Psychiatry 57, 272–277. Baum, L., et al., 2014. Case-control association study of polymorphisms in the voltagegated sodium channel genes SCN1A, SCN2A, SCN3A, SCN1B, and SCN2B and epilepsy. Hum. Genet. 133, 651–659. Chang, P., et al., 2016. The effects of an APOE promoter polymorphism on human white matter connectivity during non-demented aging. J. Alzheimers Dis. 55, 77–87. Chiang, S., et al., 2016. White matter structural connectivity changes correlate with epilepsy duration in temporal lobe epilepsy. Epilepsy Res. 120, 37–46. Chomiak, T., Hu, B., 2009. What is the optimal value of the g-ratio for myelinated fibers in the rat CNS? A theoretical approach. PLoS One 4, e7754. Chou, I.C., et al., 2013. Correlation between epilepsy and attention deficit hyperactivity disorder: a population-based cohort study. PLoS One 8, e57926. Concha, L., et al., 2010. In vivo diffusion tensor imaging and histopathology of the fimbriafornix in temporal lobe epilepsy. J. Neurosci. 30, 996–1002. Correa, D.G., et al., 2017. Evaluation of deep gray matter volume, cortical thickness and white matter integrity in patients with typical absence epilepsy: a study using voxelwise-based techniques. Neuroradiology 59, 237–245. Dedeurwaerdere, S., et al., 2014. Workshop on neurobiology of epilepsy appraisal: new systemic imaging technologies to study the brain in experimental models of epilepsy. Epilepsia 55, 819–828. Diaz-Arrastia, R., et al., 2003. Increased risk of late posttraumatic seizures associated with inheritance of APOE epsilon4 allele. Arch. Neurol. 60, 818–822. Dougherty, C.C., et al., 2016. A comparison of structural brain imaging findings in autism Spectrum disorder and attention-deficit hyperactivity disorder. Neuropsychol. Rev. 26, 25–43. Dramsdahl, M., et al., 2012. Adults with attention-deficit/hyperactivity disorder - a diffusion-tensor imaging study of the corpus callosum. Psychiatry Res. 201, 168–173. Eijsden, P.V., et al., 2011. In vivo diffusion tensor imaging and ex vivo histologic characterization of white matter pathology in a post-status epilepticus model of temporal lobe epilepsy. Epilepsia 52, 841–845. Fabri, M., et al., 2014. Functional topography of the corpus callosum investigated by DTI and fMRI. World J Radiol. 6, 895–906. Fraser, M.M., et al., 2008. Phosphatase and tensin homolog, deleted on chromosome 10 deficiency in brain causes defects in synaptic structure, transmission and plasticity, and myelination abnormalities. Neuroscience 151, 476–488. Frazier, T.W., et al., 2015. Molecular and phenotypic abnormalities in individuals with germline heterozygous PTEN mutations and autism. Mol. Psychiatry 20, 1132–1138. Gilby, K.L., O'Brien, T.J., 2013. Epilepsy, autism, and neurodevelopment: kindling a shared vulnerability? Epilepsy Behav. 26, 370–374. Gilby, K.L., et al., 2007a. Neurodevelopment in seizure-prone and seizure-resistant rat strains: recognizing conflicts in management. Epilepsia 48 (Suppl. 5), 114–118. Gilby, K.L., et al., 2007b. Ruling out postnatal origins to attention-deficit/hyperactivity disorder (ADHD)-like behaviors in a seizure-prone rat strain. Behav. Neurosci. 121, 370–379. Glenn, G.R., et al., 2016. Epilepsy-related cytoarchitectonic abnormalities along white matter pathways. J. Neurol. Neurosurg. Psychiatry 87, 930–936. Greco, B., et al., 2013. Autism-related behavioral abnormalities in synapsin knockout mice. Behav. Brain Res. 251, 65–74. Gu, Z., et al., 2013. Apolipoprotein E mimetic promotes functional and histological recovery in lysolecithin-induced spinal cord demyelination in mice. J Neurol Neurophysiol. 2014, 10. Harrington, E.P., et al., 2010. Oligodendrocyte PTEN is required for myelin and axonal integrity, not remyelination. Ann. Neurol. 68, 703–716. Johnstone, V.P., et al., 2015. Experimental traumatic brain injury results in long-term recovery of functional responsiveness in sensory cortex but persisting structural changes and sensorimotor, cognitive, and emotional deficits. J. Neurotrauma 32, 1333–1346. Jones, N.C., et al., 2008. Experimental traumatic brain injury induces a pervasive hyperanxious phenotype in rats. J. Neurotrauma 25, 1367–1374. Langevin, L.M., et al., 2014. Common white matter microstructure alterations in pediatric motor and attention disorders. J. Pediatr. 164 (1157–1164), e1. Malmgren, K., et al., 2015. Reappraisal of corpus callosotomy. Curr. Opin. Neurol. 28, 175–181. Marchese, M., et al., 2014. Autism-epilepsy phenotype with macrocephaly suggests PTEN, but not GLIALCAM, genetic screening. BMC Med. Genet. 15, 26.
Mukherjee, P., et al., 2008. Diffusion tensor MR imaging and fiber tractography: theoretic underpinnings. AJNR Am. J. Neuroradiol. 29, 632–641. Okazaki, M., et al., 2007. Effects of polydipsia-hyponatremia on seizures in patients with epilepsy. Psychiatry Clin. Neurosci. 61, 330–332. O'Malley, H.A., et al., 2009. Loss of Na+ channel beta2 subunits is neuroprotective in a mouse model of multiple sclerosis. Mol. Cell. Neurosci. 40, 143–155. Pannek, K., et al., 2014. Assessment of the structural brain network reveals altered connectivity in children with unilateral cerebral palsy due to periventricular white matter lesions. Neuroimage Clin. 5, 84–92. Parekh, M.B., et al., 2010. Early MR diffusion and relaxation changes in the parahippocampal gyrus precede the onset of spontaneous seizures in an animal model of chronic limbic epilepsy. Exp. Neurol. 224, 258–270. Park, S., et al., 2016. Increased white matter connectivity in traumatized children with attention deficit hyperactivity disorder. Psychiatry Res. 247, 57–63. Paxinos, G., Watson, C., 2005. The Rat Brain in Stereotaxic Coordinates the Rat Brain in Stereotaxic Coordinates - The New Coronal Set. Fifth Edition. Elsevier, Academic Press, San Diego, California. Racine, R.J., 1972. Modification of seizure activity by electrical stimulation. II. Motor seizure. Electroencephalogr. Clin. Neurophysiol. 32, 281–294. Racine, R.J., et al., 1999. Development of kindling-prone and kindling-resistant rats: selective breeding and electrophysiological studies. Epilepsy Res. 35, 183–195. Reinhart, C.J., et al., 2004. Development of play fighting in kindling-prone (FAST) and kindling-resistant (SLOW) rats: how does the retention of phenotypic juvenility affect the complexity of play? Dev. Psychobiol. 45, 83–92. Riley, J.D., et al., 2010. Altered white matter integrity in temporal lobe epilepsy: association with cognitive and clinical profiles. Epilepsia 51, 536–545. Schaller, K., Cabrilo, I., 2016. Corpus callosotomy. Acta Neurochir. 158, 155–160. Sharma, P., et al., 2016. Neuroanatomical differences in FAST and SLOW rat strains with differential vulnerability to kindling and behavioral comorbidities. Epilepsy Behav. 65, 42–48. Shultz, S.R., et al., 2015a. Intracerebroventricular injection of propionic acid, an enteric metabolite implicated in autism, induces social abnormalities that do not differ between seizure-prone (FAST) and seizure-resistant (SLOW) rats. Behav. Brain Res. 278, 542–548. Shultz, S.R., et al., 2015b. Sodium selenate reduces hyperphosphorylated tau and improves outcomes after traumatic brain injury. Brain 138, 1297–1313. Song, S.K., et al., 2002. Dysmyelination revealed through MRI as increased radial (but unchanged axial) diffusion of water. NeuroImage 17, 1429–1436. Takahashi, M., et al., 2002. Magnetic resonance microimaging of intraaxonal water diffusion in live excised lamprey spinal cord. Proc. Natl. Acad. Sci. U. S. A. 99, 16192–16196. Tan, X.L., et al., 2016. Sodium selenate, a protein phosphatase 2A activator, mitigates hyperphosphorylated tau and improves repeated mild traumatic brain injury outcomes. Neuropharmacology 108, 382–393. Terai, K., et al., 1999. Excessive water drinking behavior in autism. Brain Dev. 21, 103–106. Thalmeier, A., et al., 2008. Gene expression profiling of post-mortem orbitofrontal cortex in violent suicide victims. Int. J. Neuropsychopharmacol. 11, 217–228. Vogan, V.M., et al., 2016. Widespread white matter differences in children and adolescents with autism spectrum disorder. J. Autism Dev. Disord. 46, 2138–2147. Webster, K.M., et al., 2015. Progesterone treatment reduces neuroinflammation, oxidative stress and brain damage and improves long-term outcomes in a rat model of repeated mild traumatic brain injury. J. Neuroinflammation 12, 238. Widjaja, E., et al., 2013. Abnormal white matter on diffusion tensor imaging in children with new-onset seizures. Epilepsy Res. 104, 105–111. Williams, M.R., et al., 2015. Hyperactivity of newborn Pten knock-out neurons results from increased excitatory synaptic drive. J. Neurosci. 35, 943–959. Woolfenden, S., et al., 2012. A systematic review of two outcomes in autism spectrum disorder - epilepsy and mortality. Dev. Med. Child Neurol. 54, 306–312. Wright, D.K., et al., 2016. Behavioral, blood, and magnetic resonance imaging biomarkers of experimental mild traumatic brain injury. Sci. Rep. 6, 28713. Wu, Z.M., et al., 2017. White matter microstructural alterations in children with ADHD: categorical and dimensional perspectives. Neuropsychopharmacology 42, 572–580. Zhu, F., et al., 2015. Nodal versus total axonal strain and the role of cholesterol in traumatic brain injury. J. Neurotrauma 33, 859–870.