PHYSICAL REVIEW B 81, 115135 共2010兲
Differential convergent beam electron diffraction: Experiment and theory Philip N. H. Nakashima* and Barrington C. Muddle ARC Centre of Excellence for Design in Light Metals and Department of Materials Engineering, Monash University, Victoria 3800, Australia 共Received 26 September 2009; revised manuscript received 31 December 2009; published 26 March 2010兲 The derivative of intensity with respect to scattering angle in an electron diffraction pattern is shown to be almost completely independent of whether the pattern has been energy filtered or not. This is attributed to the diffuse nature of inelastic scattering. A simple approach to quantitative convergent beam electron diffraction 共QCBED兲, developed on this basis and tested on a corresponding pair of energy-filtered and unfiltered diffraction patterns from ␣-Al2O3, produces a fit between experimental and theoretical differential CBED patterns that is well within experimental uncertainty. Structure factors measured from the unfiltered data are indistinguishable from those from the filtered data. Furthermore, those measurements made by angular-difference QCBED appear to be less influenced by parameter correlation and the inelastic components of CBED patterns than those made by conventional QCBED. The outcome is a new avenue for accurate charge density studies that does not depend on energy-filtering optics or acquisition of multiple patterns requiring translation of the specimen. DOI: 10.1103/PhysRevB.81.115135
PACS number共s兲: 61.05.jm, 61.05.jd
I. INTRODUCTION
Over the last two decades, quantitative convergent beam electron diffraction 共QCBED兲 has proven to be a very precise and accurate tool for measuring charge density in highly perfect inorganic crystals with small unit cells.1–26 However, the method has conventionally been restricted to the minority of transmission electron microscopes 共TEMs兲 with energyfiltering optics. This arose from the prohibitive complexity of the inelastic scattering calculations required to match unfiltered experimental CBED patterns with calculated ones in order to measure Fourier coefficients of crystal potential 共structure factors, which are directly related to charge density via the Mott Formula27兲. The comparison of accurate experimental charge density measurements with different predictive solid state models which derive from ab initio ground state charge density calculations, such as those based on density functional theory, or the linear combination of atomic orbitals and self-consistent field approaches, provides a way of testing solid state theory at its basis. This will thereby improve our understanding of the electronic structure and energetics of materials. More accurate and precise experimental techniques are required to realize these aspirations. A limitation to realizing the full potential of QCBED is the inability of even the most sophisticated TEMs with monochromators and the most advanced energy-filtering optics to remove the inelastic signal caused by thermal diffuse scattering 共TDS兲, with energy losses less than 0.1 eV. As a consequence, even in the most finely-tuned QCBED experiments, the TDS background is an ever-present component of the mismatch between experimental energy-filtered CBED patterns and their theoretical counterparts. In addition to TDS, surface imperfections of the specimen 共contamination, amorphous surface layers, oxides, etc., depending on the nature of the specimen兲, can result in added components to the signal in a CBED pattern that energy filters cannot remove. The background that remains after energy filtering must 1098-0121/2010/81共11兲/115135共10兲
therefore be considered as a combination of TDS and other components that originate from scattering at a surface that is incoherent with the periodicity of the crystalline bulk of the specimen. It has recently been shown that the total background intensity remaining in energy-filtered CBED patterns consists of a slowly varying diffuse component and a high angularfrequency component that mimics the elastic intensity distribution in the CBED pattern.28 That work28 lays the foundation for an approach to QCBED that allows an unprecedented level of matching between experimental and theoretical CBED patterns, without recourse to complex calculations of the TDS background. TDS calculations will be required in future to verify the nature of the contribution made by TDS to the total background intensity; however, at present, this is beyond the scope of this work. Recent work26 showed that energy-filtering electron optics are not essential to QCBED, and that the remarkable differences in sensitivity to specimen thickness exhibited by the elastic and the inelastic components of the signal in an electron diffraction pattern can be exploited to almost completely eliminate the effects of both TDS and higher energy losses on QCBED pattern matching via a thickness-difference approach. Most recently, the potential for developing an angular-difference approach to QCBED was revealed,28 based on the large difference in sensitivity to scattering angle exhibited by the elastic and the inelastic components of energy-filtered CBED patterns. Considering all experimentally practicable derivatives that could be used to discriminate between the elastic and the inelastic signals in a CBED pattern, it is concluded that the derivative with respect to scattering angle is the most practical. This approach is subsequently developed into a differential QCBED technique, which is tested against established methods with energyfiltered and unfiltered CBED patterns from ␣-Al2O3, a material for which structure factors have already been accurately measured.14,16,18,25,26
115135-1
©2010 The American Physical Society
PHYSICAL REVIEW B 81, 115135 共2010兲
PHILIP N. H. NAKASHIMA AND BARRINGTON C. MUDDLE II. THEORY
The signal in a CBED pattern can be partitioned into two distinct components that differ greatly in their sensitivity to scattering angle. The sensitive component, I共Ug , H , 兲, depends strongly on the relevant structure factors, Ug, the crystal thickness, H, and the scattering angle, , and in the regime of QCBED, oscillates with high angular frequency. This shall be referred to as the high-frequency component of the total signal in a CBED pattern. The second component is a diffuse background composed entirely of inelastically scattered electrons that is relatively insensitive to the parameters Ug, H, and and will be referred to as the low-frequency component, Iinel共兲. A recent study28 has shown that this lowfrequency component in energy-filtered CBED patterns can be considered locally linear/planar in terms of . Previous work without energy filters29 suggests that the same is true for unfiltered CBED patterns. It is therefore possible to give an expression for the total signal, I, that applies generally to all experimental CBED patterns, I = I共Ug,H, 兲 + Iinel共兲,
共1兲
where Iinel共兲 =  . + ␥. This expression is equivalent to the model for the total intensity given in a related paper,28 where  is the local gradient of the low-frequency component of the background and ␥ the offset. The high-frequency term, I共Ug , H , 兲, is dominantly composed of the elastically scattered electrons, Iel共Ug , H , 兲, and a much smaller inelastic component, Iinel共Ug , H , 兲. The former includes not only the elastic CBED pattern but also the elastic scattering of electrons within the crystal that have been initially scattered elastically from surface layers that differ from the bulk structure. The latter comprises the plasmon signal, as well as some TDS electrons and those electrons scattered inelastically by surface layers incommensurate with the bulk that undergo both elastic and inelastic scattering in subsequent diffraction within the bulk crystal. The intensity distribution from plasmon scattering is known to mimic the elastic distribution, albeit in a slightly more diffuse manner26,29,30 and an example was recently given showing that the high-frequency component of the background remaining in energy-filtered CBED patterns 共in the absence of the plasmon signal but including TDS and scattering from surface defect layers兲 also mimics the elastic signal from the crystal.28 Based on this recent work and the intensity model that it verified, an expression for the total intensity distribution in an unfiltered CBED pattern can be obtained as follows: I = Iel共Ug,H, 兲 + Iinel共Ug,H, 兲 + Iinel共兲 ⬇ . Iel共Ug,H, 兲 +  . + ␥
共 ⬎ 1兲.
共2兲
In this expression, is significantly greater than 1 and Iinel共兲 can amount to several 10 s of percent of the total signal in an unfiltered CBED pattern while is close to 1 and Iinel共兲 constitutes only a few percent of the total signal in an energy-filtered pattern. The validity of this approximation is in fact what permitted the earliest work in QCBED, prior to the advent of energy-filtering electron optics.29,31,32 In some cases, the backgrounds to disks in CBED patterns
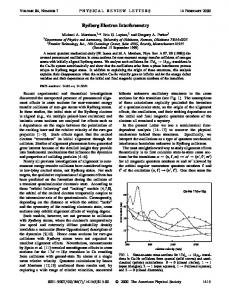
FIG. 1. 共Color online兲 A comparison between 共a兲 an unfiltered CBED pattern and 共b兲 the angular-difference pattern, obtained from the centrosymmetrically averaged derivative with respect to scatterdI ing angle, 具 d 典c 关see Eq. 共4兲兴, of the unfiltered pattern. Corresponding intensity profiles 共c兲 and 共d兲, respectively, measured along identical loci 共black lines兲 show the almost complete removal of the low-frequency diffuse background present in the unfiltered pattern when the angular-difference pattern is computed. There are a number of contributions to the total signal in the as-captured pattern and these are illustrated schematically in different color codings within the intensity distributions. Yellow 共off white in grayscale兲 indicates the elastic signal and red 共gray兲, the high-frequency inelastic contribution 共plasmons and some TDS兲 while blue 共dark gray兲 shows the low-frequency inelastic component 共inner-shell excitation, ionization, and most of the TDS兲. Only the high-frequency components 共yellow and red兲 contribute to the angular-difference pattern. This example involves an incident-beam orientation of 1 0 4 relative to the 关−4 4 1兴 zone, with electrons having a nominal energy of 200 keV.
were estimated from densitometry measurements immediately adjacent to the disks, that were extrapolated into the disks to facilitate a quantitative subtraction of the structured background.29,32 Figures 1共a兲 and 1共c兲 illustrate schematically the relationship of Iel共Ug , H , 兲, Iinel共Ug , H , 兲, and Iinel共兲 for an unfiltered CBED pattern. It follows from the approximation of Eq. 共2兲 that there are three possibilities for removing almost all inelastic scattering information from an unfiltered electron diffraction pattern, i.e., via derivatives with respect to each of the sensitive experimental variables. In doing this, the relatively insensitive low-frequency inelastic component of the signal, Iinel共兲, is eliminated, leaving the derivative of the high-frequency signal, which is very well approximated by
115135-2
dIel共Ug,H, 兲 dI ⬇ , dUg dUg
PHYSICAL REVIEW B 81, 115135 共2010兲
DIFFERENTIAL CONVERGENT BEAM ELECTRON…
dIel共Ug,H, 兲 dI , ⬇ dH dH or dIel共Ug,H, 兲 dI ⬇ + , d d
共3兲
depending on the derivative applied. Thus, each of the derivatives of an unfiltered CBED pattern are approximately equivalent to the respective derivatives of the purely elastic signal, scaled to accommodate the added high-frequency inelastic component. In the third case, the constant  remains but is very small compared to the first term due to the slowly varying nature of Iinel共兲 compared to Iel共Ug , H , 兲. The merits and limitations of applying each of the possible derivatives expressed in Eqs. 共3兲 and 共4兲 are summarized as follows. A.
dI dI dUg ( d ):
Differentiation with respect to electron wavelength
The expression, Ug, for structure factors combines the experimentally independent form of the structure factors, Vg, with the electron wavelength—a variable in the experiment. As a consequence, evaluating this derivative requires an incremental change in the electron wavelength between the recording of two otherwise identical diffraction patterns. This would involve a change in the accelerating voltage and this in itself makes this derivative difficult to apply. While it is simple enough to change the voltage by a few percent, this change would have to be accompanied by a realignment of the post-gun optics. The procedure is only advantageous if the electron probe remains in the same volume of specimen before and after the change in electron wavelength. This is very difficult to ensure in practice and any movement of the probe on the specimen may introduce small changes in thickness and orientation that are difficult to quantify in the face of the change in wavelength. More than one diffraction pattern is required for this method of differential electron diffraction. B.
dI dH :
background magnitudes in the multiple patterns needed for the thickness-difference approach.26 Because a unique volume of specimen is probed in the present approach, unlike the other derivatives, it is applicable to the same range of specimens accessible by conventional QCBED. The technique involves averaging over a series of centrosymmetric image shifts and subtracting the unshifted CBED pattern to produce the angular-difference pattern. A centrosymmetrically averaged differential is free from the constant  in Eq. 共3兲 which originates from the approximation that the low-frequency component of the background, Iinel共兲, can be considered locally linear in one dimension or planar in two dimensions 关see Eqs. 共1兲 and 共2兲兴. Previous work with both energy-filtered and unfiltered CBED patterns28,29 suggests that this is valid beyond the range of the image shifts that are typically required to obtain angulardifference CBED patterns. Figure 2 examines a small area of Iinel共兲 that can be considered planar. A derivative taken in one direction in reciprocal space returns the value of the local gradient,  in that direction, however, considering a centrosymmetrically related set of directions 关see Fig. 2共b兲兴 shows that the averaged value of  is zero. Therefore, it is more useful to consider the centrosymmetrically averaged derivative with respect to scattering angle which is expressed as
冓冔 冓 dI d
Differentiation with respect to specimen thickness
This approach has already been developed into an accurate and precise QCBED technique.26 That work also suggested that much of the signal due to TDS could be removed via this derivative. This approach works well given a specimen that is not severely distorted and is well ordered, single phase, and homogeneous over a range of translations and specimen thicknesses. It is essential that the specimen is stepped or slightly wedged as small changes in thickness 共⬇5%兲 are required from pattern to pattern. This method is not easily applied to fine-grained, multiphase materials. More than one diffraction pattern is required. C.
FIG. 2. 共Color online兲 Iinel共兲, shaded in blue 共dark gray兲 in Fig. 1, is considered schematically in 共a兲. Part 共b兲 shows a small region cut out of the surface of Iinel共兲 in 共a兲. Red 共gray兲 arrows show positive  and blue 共dark gray兲 negative. The lengths of the arrows show the relative magnitudes of the gradients in each direction.
dI d :
Differentiation with respect to scattering angle
This approach is distinguishable from preceding techniques in that it only requires a single diffraction pattern. It is easy to apply and requiring just one pattern means that there are no discrepancies arising from the slight differences in the
⬇
c
dIel共Ug,H, 兲 d
冔
.
共4兲
c
An example of 具 ddI 典c, averaged over the eight centrosymmetrically related directions shown in Fig. 2, is presented in Figs. 1共b兲 and 1共d兲. The present work applies the angular-difference approach to two CBED patterns from ␣-Al2O3, which are identical in all respects other than that one has been zero-loss energy filtered and the other is unfiltered. This work makes an initial comparison of the actual gradients recovered from both patterns using the new technique, to see if they can be considered equivalent. Following this, QCBED pattern matching of the angular-difference CBED patterns as well as matching of their precursor patterns via conventional QCBED is performed for a complete comparison of the new method to established knowledge and techniques. From this point onward, thickness-difference 共Q兲CBED, angular-difference 共Q兲CBED, and conventional 共Q兲CBED
115135-3
PHYSICAL REVIEW B 81, 115135 共2010兲
PHILIP N. H. NAKASHIMA AND BARRINGTON C. MUDDLE
will be referred to as TD共Q兲CBED, AD共Q兲CBED, and 共Q兲CBED, respectively, for brevity. III. METHOD
Figure 3 is a schematic flow chart illustrating the simplicity of generating ADCBED data for pattern matching, I, and the associated uncertainties, . The method is executed after the uncertainty, 0, of the raw CBED intensities, I0, has been determined.33 This is required for the determination of the uncertainty associated with the ADCBED pattern so that accurate pattern matching can be executed. The angulardifference data are generated as follows: 共1兲 The input CBED pattern is shifted centrosymmetrically by N pixels in the directions 共x , 0兲, 共−x , 0兲, 共0 , y兲, 共0 , −y兲, 共x , y兲, 共−x , y兲, 共x , −y兲, and 共−x , −y兲. Shifting is restricted to these principal directions, with N an integer, to avoid interpolation of intensities in the event of shifting pixels to noninteger coordinates. N is equal to the binning factor used to generate the patternmatching input. 共2兲 The shifted images, Is, are summed and divided by 8 in order to normalize the sum with respect to the input CBED pattern, I0. 共3兲 The input pattern, I0, is subtracted from the normalized sum of shifts produced in the last step to return the ADCBED pattern, I. The corresponding map of uncertainty associated with each pixel in the ADCBED pattern is computed in a very similar manner, using the variance, 20, determined from the input uncertainty image, 0. The difference in the expression used to compute the final uncertainty at the bottom of Fig. 3 is based on the requirement that addition and subtraction operations must be executed on the variance while normalization belongs in the domain of uncertainty. In addition, noise is cumulative, irrespective of addition or subtraction processes carried out on the associated intensities. The magnitude of the shifts, N, corresponds to the factor of binning to which the data will be subjected prior to pattern matching. This simplifies the calculation of theoretical gradients with respect to scattering angle as only single pixel shifts are then required. Any program used for pattern-matching refinement of CBED data in the conventional way only requires a very small modification to match angular-difference patterns. All that is necessary is the addition of a subroutine that performs all of the shifting, summing, averaging, and subtraction operations described for the preparation of the experimental ADCBED data above, on the theoretically calculated intensities for each reflection subimage. However, instead of applying shifts by N pixels, all shifts are 1 pixel in magnitude as the experimental data have already been binned by N. Errors incurred at the boundaries of reflection subimages due to the lack of calculated intensities beyond the boundary, have no effect on the pattern matching as all pixels adjacent to boundaries are weighted zero within conventional pattern matching anyway. Theoretical intensities calculated during pattern-matching range from 0 to 1 and, as a consequence, so do the calculated gradients. The output must therefore be normalized to the experimental data and in doing so, the proportionality constant, , encountered in Eqs. 共2兲–共4兲, is absorbed in the
FIG. 3. 共Color online兲 Angular-difference CBED patterns are obtained after summing centrosymmetric shifts of the input pattern, I0, by N pixels in the eight principal directions shown. This returns 兺Is which must be normalized with respect to I0 before subtracting I0 to give the angular-difference intensities, I. N is equal to the binning of the experimental data prior to pattern matching. The associated uncertainty is calculated similarly using the uncertainty corresponding to the original CBED data 共Ref. 33兲 as input, 0. The only difference in the calculation of the uncertainty, , is that the addition and subtraction operations must be carried out on the variance, s2 while normalization can only be applied to the cumulative uncertainty, 冑兺s2. Disk subimages are extracted to form the input arrays required for pattern matching. The unfiltered CBED data of Fig. 1 have been used again here.
pattern-matching process. The notion of a scale factor is irrelevant in all forms of QCBED because only the distribution of intensities or gradients is important and not the absolute magnitudes as required in other diffraction techniques aimed
115135-4
PHYSICAL REVIEW B 81, 115135 共2010兲
DIFFERENTIAL CONVERGENT BEAM ELECTRON…
at measuring atomic structure and charge density that involve a kinematic approximation to interpret diffracted intensities. In the present work, the REFINECB program of Zuo,3 previously modified to suit two-dimensional CBED pattern matching and accept anisotropic displacement parameters as input,16 has simply had an extra subroutine added that provides the option of performing the angular-difference calculations on the theoretical intensities. IV. EXPERIMENTS
The pair of CBED patterns 共filtered and unfiltered兲 examined in the present work were collected from a piece of ⬎99.998% purity ␣-Al2O3 crushed and dispersed onto a continuous carbon-coated 200-mesh copper specimen grid. The contribution of the amorphous layer of carbon to a CBED pattern depends on the orientation of the specimen in the TEM. If the specimen is supported by the film, then the diffuse scattering from the amorphous carbon serves simply to slightly blur the intensity distribution exiting the crystal. However, if the specimen is inserted up-side down, the passage of the electron beam through the layer of amorphous carbon prior to entering the crystal, imparts a background to the resulting CBED pattern that mimics the diffracted intensities from the crystal.28 Either way, these effects do not add additional structure to the intensity distribution within the CBED disks resulting from the crystal alone and thus, simply change the scale of the angular-difference pattern 关 in Eq. 共4兲兴 but not its form. Corundum has become established as a benchmark material for accurate experimental and theoretical charge-density studies14,16,18,25,26,34–41 and has been examined frequently by conventional14,16,18,25 and TDQCBED.26 Its high Debye temperature of 1045 K 共Ref. 42兲 ensures that TDS will be the smallest component of the total inelastic signal in the unfiltered CBED data. This maximizes the difference between energy-filtered and unfiltered patterns and provides a stronger test of the validity of ADQCBED in its application to unfiltered CBED patterns. The CBED data were collected using a JEOL 2010 TEM with GIF2000™ energy filter, run at a nominal accelerating voltage of 200 kV. A pair of CBED patterns was collected near 关−4 4 1兴 with an incident-beam direction of 共1 0 4兲 in reciprocal space coordinates. The first pattern in the pair was collected with the energy selecting slit set at a width of 6 eV, centered on the zero-loss peak in the electron energy-loss spectrum. The unfiltered counterpart of this pattern was collected immediately afterward simply by removing the energy-selecting slit. Of immediate interest is whether ADCBED data ready for pattern matching, from filtered and unfiltered patterns, can be considered equivalent within the noise associated with the experiment. To test this, angular difference and uncertainty images were obtained, as per Fig. 3, for the pair of filtered and unfiltered CBED patterns examined throughout the present work. The two respective angular-difference patterns can then be compared in the context of the cumulative experimental uncertainty associated with both of them. In Figs. 4共a兲 and 4共b兲, the unfiltered and the filtered CBED patterns, respectively, are presented as captured. To
FIG. 4. 共Color online兲 A comparison of 共a兲 unfiltered and 共b兲 energy-filtered CBED data in the as-collected state, and the respective angular-difference images 共c兲 and 共d兲. The difference maps for the unprocessed, unfiltered, and filtered patterns 共a-b兲 and the respective angular-difference patterns 共c-d兲 are shown in terms of the experimental uncertainty associated with each pixel, after deconvolution of the instrumental point spread function 共PSF兲 共Ref. 43兲, correction of relative geometric distortions and binning by 8 to make the data ready for pattern matching. In addition, individual constant backgrounds to each of the disks in patterns 共a兲 and 共b兲 were subtracted prior to computing 共a-b兲.
generate the corresponding difference map, Fig. 4 共a-b兲, the instrumental point spread function 共PSF兲 共Ref. 43兲 was deconvoluted from 共a兲 and 共b兲 and subimages of each reflection from 共a兲 and 共b兲 were corrected for relative geometric distortions.25 Each of the subimages was then binned eight times—the same level of binning used for pattern matching 共shown in Fig. 5兲. Constant backgrounds measured from the average intensity immediately adjacent to each reflection were subtracted from each reflection subimage and finally, the filtered data were normalized with respect to the unfiltered data. The difference map has the same format as those produced during pattern matching 共see Fig. 5兲, involving a consecution of the reflection subimages as per Fig. 3. This follows from the comparison between the unfiltered and the filtered patterns, 共a兲 and 共b兲, being consistent with the pattern-matching procedures used to refine structure factors. Figures 4共c兲 and 4共d兲 deal with the angular-difference patterns corresponding to the unfiltered and the filtered CBED
115135-5
PHYSICAL REVIEW B 81, 115135 共2010兲
PHILIP N. H. NAKASHIMA AND BARRINGTON C. MUDDLE
FIG. 5. 共Color online兲 Conventional 关共a兲 and 共b兲兴 and angulardifference pattern matching 关共c兲 and 共d兲兴 have been applied to unfiltered 关共a兲 and 共c兲兴 and energy-filtered 关共b兲 and 共d兲兴 CBED data obtained from the same volume of ␣-Al2O3, near 关−4 4 1兴 with electrons having a nominal energy of 200 keV. The experimental input 共i兲 and theoretical output 共ii兲 are compared via error maps expressed in units of standard uncertainty 共iii兲. The low levels of error in the fits for both sets of angular-difference data to the theoretical angular-difference patterns represent a quality of fit surpassing previous two-dimensional QCBED studies of ␣-Al2O3 共Refs. 14, 16, 18, 25, and 26兲. The refined parameters are summarized together with the quality of fit, 2, in Table I.
patterns, respectively, shown in Figs. 4共a兲 and 4共b兲. The angular-difference patterns were generated according to the flow chart of Fig. 3, where the magnitude of the shifts is N = 8 pixels. This is commensurate with the binning by 8 used in the preparation of the pattern-matching input 共see Fig. 5兲. The only difference in the preparation of the angulardifference error map 关Fig. 4 共c-d兲兴 from the error map of the as-captured data 关Fig. 4 共a-b兲兴 is the absence of background subtraction because the centrosymmetrically averaged differential eliminates this component of the signal. Both difference maps, Figs. 4 共a-b兲 and 4 共c-d兲, are expressed in terms of the number of standard uncertainties in the PSF-corrected experimental data. From this comparison, it becomes clear that taking the derivative of intensity with respect to angle in a CBED pattern returns almost the same results irrespective of whether the pattern has been energy filtered or not. The differences between the two angular-difference patterns fall well within ⫾2, in fact 97.8% of all data points are within ⫾. In contrast, the range of error between the filtered and the unfiltered CBED patterns is about four times greater. This level of disagreement would be much greater if the step of background subtraction were omitted from the comparison of the as-captured data, in the same manner as the comparison of the angular-difference patterns. The near experimental equivalence observed in the angular-difference data from the elastically filtered and unfiltered CBED patterns leads to the expectation that pattern matching of both sets of data in angular-difference mode will yield almost identical structure factor measurements. This assertion has been tested as per Fig. 5 and Table I. The figure shows 12 rows of data in four sets as follows: 共a兲 QCBED applied to the unfiltered CBED data, 共b兲 QCBED applied to the energy-filtered CBED data, 共c兲 ADQCBED applied to the unfiltered CBED data, and 共d兲 ADQCBED applied to the energy-filtered CBED data. Within each of these sets, the experimental data 共i兲 are presented first, followed by the pattern-matched theoretical output 共ii兲, and their difference 共iii兲 expressed in terms of the uncertainty associated with the experimental data. The results in Fig. 5 and Table I were obtained after applying several cycles of separated diffraction parameter refinement/geometric distortion correction25 until no further improvement in fit between the theoretically calculated patterns and experimental data could be obtained. The estimates of uncertainty associated with individual parameter determinations were made by repeating each refinement 20 times with randomized weights applied to all data points for each refinement. This perturbs the shape of the quality of fit 共2兲 共Refs. 3 and 7兲 surface which allows the uncertainty in the position of the global minimum to be estimated reliably. In the conventional QCBED pattern-matching refinements of the unfiltered and the filtered patterns, constant backgrounds obtained from the average intensities measured immediately adjacent to each disk were subtracted from each reflection subimage in the input data prior to refinement. The structure factors, specimen thickness, and electron energy measured from the four refinements represented in Fig. 5 are summarized in Table I together with their respective 2 values. Comparisons are made with previous measurements of the same structure factors by the TDQCBED technique,26 con-
115135-6
PHYSICAL REVIEW B 81, 115135 共2010兲
DIFFERENTIAL CONVERGENT BEAM ELECTRON…
TABLE I. Comparison of structure factors determined from the four pattern-matching refinements shown in Fig. 5 along with previous measurements using TDQCBED 共Ref. 26兲 and conventional energy-filtered QCBED 共Refs. 14, 16, 18, and 25兲 共EFQCBED兲. Uncertainties in individual measurements 关in parentheses and applicable to the last significant figure共s兲兴 in the top half of the table 共the present work兲 were determined by repeating each refinement 20 times with randomized weights applied to each pattern-matched data point 共each pixel兲. The uncertainties for the results of previous measurements 共bottom section of the table兲 have been determined from the spread of multiple measurements of the same structure factor under different experimental conditions 共electron energy, orientation, crystal thickness, etc.兲. In the final row, IAM refers to structure factors calculated according to the independent atom model, in the absence of chemical bonding, using Doyle and Turner scattering factors 共Ref. 44兲. Structure factors 共V兲 Refinement type
V104
Conventional unfiltered Conventional filtered Angular difference unfiltered Angular difference filtered TDQCBED 共Ref. 26兲 EFQCBED 共Refs. 14, 16, 18, and 25兲 IAM
V110
V018
V214
V208
共3兲 共1兲 共2兲 共2兲 共5兲
2.893 共3兲 2.895 共1兲 2.910 共4兲 2.908 共2兲 2.900 共10兲
1.391 1.386 1.376 1.386 1.386
共3兲 共1兲 共3兲 共3兲 共6兲
−2.266 共2兲 −2.247 共1兲 −2.258 共3兲 −2.252 共3兲 −2.238 共11兲
0.426 0.416 0.427 0.424 0.419
−4.031 共7兲 −3.921
2.918 共11兲 2.591
1.389 共4兲 1.402
−2.213 共7兲 −2.225
0.432 共16兲 0.436
−4.041 −4.028 −4.028 −4.028 −4.036
共4兲 共1兲 共4兲 共3兲 共3兲
Crystal thickness H 共Å兲 1694.1 1691.5 1694.7 1690.3
共5兲 共1兲 共5兲 共4兲
e− energy 共keV兲 203.26 202.87 202.69 202.61
共9兲 共1兲 共2兲 共1兲
Quality of fit 共2兲 共Refs. 3 and 7兲 5.20 0.466 0.183 0.145
ventional, energy-filtered QCBED 共Refs. 14, 16, 18, and 25兲, and structure factors calculated according to the independent atom model 共IAM兲 where chemical bonding is absent. Figure 6 compares the structure factor measurements summarized in Table I as fractions of the structure factors calculated according to the IAM. V. DISCUSSION
The most striking aspect of Fig. 5 is the relative lack of contrast in the error maps associated with both sets of angular-difference pattern matching when compared to the conventional QCBED pattern matching of the energy-filtered CBED data 共and more obviously, the unfiltered data兲. In both angular-difference cases, the mismatch is almost completely reduced to the limits of the noise present in both data sets. This is echoed by the structure factors measured from the angular-difference-based refinements 共Table I兲, which can be considered identical for both the unfiltered and the filtered data sets due to the high degree of overlap of the standard uncertainties, i.e., ⫾. Only in the case of V018, is it necessary to extend the margin of error to ⫾2, as is standard practice, to attain overlap. The absence of systematic error in both sets of angular-difference pattern matching is reflected in the very low values of 2 reported in Table I. The quality of the fits observed in both angular-difference cases 共Fig. 5兲 is a marked improvement on previous QCBED from ␣-Al2O3 with two-dimensional CBED data.14,16,18,25,26 While it is true that centrosymmetrically averaged experimental intensity gradients come at the cost of a reduced signal-to-noise ratio 共refer to Fig. 3兲 and the resulting magnitude of the signal is reduced by a factor of about 4 from the as-captured CBED data in the present case 共see Fig. 5兲, the best guide to the merits of angular-difference pattern matching should be gained by comparing relative changes in 2. In the angular-difference approach, the improvement in fit
FIG. 6. 共Color online兲 The structure factor measurements given in Table I are plotted as fractions of the IAM calculated values. Error bars have the range ⫾ and show the relative magnitude of the uncertainties in each set of measurements. The reproducibility of any one structure factor using ADQCBED appears to be well within ⫾2 while there is greater variability among the other measin surements, particularly for increasing .
115135-7
PHILIP N. H. NAKASHIMA AND BARRINGTON C. MUDDLE
PHYSICAL REVIEW B 81, 115135 共2010兲
共measured from 2兲 by changing from unfiltered to filtered CBED data is only about 21%. In the conventional QCBED approach, there is an 11-fold improvement in the fit. This equates to almost two orders of magnitude improvement in being able to extract information from unfiltered CBED data by QCBED pattern matching that comes about from using the angular-difference technique. This is also evident from the error maps associated with conventional and angulardifference pattern matching of the unfiltered CBED data 共Fig. 5兲. The inability to match the as-captured unfiltered CBED data well by conventional QCBED warrants no detailed discussion. However, the systematic errors that remain in the conventional matching of the energy-filtered data, that seem to be largely absent from both sets of angular-difference matching, should be considered with care. These errors, on close inspection, have a similar distribution to those associated with the unfiltered data matched conventionally. That is, the mismatch errors are systematic and tend to display the symmetry of, and have similar distributions to, the intensities within each disk. This has been consistently observed in previous QCBED studies.14,16,18,25,26 Residual strain is almost impossible to avoid in any CBED experiment and the effect of this is to distort the intensity distribution from the ideal symmetry resulting from a perfect crystal. In the present experiments, the integrity of each CBED pattern was checked by the examination of intensity profiles taken along loci that should possess centers of symmetry under ideal conditions. The selection of nearideal CBED patterns based on these tests, coupled with the general lack of systematic error in the ADQCBED patternmatching output, lends confidence to the assertion that regions of significant strain were avoided in the present experiments. Given that the difference between ADQCBED and conventional QCBED is the diffuse inelastic scattering component, Iinel共兲 关see Eqs. 共1兲–共4兲 and Fig. 1兴, the conclusion that the main difference in the error maps for the ADQCBED and conventional QCBED refinements lies in this component, can be reached with confidence. The volume plasmon is absent from the energy-filtered data and lower-energy surface plasmons would make an almost negligible contribution because bulk properties would far outweigh surface effects in such relatively thick specimens. This means that the only significant inelastic contribution to the energy-filtered pattern would come from TDS. If one were to interpret the mismatch error between the experimental energy-filtered CBED pattern and the refined theoretical pattern as being largely due to TDS, then one would also have to conclude that the angular-difference method, presented here, almost completely removes all of the deleterious effects of TDS in QCBED pattern matching. It appears to be even more effective in doing so than TDQCBED 共see the error maps presented in previous literature26兲. While the matching between the as-captured data sets 共filtered and unfiltered兲 and theory is inferior to that between angular differences and theory, it is interesting to note that the structure factors refined by all four sets of pattern matching show less disagreement than the differences in quality of fit would suggest. The turning points in the intensity distributions are the main constraints in determining structure fac-
tors and the positions of these within a CBED pattern are unaffected by electron-optical energy filtering. This is probably the reason that efforts to match CBED data captured on film and read with densitometers in the absence of energy filtering in the early days of QCBED, resulted in quite accurate and precise measurements.29,31,32 The level at which inelastic components of the signal in a CBED pattern interfere with the accurate measurement of structure factors can be seen from the results for V110. Of the five structure factors of ␣-Al2O3 examined in the present work, this is the one most strongly influenced by chemical bonding. All of the measured values of V110 summarized in Table I differ by about 12% from the IAM value 共see Fig. 6兲. If one considers only the results of the present work from just the one set of patterns near 关−4 4 1兴, a trend is discernible for V110. The measured magnitude of the structure factor decreases as the inelastic signal becomes more dominant in the data 共see Table I and Fig. 6兲. In the broader context, the results from previous studies by the TDQCBED technique26 and conventional energyfiltered QCBED 共Refs. 14, 16, 18, and 25兲 do not fit this trend. These imported results are averages of large numbers of measurements from different zone axes, crystal thicknesses, scattering geometries, and electron energies. For some zones, however, i.e., 关−1 1 1兴 共Ref. 16兲 and 关−4 4 1兴,26 systematic differences were observed between measurements of V110 from these and other zones. The strongest deviation was observed from 关−4 4 1兴 during the work on the TDQCBED technique.26 At that time, energy-filtered data were unavailable from this zone to check the results of TDQCBED applied to unfiltered data. However, the conventional QCBED refinement of energy-filtered data in the same scattering geometry at that zone in this work has confirmed the TDQCBED measurement 关V110 = 2.890共6兲 V 共Ref. 26兲兴. This result lowered the average of the measurements of V110 using the thickness-difference approach, relative to the conventional QCBED approach, where data from this zone had never been analyzed. However, this did not prevent TDQCBED from yielding an overall reduction in the average uncertainty of structure factor measurements from unfiltered data, compared with conventional energy-filtered QCBED. From the error maps presented in the thickness-difference work26 and those presented here, it is evident that ADQCBED is likely to be better at removing the deleterious affects of the inelastic signal on QCBED pattern matching than the thickness-difference technique. This is most likely due to the dependence of TDQCBED on more than one pattern which introduces complications in scaling patterns with respect to one another. This derives from slight differences in background intensities that arise from small changes in specimen thickness and hence, the number of mean-free paths for inelastic scattering. In addition, there are differences in absorption 共due to the changes in thickness兲 that are difficult to quantify and reconcile analytically with the change in background intensities. As a consequence, the present ADQCBED results for V110 关2.910共4兲 and 2.908共2兲 V兴 are significantly different to the measurements made by TDQCBED near 关−4 4 1兴 but are in better agreement with those from other zone axes measured previously by QCBED 关V110 = 2.918共11兲 V 共Refs. 14, 16, 18, 25, and 26兲兴 and re-
115135-8
PHYSICAL REVIEW B 81, 115135 共2010兲
DIFFERENTIAL CONVERGENT BEAM ELECTRON…
ported in the second last row of Table I. ADQCBED may provide an avenue to reducing systematic errors in the refinement of the same structure factors from different CBED patterns affected to different degrees by inelastic scattering. It is also worth noting that while the global minimum in 2 occurs at V110 = 2.890 V for the current QCBED and previous TDQCBED refinements, only a local minimum in 2 is found at this value in the ADQCBED refinements. This suggests that ADQCBED might be less susceptible to correlations between the refined parameters, resulting in global minima that are more representative of the true values of the refined quantities. Another source of systematic error that may be partially responsible for the discrepancies discussed above is the process of beam selection for inclusion in the full dynamical matrix solution of the electron scattering equations used to calculate CBED pattern intensities. This is the subject of a current study that has not yet been published. Regardless of this issue, the trend discussed for V110 that appears in Table I for all of the present measurements, is independent of beamselection criteria as the same beams were used for all four calculations. Given that beam selection for the calculation of intensities did change between the older QCBED refinements and the present work, the comparison between this and previous work is not absolute but simply indicative of the trends in the results. The most recent beam selection tests have, however, shown that the differences caused by the changes in beam selection are negligible compared to the discrepancies discussed above. Figure 6 displays the structure factor measurements of Table I relative to the corresponding value calculated according to the IAM. A few trends, apart from the one discussed above for V110, become obvious. The first is that the precision of QCBED deteriorates with increasing order or sin . This is evident from the magnitude of the error bars and is to be expected for QCBED as a general technique.3,45 The second is that the discrepancies between measurements of the same structure factor by the various techniques summarized also increases with increasing order, with the exception of the two applications of the ADQCBED technique. The agreement between results from both angular-difference refinements is relatively consistent across all measurements and always well within ⫾2. This is not always the case for the other measurements summarized here. It should be noted that the uncertainties associated with the results of previous structure factor measurements14,16,18,25,26 are in general larger than those of the individual measurements of the present work. As was previously explained, this stems from the large range of experiments involving different zone axes, electron energies, specimen thicknesses, and scattering geometries used to measure each structure factor many times in previous QCBED work. This will also need to be done to test the precision of ADQCBED, rather than relying on the uncertainty in the minimum of 2 with respect to each of the parameters in the matching of a single set of data, as in the present work. A broader range of ADQCBED refinements is left for future work. VI. CONCLUSIONS
Pattern matching of CBED data, after taking the centrosymmetric average of the first derivative with respect to
scattering angle, gives identical results to within the associated experimental uncertainty, for CBED patterns that have been electron-optically energy filtered and those that have not. There is nothing fortuitous about this outcome as it is also demonstrated that there is near equivalence of intensity gradients with respect to scattering angle in filtered and unfiltered CBED patterns. Furthermore, the quality of fit produced in this and ongoing work with the angular-difference method, exceeds any other approach to QCBED applied to ␣-Al2O3 so far.14,16,18,25,26 Ultimately, the highest accuracy and precision can only be reached by trying to eliminate all misfit between experimental data and theoretical calculations. The present work attempts to take a step closer to this realization. Structure factor measurements of greater accuracy and precision are crucial to an improved experimental knowledge of charge density distributions in real materials, below the level of disagreements between different ab initio solid-state theories. The advantage of this new method is that no manipulation of the experimental conditions of any kind is necessary after the acquisition of a single CBED pattern, including shifting the position of the probe on the specimen. The angulardifference QCBED approach works well on just a single CBED pattern. A disadvantage is that the signal-to-noise ratio suffers due to the multiple addition and subtraction processes executed. However, in ongoing applications of this method, the noise limitation has been overcome by cumulative acquisition of the same CBED pattern. This requires a lack of specimen drift over a prolonged time as well as a very clean environment and a robust specimen, lest contamination and beam damage become problematic. In the present and ongoing work on other materials, however, these issues have not surfaced. The present technique, by virtue of its requirement of only a single CBED pattern 共no translation of the probe is required兲, is most appropriate for performing charge density studies of exotic phases that may be limited in dimensions. While the results of analyzing only one pair of patterns using this approach to QCBED has been presented, there is strong evidence from these and ongoing tests that the method not only constitutes a practical way of measuring structure factors accurately and precisely but that it will serve to greatly reduce the deleterious effects of TDS and signal components other than elastic scattering within the bulk crystal present in any CBED pattern, whether it has been electronoptically energy filtered or not. In this manner, the new technique makes available potentially more accurate charge density studies via QCBED to all TEMs, not only the minority with energy filters. It can be argued that QCBED is performed optimally with an electron-optical energy filter and the angular-difference technique—the present results have shown this to be true. Use of an energy filter is always advantageous due to the increased dynamic range that becomes available when most of the inelastic signal is removed. Furthermore, energy filters permit QCBED at very high crystal thicknesses where the elastic component can become almost completely obscured by the more diffuse inelastic signal. However, the difference between energy-filtered and unfiltered ADQCBED is more
115135-9
PHYSICAL REVIEW B 81, 115135 共2010兲
PHILIP N. H. NAKASHIMA AND BARRINGTON C. MUDDLE
than 50 times smaller than the difference between filtered and unfiltered QCBED, in the present case of ␣-Al2O3. It has been shown that, within the experimental uncertainty associated with the data, structure factor refinements by ADQCBED using energy-filtered and unfiltered data are equivalent. Furthermore, given the large improvement in accuracy of conventional QCBED, even with unfiltered data, over conventional, extinction affected, single-crystal x-ray measurements of structure factors, the differences between angular-difference QCBED measurements with and without energy filtering are almost unnoticeable in this context.
*
[email protected] 1 J.
M. Zuo, J. C. H. Spence, and M. O’Keeffe, Phys. Rev. Lett. 61, 353 共1988兲. 2 D. M. Bird and M. Saunders, Ultramicroscopy 45, 241 共1992兲. 3 J. M. Zuo, Acta Crystallogr., Sect. A: Found. Crystallogr. 49, 429 共1993兲. 4 C. Deininger, G. Necker, and J. Mayer, Ultramicroscopy 54, 15 共1994兲. 5 R. Holmestad, J. M. Zuo, J. C. H. Spence, R. Høier, and Z. Horita, Philos. Mag. A 72, 579 共1995兲. 6 L. M. Peng and J. M. Zuo, Ultramicroscopy 57, 1 共1995兲. 7 M. Saunders, D. M. Bird, N. J. Zaluzec, W. G. Burgess, A. R. Preston, and C. J. Humphreys, Ultramicroscopy 60, 311 共1995兲. 8 M. Saunders, D. M. Bird, O. F. Holbrook, P. A. Midgley, and R. Vincent, Ultramicroscopy 65, 45 共1996兲. 9 J. M. Zuo, M. O’Keeffe, P. Rez, and J. C. H. Spence, Phys. Rev. Lett. 78, 4777 共1997兲. 10 M. Saunders, A. G. Fox, and P. A. Midgley, Acta Crystallogr., Sect. A: Found. Crystallogr. 55, 471 共1999兲. 11 K. Tsuda and M. Tanaka, Acta Crystallogr., Sect. A: Found. Crystallogr. 55, 939 共1999兲. 12 J. M. Zuo, M. Kim, M. O’Keeffe, and J. C. H. Spence, Nature 共London兲 401, 49 共1999兲. 13 R. Holmestad, C. Birkeland, K. Marthinsen, R. Høier, and J. Zuo, Microsc. Res. Tech. 46, 130 共1999兲. 14 V. A. Streltsov, P. N. H. Nakashima, and A. W. S. Johnson, J. Phys. Chem. Solids 62, 2109 共2001兲. 15 K. Tsuda, Y. Ogata, K. Takagi, T. Hashimoto, and M. Tanaka, Acta Crystallogr., Sect. A: Found. Crystallogr. 58, 514 共2002兲. 16 P.N.H. Nakashima, Ph.D. thesis, The University of Western Australia, 2002. 17 B. Jiang, J. M. Zuo, N. Jiang, M. O’Keeffe, and J. C. H. Spence, Acta Crystallogr., Sect. A: Found. Crystallogr. 59, 341 共2003兲. 18 V. A. Streltsov, P. N. H. Nakashima, and A. W. S. Johnson, Microsc. Microanal. 9, 419 共2003兲. 19 J. Friis, G. Madsen, F. Larsen, B. Jiang, K. Marthinsen, and R. Holmestad, J. Chem. Phys. 119, 11359 共2003兲. 20 J. Friis, B. Jiang, J.C.H. Spence, and R. Holmestad, Microsc. Microanal. 9, 379 共2003兲. 21 J. Friis, B. Jiang, J.C.H. Spence, K. Marthinsen, and R. Holmestad, Acta Crystallogr., Sect. A: Found. Crystallogr. 60, 402 共2004兲. 22 B. Jiang, J. Friis, R. Holmestad, J. M. Zuo, M. O’Keeffe, and J.
ACKNOWLEDGMENTS
The authors acknowledge gratefully the support of the Monash Centre for Electron Microscopy, the Australian Research Council, and the Victorian Partnership for Advanced Computing. They are grateful to J. Etheridge and A. F. Moodie for motivation and valuable advice, J. M. Zuo for sharing his RefineCB code, A. W. S. Johnson for valuable and insightful discussions, and to D. G. McCulloch for access to the Royal Melbourne Institute of Technology 共RMIT兲 University Microscopy and Microanalysis Facility.
C. H. Spence, Phys. Rev. B 69, 245110 共2004兲. Ogata, K. Tsuda, Y. Akishige, and M. Tanaka, Acta Crystallogr., Sect. A: Found. Crystallogr. 60, 525 共2004兲. 24 J. Friis, B. Jiang, K. Marthinsen, and R. Holmestad, Acta Crystallogr., Sect. A: Found. Crystallogr. 61, 223 共2005兲. 25 P.N.H. Nakashima, J. Appl. Crystallogr. 38, 374 共2005兲. 26 P.N.H. Nakashima, Phys. Rev. Lett. 99, 125506 共2007兲. 27 N.F. Mott, Proc. R. Soc. London, Ser. A 127, 658 共1930兲. 28 P. N. H. Nakashima and B. C. Muddle, J. Appl. Crystallogr. 43, 280 共2010兲. 29 R. Voss, G. Lehmpfuhl, and P.J. Smith, Z. Naturforsch. 35A, 973 共1980兲. 30 S. L. Dudarev, L.-M. Peng, and M. J. Whelan, Phys. Rev. B 48, 13408 共1993兲. 31 C.H. MacGillavry, Nature 共London兲 145, 189 共1940兲. 32 P. Goodman and G. Lehmpfuhl, Acta Crystallogr. 22, 14 共1967兲. 33 P.N.H. Nakashima 共unpublished兲. 34 E.N. Maslen, V.A. Streltsov, N.R. Streltsova, N. Ishzawa, and Y. Satow, Acta Crystallogr., Sect. B: Struct. Sci. 49, 973 共1993兲. 35 T. Pilati, F. Demartin, and C. Gramaccioli, Acta Crystallogr., Sect. A: Found. Crystallogr. 49, 473 共1993兲. 36 S. Pillet, M. Souhassou, C. Lecomte, K. Schwarz, P. Blaha, M. Rerat, A. Lichanot, and P. Roversi, Acta Crystallogr., Sect. A: Found. Crystallogr. 57, 290 共2001兲. 37 A. Brown, Ph.D. thesis, University of New England, 1991. 38 A. Kirfel and K. Eichhorn, Acta Crystallogr., Sect. A: Found. Crystallogr. 46, 271 共1990兲. 39 A. Brown, M. Spackman, and R. Hill, Acta Crystallogr., Sect. A: Found. Crystallogr. 49, 513 共1993兲. 40 J. Lewis, D. Schwarzenbach, and H. Flack, Acta Crystallogr., Sect. A: Cryst. Phys., Diffr., Theor. Gen. Crystallogr. 38, 733 共1982兲. 41 L. Salasco, R. Dovesi, R. Orlando, M. Causa, and V.R. Saunders, Mol. Phys. 72, 267 共1991兲. 42 J. B. Wachtman, W. E. Tefft, D. G. Lam, and C. S. Apstein, Phys. Rev. 122, 1754 共1961兲. 43 P. N. H. Nakashima and A. W. S. Johnson, Ultramicroscopy 94, 135 共2003兲. 44 P. A. Doyle and P. S. Turner, Acta Crystallogr., Sect. A: Cryst. Phys., Diffr., Theor. Gen. Crystallogr. 24, 390 共1968兲. 45 J.C.H. Spence and J.M. Zuo, Electron Microdiffraction 共Plenum Press, London, New York, 1992兲. 23 Y.
115135-10