Rangwala et al. BMC Cancer 2012, 12:402 http://www.biomedcentral.com/1471-2407/12/402
RESEARCH ARTICLE
Open Access
Differential effects of arsenic trioxide on chemosensitization in human hepatic tumor and stellate cell lines Fatima Rangwala1, Kevin P Williams2, Ginger R Smith2, Zainab Thomas2, Jennifer L Allensworth3, H Kim Lyerly3,4, Anna Mae Diehl1, Michael A Morse1,4 and Gayathri R Devi3,4*
Abstract Background: Crosstalk between malignant hepatocytes and the surrounding peritumoral stroma is a key modulator of hepatocarcinogenesis and therapeutic resistance. To examine the chemotherapy resistance of these two cellular compartments in vitro, we evaluated a well-established hepatic tumor cell line, HepG2, and an adult hepatic stellate cell line, LX2. The aim was to compare the chemosensitization potential of arsenic trioxide (ATO) in combination with sorafenib or fluorouracil (5-FU), in both hepatic tumor cells and stromal cells. Methods: Cytotoxicity of ATO, 5-FU, and sorafenib, alone and in combination against HepG2 cells and LX2 cells was measured by an automated high throughput cell-based proliferation assay. Changes in survival and apoptotic signaling pathways were analyzed by flow cytometry and western blot. Gene expression of the 5-FU metabolic enzyme, thymidylate synthase, was analyzed by real time PCR. Results: Both HepG2 and LX2 cell lines were susceptible to single agent sorafenib and ATO at 24 hr (ATO IC50: 5.3 μM in LX2; 32.7 μM in HepG2; Sorafenib IC50: 11.8 μM in LX2; 9.9 μM in HepG2). In contrast, 5-FU cytotoxicity required higher concentrations and prolonged (48–72 hr) drug exposure. Concurrent ATO and 5-FU treatment of HepG2 cells was synergistic, leading to increased cytotoxicity due in part to modulation of thymidylate synthase levels by ATO. Concurrent ATO and sorafenib treatment showed a trend towards increased HepG2 cytotoxicity, possibly due to a significant decrease in MAPK activation in comparison to treatment with ATO alone. Conclusions: ATO differentially sensitizes hepatic tumor cells and adult hepatic stellate cells to 5-FU and sorafenib. Given the importance of both of these cell types in hepatocarcinogenesis, these data have implications for the rational development of anti-cancer therapy combinations for the treatment of hepatocellular carcinoma (HCC). Keywords: Hepatocellular carcinoma, Arsenic trioxide, Sorafenib, 5-fluorouracil, Apoptosis, High throughput assay, Stroma
Background Recent data has demonstrated that the crosstalk between malignant hepatocytes and non-parenchymal, stromal liver cells, or the hepatic stellate cells, is crucial to hepatocarcinogenesis [1]. In vitro hepatic stellate cells within the tumor microenvironment promote hepatocarcinoma cell growth, epithelial to mesenchymal transition (EMT), * Correspondence:
[email protected] 3 Department of Surgery, Duke University Medical Center, Durham, NC 27710, USA 4 Duke Cancer Institute, Duke University Medical Center, Durham, NC 27710, USA Full list of author information is available at the end of the article
and tumor invasion [2-4]. In vivo, subcutaneous coimplantation of hepatic stellate cells and hepatocellular carcinoma cells into nude mice results in significantly increased tumor growth and tumor volumes in comparison to the implantation of hepatocellular carcinoma cells alone [5]. These studies highlight tumor-stroma interactions as a potential mediator of chemoresistance. Arsenic trioxide (ATO), used for the treatment of relapsed acute promyelocytic leukemia, activates the caspase cascade and induces production of reactive oxygen species, resulting in apoptosis [6]. Multiple groups initially demonstrated that treatment of HCC cell lines with ATO
© 2012 Rangwala et al.; licensee BioMed Central Ltd. This is an Open Access article distributed under the terms of the Creative Commons Attribution License (http://creativecommons.org/licenses/by/2.0), which permits unrestricted use, distribution, and reproduction in any medium, provided the original work is properly cited.
Rangwala et al. BMC Cancer 2012, 12:402 http://www.biomedcentral.com/1471-2407/12/402
inhibited cell growth and induced apoptosis in a concentration-dependent manner [7-9]. Furthermore, both in a rat model of diethaylnitrosamine-induced HCC and in murine HCC xenografts, ATO treatment significantly increased rates of apoptosis in tumor nodules in comparison to vehicle control [10,11]. Unfortunately, in a phase II clinical trial, single agent ATO did not show activity against advanced hepatocellular carcinoma (HCC) [12]. Possible explanations for the discrepant results between the preclinical data and the clinical data include HCC tumor heterogeneity both in humans and model systems. In addition, the preclinical model systems assessed cytotoxicity of ATO on the tumor compartment, but not on the supporting stromal compartment. The pro-apoptotic effect of ATO can enhance the efficacy of other drugs given in combination as has been noted in other tumor types. In colorectal adenocarcinoma cells, ATO acts as a chemosensitizer to the pyrimidine antimetabolite 5-fluorouracil (5-FU) [13]. 5-FU, an inhibitor of thymidylate synthase (TS), was one of the first reported chemotherapeutic agents tested in the treatment of HCC with response rates of approximately 10% [14]. Capecitabine, an orally administered 5-FU prodrug, yielded response rates of 11% in patients with advanced HCC [15]. In addition to the benefit provided by this modest response rate, the fluoropyrimidines have a distinct advantage in the treatment of hepatobiliary malignancies in that they exhibit a favorable safety profile and do not require a priori dose reduction secondary to liver dysfunction [16,17]. Based on these data we were interested in comparing the chemosensitivity of the hepatic tumor compartment and the hepatic stromal compartment to single agent ATO, 5-FU and sorafenib. In the present study, the tumor compartment was modeled using a human, well-differentiated, epithelial hepatic tumor line, HepG2 [18], and the stromal compartment was modeled using the human hepatic stellate cell line, LX2 [19-21]. We hypothesized that the ATO/5-FU combination and the ATO/sorafenib combination would result in potentiation of apoptosis in the tumor and stromal cell line.
Methods Cell culture
HepG2 (ATCC) cells and LX2 cells [21] were cultured as previously described [18,19]. Cells at 50% confluence in a 96-well plate (Corning Incorporated, Corning, NY, USA) were treated with increasing concentrations of arsenic trioxide (Cephalon, Philadelphia, PA), 5-fluorouracil (APP pharmaceuticals, Schaumburg, IL), or sorafenib (Bayer Healthcare Pharmaceuticals and Onyx Pharmaceuticals, San Francisco, CA) in serum-containing medium for the time periods indicated.
Page 2 of 11
Automated cell proliferation assay
HepG2 and LX2 cells were plated at 4000 and 3000 cells/well respectively in 96-well clear tissue culture plates (Costar, Corning Incorporated, Corning, NY) in 200 μl media and allowed to adhere overnight. Media was then removed from the cell plates and drug (200 μL) was transferred from intermediate plates to the cell plates using a Biomek NX workstation (Beckman Coulter Inc., Fullerton, CA) equipped with a 96-well head. For intermediate drug plates, using a Biomek 3000 workstation, drugs were serially diluted (eight concentrations) in media in 96-well 1.1 ml deep well plates (Axygen, VWR). For combination studies, the serial dilution was carried out at a 2-fold higher concentration and then a fixed concentration of a second drug added to all wells of the dose response intermediate plate. Each plate consisted of the following controls: column 1 contained media (no cells), columns 2 and 11 cells plus DMSO (final concentration 0.5%), and column 12 cells plus media. For combination experiments, column 11 would contain cells plus the second compound only. Cells were incubated with drugs for 24 hr, 48 hr, 72 hr and 96 hr and then cell proliferation assessed by an automated MTT assay adapted from our previous manual procedure [22]. Prior to preparation of cells for the MTT assay, all wells were viewed under an inverted scope to assess for the general number of attached cells in order to confirm correlation with assay values. Briefly, using the Biomek NX equipped with a 96-well head for all steps, MTT (40 μL) was added to the cell plates and incubated for 2 h. Media was then removed, DMSO (100 μL) added and the plates read at 550 nm in a SpectraMax Plus plate reader (Molecular Devices, Sunnyvale, CA, USA). Western blot analysis
Cells were treated as noted above and lysates were prepared. Western blot analysis was performed as previously described [22]. Membranes were incubated with primary antibodies against XIAP (1:2000; BD Bioscience), actin (1:1000; Santa Cruz Biotechnology), procaspase-9 (1:2000; NeoMarkers), and glyceraldehyde3-phosphate dehydrogenase (GAPDH; 1:2000; Santa Cruz Biotechnology) for 1 h at room temperature. Membranes were incubated with primary antibodies against survivin (1:12000; R&D BioSystems), p-MAPK (1:1000; Cell Signaling), MAPK (1:1000; Cell Signaling), p-JNK (1:1000; Cell Signaling), and JNK (1:1000; Cell Signaling) overnight at 4°C. Drug synergism analysis
Analysis of drug synergism was performed using the Calcusyn software (Biosoft, Cambridge, UK), which uses the Chou-Talalay method [23] and generates
Rangwala et al. BMC Cancer 2012, 12:402 http://www.biomedcentral.com/1471-2407/12/402
Page 3 of 11
summary statistics. The resultant combination index (CI) is a quantitative measurement of the relationship between two agents; a CI greater than 1 indicates antagonism, while a CI of one indicates an additive interaction and a CI less than one indicates synergism. Cell cycle analysis
Cells were treated with DMSO or arsenic trioxide (5 μM or 25 μM) for 24 hr and then stained with propidium iodide (PI) as previously reported [24]. At least 25,000 events were collected on a FACScalibur flow cytometer (Becton Dickinson) and analyzed using the Cellquest software (Becton Dickinson). Data presented represents n = 2 replicates. Quantitative real-time PCR for thymidylate synthase
HepG2 cells were seeded at 300,000 cells per well in clear, 6-well Costar plates and allowed to attach overnight. After treatment with vehicle (DMSO), 0.5 μM ATO, 5 μM ATO, or 25 μM ATO for 24 hrs, media was discarded and RNA extracted from the cells using the RNA extraction kit (Ambion, Austin, TX, USA) as previously described [25]. RNA (0.4 μg) was converted into cDNA using the High Capacity cDNA RT-PCR kit (Applied Biosystems, Carlsbad, CA, USA). Quantitative real-time PCR analyses were performed using primers from
24h 48h 72h 96h
80 60 40 20 0 1
10 100 ATO Concentration ( M)
GraphPad Prism 5 (GraphPad Software, San Diego, CA) was used for nonlinear regression statistical analysis. For each concentration, percent inhibition values were calculated and IC50 values determined using a four-parameter dose–response (variable slope) equation in GraphPad Prism.
B
HepG2 100
Statistical analysis
1000
Relative cell proliferation (%)
Relative cell proliferation (%)
A
Integrated DNA Technologies. Amplification reactions were carried out in an ABI Prism Fast 7500 system (Applied Biosystems Inc, Foster City, CA). Gene expression for thymidylate synthase (TS) was performed using the following primer sets from Integrated DNA Technologies: TS forward 50-GGCCTCGGTGTGCCTTT-30, reverse 50GATGTGCGCAATCATGTACGT-30. Power SYBR Green PCR Master Mix (Applied Biosystems) was used for the PCR to a final volume of 20 μL. A β-actin primer set (Ambion) was used as an internal control. Cycling conditions were 50°C for 2 minutes and 95°C for 10 mins and followed by 40 cycles at 95°C for 15 sec and 60°C for 1 min. The standard curve method was used to obtain threshold values (CT). Triplicate CT values were analyzed in Microsoft Excel using the comparative CT method as described by the manufacturer (Applied Biosystems). Fold differences were calculated as described previously [22] and represent changes normalized to a vehicle reference.
LX2 24h 48h 72h
100 80 60 40 20 0 0.1
1 10 100 ATO Concentration ( M)
Time (h)
IC50 value (µM)
Time (h)
IC50 value (µM)
24
32.7
24
5.3
48
21.7
48
2.6
72
12.1
72
1.2
96
7.7
1000
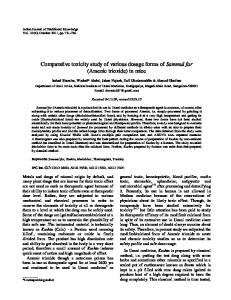
Figure 1 ATO inhibits HepG2 and LX2 Cell Proliferation. HepG2 (A) and LX2 (B) cells were treated with ATO at the indicated concentrations for 24 hrs, 48 hrs, 72 hrs and 96 hrs (HepG2 only) and cell proliferation assessed by MTT assay. For each concentration, percent inhibition values were calculated and data normalized to vehicle control. Relative IC50 values shown in the corresponding tables were determined by non-linear regression in GraphPad Prism (n = 3 replicates).
Rangwala et al. BMC Cancer 2012, 12:402 http://www.biomedcentral.com/1471-2407/12/402
Page 4 of 11
Results
Synergistic cytotoxicity of arsenic trioxide in combination with fluorouracil in HepG2 cells
HepG2 and LX2 cells are sensitive to the cytotoxic effects of arsenic trioxide
In order to evaluate the effect of single agent ATO on cellular proliferation, HepG2 and LX2 cells were treated with increasing concentrations of drug for 24 to 96 hr. Dose response curves demonstrate the sensitivity of both cell lines in a time-dependent fashion, with LX2 cells being more sensitive to ATO treatment with a relative IC50 of 5.3 μM at 24 hrs of treatment compared to a relative IC50 of 32.7 μM for the HepG2 cells at the same incubation time (Figures 1A and 1B). In order to examine the mechanism of ATO-induced cytotoxicity, cell cycle analysis was performed on HepG2 and LX2 cells treated with 5 μM or 25 μM of ATO for 24 hr. Flow cytometry of the LX2 cells demonstrates an early apoptotic population, as represented by the presence of a sub-G1 peak, in cells treated with 5 μM and 25 μM ATO (Figure 2) in comparison to vehicle control. 50 μM ATO treatment is required to induce apoptosis of the HepG2 cells thus confirming the findings of our cytotoxicity assays (data not shown). Taken together, these data indicate that the hepatic stellate cells are more sensitive than the hepatocellular carcinoma cells to ATO-induced cell death.
To reduce variability and facilitate multiple cell line and drug combinations, dose response and drug combination experiments were carried out in 96-well plate format using an automated, high throughput system. First, to determine the degree of cytotoxicity of 5-FU alone on the LX2 and HepG2 cells, both cell lines were treated with increasing concentrations of 5-FU for 24 and 72 hr. Neither cell type experienced significant cytotoxicity following 24 hr of treatment, but cytotoxicity was observed in HepG2 cells treated with 5-FU for 72 hr (IC50 of 5 mg/ml at 72 hr) (Figure 3A). In contrast, LX2 cells remain resistant to 5-FU even with high drug concentrations and prolonged exposure (Figure 3B). To assess potential synergy between 5-FU and ATO, HepG2 and LX2 cells were treated for 24 hrs with increasing concentrations of 5-FU in the absence or presence of a fixed concentration of ATO. At 24 hrs 5-FU has minimal effect on cell proliferation of HepG2 (Figure 4A, left panel) or LX2 cells (Figure 4B, left panel). ATO treatment (5 μM) alone of HepG2 cells for 24 hr also results in minimal cell death, but in combination with 5 mg/ml 5-FU, there is a significant decrease in cell proliferation with the combination treatment (p
HepG2 Untreated
5 µM ATO
25 µM ATO
LX2
Figure 2 ATO induces apoptosis of LX2 cells. HepG2 and LX2 cells were untreated or incubated in the presence of 5 μM or 25 μM ATO for 24 hrs. Apoptotic cells were determined by propidium iodide staining and FACS analysis. The red arrow indicates the sub –G1 peak which represents an early apoptotic cell population. A representative example of three independent experiments is shown.
Rangwala et al. BMC Cancer 2012, 12:402 http://www.biomedcentral.com/1471-2407/12/402
B
HepG2 24h 100
72h
80 60 40 20 0 0.1
1
10 100 [5-FU] (mg/ml)
1000
Relative cell proliferation (%)
Relative cell proliferation (%)
A
Page 5 of 11
LX2 100
24h 72h
80 60 40 20 0 0.1
1
10 100 [5-FU] (mg/ml)
Time (h)
IC50 value (mg/ml)
Time (h)
IC50 value (mg/ml)
24
ND
24
ND
72
5
72
75.3
1000
Figure 3 5-FU inhibits HepG2 and LX2 Cell Proliferation at 72 hrs. HepG2 (A) and LX2 (B) cells were treated with 5-FU at the indicated concentrations for 24 and 72 hrs and cell proliferation was assessed by MTT assay. For each concentration, percent inhibition values were calculated and data normalized to vehicle control. IC50 values shown in the corresponding tables were determined by non-linear regression in GraphPad Prism (n = 3 replicates).
value