sectional patterns of fertility and child investment over the course of the
demographic ... Consequently, fertility differentials by income and education his-
torically ...
Review of Economic Studies (2016) 83, 365–401 doi:10.1093/restud/rdv026 © The Author 2015. Published by Oxford University Press on behalf of The Review of Economic Studies Limited. Advance access publication 20 July 2015
Differential Fertility, Human Capital, and Development TOM S. VOGL Princeton University, NBER, and BREAD First version received April 2014; final version accepted April 2015 (Eds.) Using micro-data from 48 developing countries, this article studies changes in cross-sectional patterns of fertility and child investment over the demographic transition. Before 1960, children from larger families obtained more education, in large part because they had richer and more educated parents. By century’s end, these patterns had reversed. Consequently, fertility differentials by income and education historically raised the average education of the next generation, but they now reduce it. Relative to the level of average education, the positive effect of differential fertility in the past exceeded its negative effect in the present. While the reversal of differential fertility is unrelated to changes in GDP per capita, women’s work, sectoral composition, or health, roughly half is attributable to rising aggregate education in the parents’ generation. The data are consistent with a model in which fertility has a hump-shaped relationship with parental skill, due to a corner solution in which low-skill parents forgo investment in their children. As the returns to child investment rise, the peak of the relationship shifts to the left, reversing the associations under study. Key words: Fertility, Human capital, Economic development, Economic growth JEL Codes: O15, I25, J11, J13
1. INTRODUCTION Over the last two centuries, most of the world’s economies have seen unprecedented increases in living standards and decreases in fertility. Recent models of economic growth have advanced the understanding of the joint evolution of these economic and demographic processes.1 Central to many, but not all, of these theories is the idea that a rising return to investment in children altered the calculus of childbearing, enabling the escape from the Malthusian trap. Although an abundance of aggregate time series evidence helps to motivate this work, efforts to understand the role of heterogeneity within an economy have been hampered by fragmentary evidence on how cross-sectional patterns of fertility and child investment change over the course of the demographic transition. Using a range of data covering half a century of birth cohorts from 48 developing countries, this article provides a unified view of how those patterns change, linking them to theories of the interplay between demography and economic growth.
1. Collectively labeled “Unified Growth Theory” (Galor, 2011), these models have explored the roles of a variety of factors, including scale effects on technological progress (Galor and Weil, 2000), increases in longevity (Kalemli-Ozcan, 2002; Soares, 2005), changes in gender roles (Galor and Weil, 1996; Voigtläender and Voth, 2013), declines in child labour (Hazan and Berdugo, 2002; Doepke and Zilibotti, 2005), and natural selection (Galor and Moav, 2002). 365
[15:28 16/12/2015 rdv026_print.tex]
RESTUD: The Review of Economic Studies
Page: 365
365–401
366
REVIEW OF ECONOMIC STUDIES
Two strands in the theoretical literature relate to this focus on cross-sectional heterogeneity in fertility and skill investment during the process of growth.2 The first, due to Galor and Moav (2002), analyses the evolutionary dynamics of lineages that have heterogeneous preferences over the quality and quantity of children.3 A subsistence constraint causes fertility to initially be higher in richer, quality-preferring families, but as the standard of living rises above subsistence, fertility differentials flip. Consequently, in the early (Malthusian) regime, fertility heterogeneity promotes the growth of quality-preferring lineages, raising average human capital; in the late (modern) regime, it promotes the growth of quantity-preferring lineages, dampening human capital growth. A second strand in the literature—including papers by Dahan and Tsiddon (1998), Morand (1999), De la Croix and Doepke (2003), and Moav (2005)—fixes preferences and examines how the initial distribution of income or human capital interacts with fertility decisions to affect growth and income distribution dynamics.4 These authors assume a specific structure of preferences and costs to reproduce two patterns observed in most present-day settings: (1) that wealthy parents have fewer children than poor parents and (2) that they educate their children more. As in Galor and Moav’s (2002) modern regime, heterogeneity in fertility lowers average skill.5 Indeed, much of this work posits that the higher fertility of the poor can help explain macroeconomic trends in developing countries during the post-war era. Interest in this idea dates back to Kuznets (1973), who conjectured that differential fertility adversely affects both the distribution and the growth rate of income. But did rich or high-skill parents have low relative fertility in developing countries throughout this period? At least since Becker (1960), economists have recognized that although fertility decreases with income or skill in most settings today, the relationships may have once been positive. Along these lines, in the mid- to late-twentieth century, some small, cross-sectional studies in mostly rural parts of Africa and Asia showed a positive relation between fertility and parental income or skill (Schultz, 1981). Other studies of similar contexts revealed that children from larger families obtained more schooling, consistent with higher fertility among better-off parents (Buchmann and Hannum, 2001). Studies of historical Europe also suggest that fertility once increased with economic status in some settings.6 But researchers have had to look far back in history to find these patterns in Western data, and economic historians are far from a consensus on whether they represent a regularity (Dribe et al., 2014). In the US, for example, the relationship has been negative for as long as measurement has been possible (Jones and Tertilt, 2008). Efforts to form a unified view of these results have taken three approaches: (1) combining results from studies that use a variety of methods and measures (Cochrane, 1979; Skirbekk, 2008), (2) analysing survey data collected contemporaneously in several contexts (UN, 1987, 1995; Cleland and Rodríguez 1988; Mboup and Saha, 1998; Kremer and Chen, 2002), or (3) studying data from a single population over time (Maralani, 2008; Bengtsson and Dribe et al., 2014; Clark and Cummins, 2015). Although informative, these approaches are limited in their ability to clarify when the associations change; how those changes relate to theories of growth
2. In an important contribution to this literature not directly related to growth, Mookherjee et al. (2012) derive conditions under which steady state reasoning disciplines the wage-fertility relationship to be negative. 3. See Clark (2007) and Galor and Michalopoulos (2012) for evolutionary theories emphasizing different sources of preference heterogeneity. 4. Althaus (1980) and Kremer and Chen (2002) consider similar issues in models that assume a specific relationship between parental skill and fertility, rather than allowing it to arise from parental optimization. 5. Several models also demonstrate how these fertility gaps can give rise to poverty traps, thus widening inequality. Empirically, Lam (1986) shows that the effect of differential fertility on inequality depends on the inequality metric, but his finding does not overturn the general equilibrium reasoning of recent theories. 6. See Weir (1995) and Hadeishi (2003) on France; Clark and Hamilton (2006) on Britain; and Bengtsson and Dribe et al. (2014) on Sweden.
[15:28 16/12/2015 rdv026_print.tex]
RESTUD: The Review of Economic Studies
Page: 366
365–401
VOGL
DIFFERENTIAL FERTILITY
367
and demographic transition; and what implications they have for the next-generation’s human capital distribution. This article seeks to fill that gap by analysing the evolution of two cross-sectional associations in many developing countries over many decades: (1) that between parental economic resources (proxied by durable goods ownership or father’s education) and fertility and (2) that between sibship size and education. The results show that, in the not-too-distant past, richer or higher-skill parents had more children, and children with more siblings obtained more education. Today, the opposite is true for both relationships. These findings have implications for theories of fertility and the demographic transition, as well as for understanding the role of differential fertility in the process of growth. In particular, until recently, differences in fertility decisions across families raised the per capita stock of human capital instead of depressing it. To guide the empirical work, the article begins by showing how skill differentials in fertility can change sign in the growth literature’s standard framework for the study of cross-sectional fertility heterogeneity, due to De la Croix and Doepke (2003) and Moav (2005).7 Within that framework, both papers assume that children cost time, while education costs money, which yields the negative gradient that is prevalent today. I demonstrate that with the addition of a subsistence constraint or a goods cost of children, the same framework predicts that fertility increases with income or skill among the poor, so that the relationship between parental resources and fertility is hump-shaped. In the early stages of development, when most parents have little income or skill, children with more siblings come from better-off families and obtain more education. With growth in income or skill, the association of parental resources with fertility turns negative. Additionally, in the model specification with a goods cost of children (but not with a subsistence constraint), a rising return to child investment moves the peak of the hump to the left, so that the association of parental resources with fertility can flip even without income growth. The empirical analysis illustrates these results with two datasets constructed from the Demographic and Health Surveys (DHS). For the first, I treat survey respondents (who are women of childbearing age) as mothers, using fertility history data to construct two cross-sections of families from twenty countries in the 1986–94 and 2006–11 periods. In these data, respondents enumerate all of their children ever born, with information on survival status. Between the early and late periods, the associations of fertility with parental durable goods ownership and paternal education flipped from positive to negative in Africa and rural Asia; they were negative throughout in Latin America.8 I argue that these patterns capture the tail end of a global transition from a positive to a negative association. Consistent with the existence of both goods and time costs of children, non-parametric estimates show that these relationships start hump-shaped, but the peak of the hump shifts to the left over time, eventually disappearing altogether, leaving a negative slope. For the second dataset, I treat the DHS respondents as siblings, using sibling history data to retrospectively construct a longer panel of families from forty-three countries. In these data, respondents report all children ever born to their mothers, again with information on survival status. Among birth cohorts of the 1940s and 50s, most countries show positive associations between the number of ever-born or surviving siblings and educational attainment. Among cohorts of the 1980s, most countries show the opposite. The transition timing varies, with Latin America roughly in the 1960s, Asia roughly in the 1970s, and Africa roughly in the 1980s. 7. Jones et al. (2010) discuss related theoretical issues but do not explore how these differentials reverse over time. 8. These results appear to contradict Kremer and Chen (2002) and their sources, which find in the same data that total fertility rates predominantly decrease with maternal education. Section 4.1 discusses reasons for the discrepancy and explains why this article’s approach may be more fruitful for studying differential fertility over the long run.
[15:28 16/12/2015 rdv026_print.tex]
RESTUD: The Review of Economic Studies
Page: 367
365–401
368
REVIEW OF ECONOMIC STUDIES
Taken together, the data imply that in nearly all sample countries, the associations between parental economic resources and fertility and between sibship size and education both flipped from positive to negative. Although the DHS offers little data on childhood economic circumstance, three supplementary datasets (from Bangladesh, Indonesia, and Mexico) suggest that one can attribute much of the reversal in the sibsize–education association to the reversal of the link between paternal education and fertility.9 In all, the analysis covers forty-eight countries, the richest being Mexico. Data from these forty-eight countries point to a broad regularity, though their implications for the historical development of more advanced economies are less certain. To test alternative theories of this reversal, I assemble a country-by-birth cohort panel of sibsize–education coefficients. Net of country and cohort fixed effects, neither women’s labour force participation, nor sectoral composition, nor GDP per capita, nor child mortality predicts the sibsize–education association. Rather, one variable can account for over half of the reversal of the sibsize–education association: the average educational attainment of the parents’ generation. Because the reversal is uncorrelated with economic growth, its most likely cause is not a shift of the income distribution over the peak of a stable, hump-shaped income-fertility profile. Instead, much as the non-parametric fertility history results suggest, a rising return to investment in children may have lowered the income threshold at which families begin to invest, moving the peak of the income-fertility profile to the left. In many endogenous growth models, aggregate human capital raises the individual return to child investment, providing an explanation for the link between average adult education and differential fertility. These findings imply changes in the effect of differential fertility on average human capital in the next generation, which I quantify relative to a counterfactual with an exogenous fertility level that applies to all families. The theoretical framework shows that one can separate this effect into two components, the first reflecting how equalizing fertility across families would affect the composition of the next generation, the second reflecting how it would affect families’ child investment decisions. Model calibration reveals that the second component is extremely sensitive to the choice of the exogenous fertility level. I thus focus on the first component, which is invariant to the exogenous fertility level and is also estimable by means of a simple reweighting procedure. The procedure compares actual average educational attainment with the average that would arise if all families had the same number of children, with no change to their education (i.e. no reoptimization). In deriving this composition effect, the article contributes to a growing demographic literature on the aggregate consequences of cross-sectional associations (Mare and Maralani, 2006). According to the results of the reweighting procedure, differential fertility raises average education in the early stages of development but decreases average education in the later stages. Since human capital investment is low in the early stages, the early positive effect of differential fertility is proportionally more important than the later negative effect. Indeed, among the least educated cohorts in the sample, differential fertility raises cohort mean education by as much as one-third and by 15% on average. If differential fertility plays an important role in growth, that role is thus most likely positive. The data also allow one to estimate, for women born around 1960, how differential fertility affected each country’s distance to the world human capital frontier, which for that cohort is the US. In over 90% of sample countries, differential fertility reduced the shortfall in mean human capital relative to the US, with an average reduction of roughly 3% and a maximum reduction of roughly 9%. By shedding light on the timing, causes, and consequences of the reversal of differential fertility in the developing world, this article contributes to several literatures. Most apparent is 9. The supplementary datasets also indicate that the reversal of the sibsize–education association is similar for men (who are not in the DHS) and women.
[15:28 16/12/2015 rdv026_print.tex]
RESTUD: The Review of Economic Studies
Page: 368
365–401
VOGL
DIFFERENTIAL FERTILITY
369
the connection with two empirical literatures: one on parental socioeconomic status and fertility, the other on sibship size and education. In these literatures, evidence on positive associations is scattered, lacking a unifying framework.10 This article uncovers a common time path in which both associations flip from positive to negative. Building on the theoretical growth literature, it provides a theoretical framework that explains the reversal and gives insight into its aggregate implications. Along these lines, the article shows how cross-family heterogeneity in fertility increases average education early in the development process but decreases it later; proportionally, the positive effect is much larger than the negative effect. That finding adds to our understanding of how demography interacts with the macroeconomy and calls attention to how cross-sectional patterns can inform models of fertility decline. The basic time-series facts about fertility decline are overdetermined, so a more thorough treatment of changing heterogeneity within populations will help narrow the field of candidate theories of the demographic transition. 2. CROSS-SECTIONAL PATTERNS IN A QUALITY–QUANTITY FRAMEWORK This section studies how a subsistence constraint or a goods cost of children affect the growth literature’s standard theoretical framework for studying differential fertility. Given the article’s focus, I derive the model’s cross-sectional properties and then briefly discuss its dynamic implications. 2.1. Setup Parents maximize a log-linear utility function over their own consumption (c), the number of children (n), and human capital per child (h): U(c,n,h) = αlog(c)+(1−α)(log(n)+β log(h)).
(2.1)
α ∈ (0,1) indexes the weight the parents place on their own consumption relative to the combined quantity and quality of children, while β ∈ (0,1) reflects the importance of quality relative to quantity. Child quality, or human capital, is determined by: h(e) = θ0 +θ1 e.
(2.2)
where e denotes education spending per child but also represents broader investment in children.11 θ0 > 0 is a human capital endowment, while θ1 > 0 is the return to investment in children. The (e) presence of θ0 implies that the elasticity ehh(e) increases with e—which Jones et al. (2008) point out is crucial for an interior solution in which fertility declines with parental skill—and also allows for a corner solution with no child investment. θ1 reflects both the return to skill and the price of skill, the latter being a function of school availability, teacher quality, and the opportunity cost of children’s time. Irrespective of human capital, each child costs τ ∈ (0,1) units of time and κ ≥ 0 goods. These costs represent the minimum activities (e.g. pregnancy, child care) and goods (e.g. food, clothing) 10. A separate literature takes interest in the causal effect of exogenous increases in family size (Rosenzweig and Wolpin, 1980; Black et al., 2005; Li et al., 2008; Rosenzweig and Zhang, 2009; Angrist et al., 2010; Ponczek and Souza, 2012), where the evidence is also mixed. 11. The assumption that β < 1 plays no important conceptual role in the theory, but it guarantees the existence of a solution under a linear human capital production function. If one adds concavity to the production function, for example by setting h(e) = (θ0 +θ1 e)σ with σ ∈ (0,1), then one can obtain a solution so long as β is smaller than σ1 > 1.
[15:28 16/12/2015 rdv026_print.tex]
RESTUD: The Review of Economic Studies
Page: 369
365–401
370
REVIEW OF ECONOMIC STUDIES
required for each child.�12 Parents � are endowed with human capital H, drawn from a distribution F (H) with support on H,H , and w is the wage per unit of parental human capital. Thus, the budget constraint is: c+κn+ne ≤ wH (1−τ n). (2.3) The parents may also face a subsistence constraint, so that c must exceed c˜ ≥ 0. 13 The framework allows the goods cost of children and the subsistence level to be zero, in which case it becomes similar to the models of differential fertility by De la Croix and Doepke (2003) and Moav (2005). I seek to understand how its predictions change when either of these parameters is positive. 2.2. Optimal fertility and child investment The framework yields closed-form solutions for optimal fertility and child investment. To characterize two threshold levels of parental human capital are important. The first these solutions,
1 θ0 /θ1 � is H ≡ τ w β −κ , above which parents begin to invest in their children. If parental human � then parents are content with the human capital endowment θ0 , choosing capital is below H, a corner solution with no child investment. For higher skill parents, investment per child rises � linearly in their human capital: e∗ = β(κ+τ wH)−θ0 /θ1 if H ≥ H. H
1−β
� fertility decisions depend on the threshold c˜ , above which parents cease In addition to H, αw to be subsistence-constrained: ⎧
wH−˜c c˜ � ⎪ if H < min , H ⎪ κ+τ wH αw ⎪ ⎪ ⎪ ⎨ (1−α)wH c˜ � if ≤ H < H ∗ κ+τ wH αw = (1−β)(wH−˜ nH (2.4) c) c˜ � ⎪ if H ≤ H < αw ⎪ κ−θ0 /θ1 +τ wH ⎪
⎪ ⎪ ⎩ (1−α)(1−β)wH if H ≥ max c˜ , H � . κ−θ0 /θ1 +τ wH αw In the first line, parents are both subsistence constrained and at an investment corner solution. After consuming c˜ , they spend all of their remaining full income wH on child quantity, so c˜ � and H � < c˜ , fertility increases with H. The next two lines deal with the cases in which αw 0 and constant if κ = 0. In the third line, the subsistence constraint binds, but the parents now choose an investment interior solution, making dn∗ the comparative static ambiguous: dHH � 0 if and only if κ � θθ01 −τ c˜ . It is also ambiguous in the final line, in which the parents are constrained by neither the subsistence constraint nor the lower dn∗ bound on child investment: dHH � 0 if and only if κ � θθ01 . If the goods cost is not too large, the substitution effect of a higher wage dominates the income effect. To summarize, either a subsistence constraint or a goods cost of children guarantees a humpshaped relationship between parental human capital and fertility, so long as the goods cost is not too large.14 At low human capital levels, fertility increases with human capital if κ > 0 or 12. The model implicitly focuses on surviving children, abstracting from child mortality. One can view quantity costs τ and κ as incorporating the burden of mortality. I mainly address this issue empirically, showing in Section 5 that mortality decline is unrelated to the main results. 13. Assume that H > c˜ , so the lowest-skill parents can meet the subsistence constraint. 14. De la Croix (2013) and Murtin (2013) also discuss the role of a goods cost in generating a hump-shaped income-fertility profile.
[15:28 16/12/2015 rdv026_print.tex]
RESTUD: The Review of Economic Studies
Page: 370
365–401
VOGL
DIFFERENTIAL FERTILITY Subsistence constraint, no goods cost
Demand for children (n)
Demand for children (n)
Goods cost, no subsistence constraint
371
Parental human capital (H)
~ c/αw
Parental human capital (H)
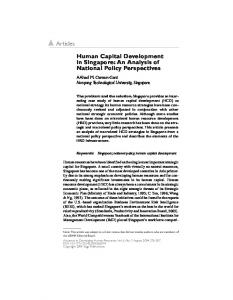
Figure 1 Changes in the optimal fertility schedule as the return to child investment increases. Notes: Assumes that κ 0; at high human capital levels, it decreases with human capital if the goods cost is smaller than the ratio θ0 /θ1 . The same hump shape holds for income. Thus, this framework, based on homogenous preferences but heterogeneous initial skill, generates a skill-fertility profile similar to that in Galor and Moav’s (2002) model, which combines preference heterogeneity with a subsistence constraint. One can glean insight into the importance of goods costs vis-à-vis subsistence constraints by studying the response of the skill-fertility profile to an increase in the return to child investment. Rising skill returns are crucial to many economic models of the demographic transition, so this comparative static is key.15 Figure 1 depicts how the relationship between parental human capital and fertility changes after successive increases in the return to child investment (θ1 ). The two panels reveal how the framework’s predictions depend on whether the hump shape is driven by a goods cost of children or a subsistence constraint. In the left panel, which assumes a positive goods cost of children but no subsistence constraint, increases in θ1 shift the peak of the hump shape downward and to the left. Fertility falls among parents that are at an interior solution, � falls, more parents switch from a corner solution to an interior solution. In the right and as H panel, which assumes a subsistence constraint but no goods cost, increases in θ1 still depress unconstrained parents’ fertility but have no systematic effect on the location of the peak. Malthus (1826) posited that total output growth causes population growth, leading many authors to refer to a positive aggregate income-fertility link as “Malthusian” (Galor, 2011). One can reasonably extend this reasoning to view a positive cross-sectional association between parental resources and fertility as Malthusian. Two mechanisms are likely to shift a population from such a Malthusian regime to a modern fertility regime with a negative association. First, the distribution of full income (wH) could shift to the right, over the peak of the hump, because of rising wages or parental human capital. In this case, broad-based gains in living standards would tend to flip the association from positive to negative. Second, an increase in the return to child investment could shift the peak of the hump to the left, flipping the association even without rising incomes. This second mechanism is unambiguous only under a goods cost of children. The 15. Taking a broad view of the skill returns, this statement applies to Becker et al. (1990), Dahan and Tsiddon (1998), Morand (1999), Galor and Weil (1996, 2000), Galor and Moav (2002), Doepke and Zilibotti (2005), Hazan and Berdugo (2002), Kalemli-Ozcan (2002), and Soares (2005), among others.
[15:28 16/12/2015 rdv026_print.tex]
RESTUD: The Review of Economic Studies
Page: 371
365–401
372
REVIEW OF ECONOMIC STUDIES
∗ profile non-parametrically empirical work sheds light on these mechanisms by estimating the nH and by analysing the aggregate determinants of changing socio-economic patterns in fertility.
2.3. Aggregate implications To characterize the effect of differential fertility on average human capital, I consider a counterfactual in which fertility is exogenously fixed at n˜ children.16 Under this level of exogenous fertility, parents with human capital H invest in their children as follows:
˜ enH =
⎧ ⎪ ⎪ ⎪ 0 ⎪ ⎪ ⎪ ⎨
κ n˜ +
θ0 ˜ θ n
if H < w(1−τ n˜ ) 1 � � 1−α � � θ
1+ α β c˜ +κ n˜ − θ0 n˜ θ0 α 1 if β−αβ θ1 n˜ ≤ H < w(1−τ n˜ )
� � � � � θ
wH −κ − nc˜˜ ⎪ ⎪ �� � � ⎪ ⎪ (β−αβ) n1˜ −τ wH−κ −αθ0 /θ1 ⎪ ⎪ ⎩ α+β−αβ 1 n˜ −τ
α β−αβ
if H ≥ max
κ n˜ +
α β−αβ
w(1−τ n˜ )
0˜ θ1 n
,
1+
θ
β c˜ +κ n˜ − θ0 n˜ 1 w(1−τ n˜ )
1−α α
� .
(2.5) The lowest-skill parents choose a corner solution with no child investment, whereas parents with intermediate skill invest but may be constrained by their subsistence requirements. For the highest-skill parents, only the budget constraint binds. Here as before, optimal child investment weakly increases in parental human capital. And consistent with a quality–quantity tradeoff, child investment decreases in n˜ when it is not at a corner solution. The total effect of differential fertility is the difference in average human capital between endogenous and exogenous fertility: 8 � ∗� ∗ �
h eH nH dF(H) ˜ 8 �tot (F, n˜ ) = − h enH dF(H). ∗ dF(H) nH
(2.6)
On the right-hand side of the equation, the first and second expressions equal average human capital under endogenous and exogenous fertility, respectively. To average across children rather than families, the first expression reweights the parental human capital distribution by the factor n E[n] . The second does not because all families have the same fertility. The difference between these averages depends on the reweighting of the population and any change in investment behaviour. In fact, one can decompose �tot (F,8n˜ )�into� quantities that reflect these two margins. To obtain this decomposition, add and subtract h e∗H dF(H), average human capital across families, to the right-hand side of Equation (2.6): �tot (F, n˜ ) =
� 9
8
� �
� � � � � ∗ ˜ h eH dF(H) + h e∗H −h enH dF(H), :; < 9 :;
max c˜ , H αw
with parental human capital across the entire support of F, then �comp (F) is unambiguously negative. These results suggest that in the early stages of economic development—when most are subsistence constrained or at an investment corner solution, but the wealthy few educate their children—the composition effect is positive. But with broad-based gains in living standards or increases in the return to child investment, the Malthusian fertility regime gives way to the modern fertility regime, and the composition effect turns negative. These composition effects are generally relevant for economic growth, but growth effects may be especially pronounced with particular human capital externalities. For instance, if aggregate human capital raises the productivity of the education sector, then the composition effects can generate endogenous growth. This type of externality finds support in recent evidence that the quality of schooling is as important as the quantity of schooling in explaining crosscountry variation in output per worker (Schoellman, 2012). If improvements in schooling quality raise θ1 without affecting θ0 , then higher aggregate human capital in one generation causes greater educational investment in the next. In the Malthusian era, the positive composition effects of differential fertility raise the return to child investment, speeding both economic growth and the transition to negative composition effects (due to rising skills and leftward � Once negative composition effects set in, differential fertility retards growth (as shifts in H). in De la Croix and Doepke, 2003). This potential role for differential fertility in the emergence (and subsequent moderation) of modern growth is similar to the mechanism in Galor and Moav’s (2002) model of evolution. 3. DATA ON TWO GENERATIONS OF SIBSHIPS Using data from the DHS, I construct two generations of sibships by viewing respondents as mothers and daughters. Conducted in over ninety countries, the DHS interviews nationallyrepresentative samples of women of childbearing age (usually 15–49 years). 3.1. DHS fertility histories The first set of analyses draws on the fertility histories, in which respondents list all of their children ever born, with information on survival. I use these data to study how fertility relates
[15:28 16/12/2015 rdv026_print.tex]
RESTUD: The Review of Economic Studies
Page: 373
365–401
374
REVIEW OF ECONOMIC STUDIES
to paternal education and household durable goods ownership, a proxy for household wealth or income. Each of these measures has benefits and drawbacks. Paternal education is attractive because it measures parental human capital and is determined largely before fertility decisions. But its connection to fertility may go beyond the mechanisms in the theoretical framework, and its connection to full income changes with the wage rate.17 Conversely, durable goods ownership provides a useful gauge of the household’s economic resources, although it is an imperfect income proxy and may be endogenous to fertility decisions. And as with paternal education, relative price changes may complicate comparisons of durable goods ownership over time. For a composite measure of durable goods ownership, I take the first principal component of a vector of ownership indicators for car, motorcycle, bicycle, refrigerator, television, and radio. This approach is similar to that of Filmer and Pritchett (2001), except that it does not incorporate measures of housing conditions (e.g. access to piped water), which may be communally determined. I perform the principal components analysis on the whole sample, so the resulting measure (which is standardized to have mean 0 and standard deviation 1) reflects the same quantity of durable goods in all countries and time periods. Three sample restrictions are worthy of note. First, to avoid the complicated task of disentangling cohort effects from changes in the timing of childbearing, I focus on women at least 45 years old and interpret their numbers of children as completed fertility. The focus on older women also has the advantage of capturing cohorts of mothers more likely to be in the early regime in which fertility is increasing in income and skill. Second, because I analyse paternal education, I include only ever-married women (who report their husbands’ education).18 Third, I compare results from two time periods, pre-1995 and post-2005, and only include countries with survey data (including the relevant variables) from both periods, leaving 58,680 ever-married women from forty-six surveys in twenty countries. Appendix Table 1 lists countries and survey years. 3.2. DHS sibling histories In some surveys, the DHS administers a sibling history module to collect data on adult mortality in settings with poor vital registration. The module asks respondents to list all children ever born to their mothers, with information on sex, year of birth, and year of death if no longer alive. In addition to adult mortality, the sibling histories offer a window into the sibling structure that adult women experienced as children. I relate this information to their educational attainment. Most DHS surveys with sibling histories are representative of all women of childbearing age, but a few (from Bangladesh, Indonesia, Jordan, and Nepal) include only ever-married women. From these surveys, I minimize concerns about selection by only including age groups in which the rate of ever marriage is at least 95%. As a result, I include women over 30 years from the relevant surveys in Bangladesh and Nepal, but I discard such surveys from Indonesia and Jordan, where marriage rates are lower.19 The analysis sample comprises eighty-three surveys from fortythree countries. To exclude respondents who have not finished schooling or whose mothers have
17. The choice of paternal education is meant to strengthen the link to the theory, not to diminish the role of maternal education. Even more than paternal education, maternal education may affect preferences, beliefs, and bargaining power, and, because of low rates of female labour force participation, its link with income and the opportunity cost of time is tenuous. Section 4.1 ends with a description of results for maternal education. 18. The durable goods results are similar for all women and for ever-married women. 19. The relevant surveys are the 2001 Bangladesh DHS; 1996 Nepal DHS; 1994, 1997, 2002, and 2007 Indonesia DHS; and 1997 Jordan DHS. Later surveys in Nepal and Indonesia included never-married women and are thus included in the analysis. I also discard data from the 1989 Bolivia DHS and the 1999 Nigeria DHS due to data irregularities.
[15:28 16/12/2015 rdv026_print.tex]
RESTUD: The Review of Economic Studies
Page: 374
365–401
VOGL
DIFFERENTIAL FERTILITY
375
not completed childbearing, I drop data on women less than 20 years old, leaving 845,594 women born between 1945 and 1989. Appendix Table 1 lists countries and survey years. 3.3. Supplementary surveys The DHS data are useful in their breadth but suffer from four shortcomings. First, they omit men, for whom the relationship between sibship size and education may be different. Second, they offer little information on the respondent’s childhood environment, such as her parents’ education. To supplement the DHS on these first two fronts, I draw on three surveys: the Indonesia Family Life Survey, the Matlab Health and Socioeconomic Survey, and the Mexico Family Life Survey. Third, DHS data do not include parental wages, complicating a direct mapping from the data to the theory. To fill this gap, I use an additional Indonesian dataset, the 1976 Indonesia Intercensal Population Survey. Fourth, the DHS do not include industrialized countries, so I use data from the US National Longitudinal Survey of Youth for comparison. 4. CHANGING CROSS-SECTIONAL FERTILITY PATTERNS This section investigates the evolution of differential fertility in developing countries since the 1940s. It begins with fertility history data, analysing the socioeconomic determinants of fertility, and then turns to sibling history data, analysing the association of sibship size with completed education. All analyses use sampling weights, but the results are similar without them.20 4.1. Fertility patterns by durable goods ownership and paternal education To assess the changing links between parental economic resources and fertility, I begin with a series of non-parametric estimations. Figures 2–3 show local linear regressions of completed fertility on measures of household economic resources, with accompanying kernel density estimates for the measures of economic resources. These estimations work together to illuminate the theory. The local linear regression estimates allow one to assess whether the resource–fertility relationship changes shape, while the kernel density estimates reveal whether the distribution of resources shifts underneath the relationship. Either phenomenon may flip the overall association of economic resources with fertility. Because individual surveys offer limited sample sizes of women over the age of 45 years, the figures pool countries in the same world region, on the premise that they have common economic fundamentals. Regions are ordered by increasing average paternal education. Figure 2 reveals pronounced variation in the relationship between durable goods ownership and fertility, both across regions and within regions over time. In the least educated region, West Africa, both ever-born and surviving fertility monotonically increase in durable goods ownership during the early period, but the relationships flatten and even become slightly negatively-sloped in the late period. In most other regions, the relationships are initially hump-shaped but then become everywhere negatively-sloped. One can interpret this disappearance of the hump-shape as a shift in its peak towards resource levels lower than the sample minimum, so these results are consistent with a rising return to investment in children. The relationship’s changing shape can alone flip the association of durable goods ownership with fertility, but such a flip would be bolstered by rising durable goods ownership in all regions, demonstrated by the kernel density
20. In the fertility history analyses, which pool multiple countries, the sampling weights are re-scaled to sum to national populations in 1990 (for the pre-1995 sample) and 2010 (for the post-2005 sample).
[15:28 16/12/2015 rdv026_print.tex]
RESTUD: The Review of Economic Studies
Page: 375
365–401
376
REVIEW OF ECONOMIC STUDIES Local linear regressions Caribbean
S/SE Asia
S America
4
6
8
10
E/S Africa
2
Number of children
W Africa
−1
0
1
2
3 −1
0
1
2
3 −1
0
1
2
3 −1
0
1
2
3 −1
0
1
2
3
Durable goods index Surviving, pre−1995
Surviving, post−2005
Ever−born, pre−1995
Ever−born, post−2005
Kernel densities E/S Africa
Caribbean
S/SE Asia
S America
.4 .2 0
Density
.6
W Africa
−1
0
1
2
3 −1
0
1
2
3 −1
0
1
2
3 −1
0
1
2
3 −1
0
1
2
3
Durable goods index Pre−1995
Post−2005
Figure 2 Durable goods ownership and completed fertility, ever-married women 45–49 years. Notes: Regions are ordered by increasing average paternal education. Bandwidth is set to 0.5. Sample includes evermarried women in countries with a full durable goods module in both the early and late periods. Local linear regression sample (but not kernel density sample) omits the top 1% of the region/period-specific durable goods index distribution. The durable goods index is the first principal component of a vector of ownership indicators for car, motorcycle, bicycle, refrigerator, television, and radio. Data source: DHS Fertility Histories
estimates. That is to say, even if the relationship had remained hump-shaped, changes in the distribution of durable goods ownership would have alone made the association more negative. Nevertheless, changes in functional form would likely be the main driver of a reversal in the association of economic resources and fertility. Similar patterns appear in Figure 3, which plots the relationship between paternal education and fertility. In the less-educated regions (Africa and the Caribbean), the relationship is initially hump-shaped but then turns negative; in Asia and South America, it is always negative. As with the distribution of durable goods ownership, the distribution of husband’s education shifts to the right in all regions between the early and late periods. So here again, changes in both functional form and the distribution of the independent variable may promote a flip in the association of paternal education and fertility. Thus, consistent with a rising return to child investment, all regions exhibit downward and leftward shifts in the peaks of the relationships between economic resources and fertility. A concern for this interpretation is that the relative prices of parental skill and of durable goods changed between the early and late periods. But the relative prices of these variables probably moved in opposite directions. On the one hand, cheaper consumer durables would imply that parents with a given level of durables ownership are poorer, making them more likely to be on the increasing segment of the hump shape. On the other hand, increased returns to skill
[15:28 16/12/2015 rdv026_print.tex]
RESTUD: The Review of Economic Studies
Page: 376
365–401
VOGL
DIFFERENTIAL FERTILITY
377
Local linear regressions Caribbean
S/SE Asia
S America
4
6
8
E/S Africa
2
Number of children
W Africa
0
5
10
15
20 0
5
10
15
20 0
5
10
15
20 0
5
10
15
20 0
5
10
15
20
Husband’s education Surviving, pre−1995
Surviving, post−2005
Ever−born, pre−1995
Ever−born, post−2005
Kernel densities E/S Africa
Caribbean
S/SE Asia
S America
.05 0
Density
.1
W Africa
0
5
10
15
20 0
5
10
15
20 0
5
10
15
20 0
5
10
15
20 0
5
10
15
20
Husband’s education Pre−1995
Post−2005
Figure 3 Paternal education and completed fertility, ever-married women 45–49 years. Notes: Regions are ordered by increasing average paternal education. Bandwidth is set to 3. Sample includes ever-married women in countries with a full durable goods module in both the early and late periods. Local linear regression sample (but not kernel density sample) omits the top 1% of the region/period-specific paternal education distribution. Data source: DHS Fertility Histories
would tend to move parents of a given skill level towards the declining segment of the hump shape. Both variables point to similar patterns, mitigating concerns about the confounding role of prices. In both figures, changing functional forms are evident for both ever-born fertility and surviving fertility. Which of these measures provides a better representation of the demand for children depends on the extent to which parents target surviving fertility. Given that fertility at ages 45–49 years reflects sequential childbearing decisions and deaths over three decades, it seems reasonable to interpret surviving fertility as a closer proxy for the demand for children.21 Moreover, only surviving fertility is relevant for the composition effects estimated in Section 6; children who do not survive to adulthood do not affect the next generation’s skill distribution. For conciseness, the remaining analyses focus on counts of surviving children only. To quantify these changes in functional form and assess their statistical significance, Tables 1–2 fit ordinary least squares (OLS) regressions of surviving fertility on the measures of parental economic resources. The top panel of each table reports a linear specification to summarize whether, on average, better-off parents exhibit higher or lower fertility. To address
21. Empirical research finds that parents “replace” deceased children rapidly (Ben-Porath, 1976), while theoretical work suggests that single-period models of the demand for children have similar quantitative implications to sequential models with child mortality (Doepke, 2005).
[15:28 16/12/2015 rdv026_print.tex]
RESTUD: The Review of Economic Studies
Page: 377
365–401
[15:28 16/12/2015 rdv026_print.tex]
RESTUD: The Review of Economic Studies
−0.6 5.0 2,772
0.46 [0.16]∗ −0.23 [0.11]∗ 1.01 [0.50]∗
0.43 [0.15]∗
0.035 −0.1 5.2 8,247
−0.042 [0.054] −0.14 [0.04]∗ −0.15 [0.23]
−0.124 [0.046]∗ 0.0004
−0.8 5.9 2,777
0.01 [0.09] −0.72 [0.09]∗ 0.01 [0.06]
0.004 [0.102]
0.013 −0.5 5.3 4,885
−0.54 [0.07]∗ −0.17 [0.06]∗ −1.60 [0.65]
−0.60 [0.07]∗