Jul 18, 2015 - shown to have a limited role in defining a cancer cure within the first 5 years after radiotherapy because, even though a lower PSA nadir after ...
TJ
Tumori 2015; 00(00): 000-000 DOI: 10.5301/tj.5000415
ISSN 0300-8916
Original Research Article
Diffusion-weighted magnetic resonance imaging in patients with prostate cancer treated with radiotherapy Giancarlo Iannelli1,*, Rocchina Caivano1,*, Luciana Rago1, Vittorio Simeon1, Antonella Lotumolo1, Paola Rabasco1, Antonio Villonio1, Matilde Gioioso1, Pietro Mastrangelo1, Flavio Barchetti2, Valeria Panebianco2, Luca Macarini3, Giuseppe Guglielmi3,4, Aldo Cammarota1 Radiology Department, IRCCS-CROB, Rionero, Vulture - Italy Department of Radiological Sciences, Oncology and Pathology, Prostate Unit Diagnostic University of Rome, “La Sapienza,” Rome - Italy 3 Department of Radiology, University of Foggia, Foggia - Italy 4 Department of Radiology, Scientific Institute Hospital “Casa Sollievo della Sofferenza,” San Giovanni Rotondo - Italy 1 2
*These authors contributed equally to this work.
Abstract Aims: To evaluate the utility of a multiparametric 3T magnetic resonance imaging (MRI) study using diffusionweighted images (DWI) for the assessment of prostate cancer before and after radiotherapy (RT). Methods: A total of 34 patients, who received a histologic diagnosis of prostate adenocarcinoma, underwent MRI examination before and after local RT for the assessment of response to treatment. Apparent diffusion coefficient (ADC) values were calculated and compared. Results: Before RT, DWI shows pathologic restriction of signal, while after RT pathologic restriction of signal was reduced or disappeared. The ADC values were significantly increased after therapy (p70 Gy, at 2 Gy/fraction) to the prostate only or to the prostate and seminal vesicles (Tab. II).
Total patients
Volumes Prostate
Prostate + vescicles
Doses, Gy
Low risk
24
16
8
76
Intermediate risk
10
-
10
78
Low risk is defined as prostate-specific antigen (PSA) less than or equal to 10, Gleason score less than or equal to 6, and clinical stage T1-2a. Intermediate risk is defined as PSA between 10 and 20, Gleason score 7, or clinical stage T2b.
MRI technique All MRIs were acquired with a 3T field strength scanner (Philips Intera Achieva, Best, Netherlands) equipped with gradients of amplitude and maximum slew rate, respectively, of 80 mT/m and 200 mT/m/ms, using the body coil for transmission of pulse excitation and a phased-array coil, consisting of 2 circular elements of maximum diameter of 19 cm (Flex-M) positioned opposite each other. The DWI axial images were performed in addition to the standard protocol. For each patient, examination protocol included turbo spin-echo sequences, T2-weighted images, axial T1-weighted turbo spinecho images before and after contrast injection, and DWI sequences. T2-weighted spin-echo sequences were obtained in 3 orthogonal planes (axial, sagittal, and coronal). The scanning parameters of T2-weighted images were as follows: repetition time (TR) 3304, echo time (TE) 90 ms, slice thickness 3 mm, matrix 250 × 221, slice number 22, field of view (FOV): anterior-to-posterior (AP) 18 cm, right-to-left direction (RL) 18 cm, foot-to-head direction (FH) 7.2 cm, interslice gap 0.3-1 mm, and acquisition time of 4 minutes and 30 seconds. Scan parameters for T1-weighted images were as follows: TR/ TE 10/23, slice thickness 7 mm, matrix 252, FOV: RL 375, AP 299, FH 199, interslice gap 1, and slice number 22. T2-weighted images were used as a reference to determine the morphologic and anatomical area to be biopsied, and to identify areas of altered signal to be evaluated by DWI. The scanning parameters of T1-weighted images before and after contrast are as follows: TR 3.0, TE 1.42, matrix 252 × 198, FOV: RL 375, AP 299, FH 150, slice number 100. The DWI images were acquired in the axial plane using single-shot technique, and attention was paid to the echoplanar values b0, b350, and b700. The scanning parameters were as follows: TR 4618, TE 51, FOV: RL 22 cm, AP 22 cm, FH 5.9 cm, slice thickness 3 mm, slice number 28, 96 × 88 matrix, gap 0.3 mm, flip angle 90, fold-over direction AP, and epi factor 49. The value of b700 was considered optimal on the basis of experimental tests performed at our institution and on the basis of literature data, although some studies (17, 18) showed that DWI-MRI images at b values of 0, 2000 s/mm2 had significantly higher lesion conspicuity of prostate cancer than those at b values of 0, 1000 s/mm2, while lesion conspicuity of ADC maps between b values of 0, 1000 s/mm2 and b values of 0, 2000 s/mm2 was equivalent (19). This may be because higher b values provide increased diffusion weighting and diminished T2 shine-through (20, 21). © 2015 INTM, Italy. Published by Wichtig Publishing
Iannelli et al
3
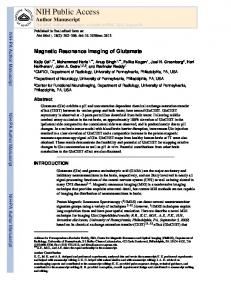
Diffusion gradients were applied to values of b0 and b700 s/mm2 along the 3 orthogonal planes. The ADC was automatically reconstructed on a pixel-by-pixel basis (0 and 700 s/mm2). The DWI acquisition time was 4 minutes and 48 seconds and the duration of the protocol was about 40 minutes. Biopsy information A urologist with 13 years of experience in prostate biopsy obtained a total of 12 specimens (8 from the peripheral zone, 4 from the transition zone) from each patient during TRUSguided systematic prostate biopsy. The transverse, longitudinal, and lateral locations of the prostate biopsy were described by the urologist who performed the biopsy as right or left side of gland; base of gland, mid gland, or apex of gland; and medial, central, or lateral, respectively, to help determine the biopsy locations on MRI. Localization of prostate cancer was determined by a consensus of the 2 readers based on a comparison of the digital rectal examination findings, the histopathologic findings of the biopsies, and the MRI findings; for each patient, a lesion localized to a specific region of the prostate was considered in the MRI-DWI evaluation and particularly for ADC measurement before and after RT. Image analysis The DWI and ADC on MRI were analyzed by a consensus of 2 radiologists, with 7 and 12 years experience reading prostate MRI. The pretreatment MRI was evaluated after TRUS-guided prostate biopsy results. All sequences of the MRI examination were reviewed for each patient. The criteria for tumor visibility, in agreement with other studies (22), were focal hyperintensity on DWI and corresponding hypointensity on ADC maps relative to the rest of the prostate gland and at a site of biopsy-proven carcinoma. The T1- and T2-weighted sequences were reviewed only to confirm findings on other sequences. If an area of decreased signal intensity was detected on a T1- and T2-weighted image at a site of biopsy-proven carcinoma, it still did not meet criteria for tumor visibility if there was no corresponding restricted diffusion. The criterion for benign prostate tissue was absence of hyperintensity on the DWI sequence and absence of hypointensity on T2-weighted images in the peripheral zone at a site of biopsy-proven benign tissue. Every ADC value was calculated on an ADC map, automatically constructed by using software provided by the MRI manufacturer (Philips Medical Systems) on the operating console with different gradient factors (b values of 0 and 700 s/mm2) through the use of a region of interest (ROI) (Fig. 1). Each ROI was oval and had an area of about 16 mm2. The ROIs were drawn manually by the reviewing radiologists on ADC maps in the center of each visible tumor and at sites of biopsy-proven benign tissue. The ROIs were drawn to encompass the largest area of prostate cancer or benign tissue without including the tumor margins, the prostate capsule, or the urethra. The ADC values were measured superimposing the ROI on the ADC map and generated automatically using the software © 2015 INTM, Italy. Published by Wichtig Publishing
Fig. 1 - Axial apparent diffusion coefficient map shows the region of interest in the area with restriction pathologic signal.
Functool (Philips Medical Systems). The radiologists calculated the ADC value twice and the mean value was considered. The ADC values obtained were registered and then compared with the ADC value obtained similarly and in the same region, using the MRI-DWI post-RT. The 34 patients had tumor mouths of transverse diameter >5 mm. The maximum transverse diameter of the tumor nodule was 1.5 cm to the DWI. Most of the lesions were in the peripheral part of the gland. The diagnostic criteria for the MRI posttreatment findings were as follows: a focal area that revealed low signal intensity on ADC maps; high signal intensity on DWI; early contrast enhancement with fast washout; and high permeability of blood vessels on dynamic contrast-enhanced images (23, 24). Statistical analysis Continuous variables were reported as means, standard deviations, medians, and range. Paired Student t test for parametric data was used to compare ADC values in terms of response to therapy according to MRI post-RT, associated with an absence of pathologic restriction of signal in DWI. Statistical correlation of ADC deviations with PSA and GS variations before and after RT have been studied with Pearson coefficient (r), calculated with Origin (6.1) software. The relative difference of ADC was assumed to be correlated with PSA and GS variations when the p value, obtained from r, was