Index Terms â Digital signal processors, Demodulation,. Interferometry, Optical signal processing, Pressure measurement, Remote sensing, Signal detection.
IEEE LTIMC 2004 – Lightwave Technologies in Instrumentation & Measurement Conference Palisades, New York, USA, 19 – 20 October 2004
Digital Signal Processing of Interferometric Fiber Optic Sensors Barry Griffin, Michael J. Connelly Optical Communications Research Group, Department of Electronic and Computer Engineering, University of Limerick, Limerick, Ireland Abstract — A data acquisition system, which interfaces to an interferometric fiber optic pressure sensor, is presented. This system transmits a modulated signal to the sensing interferometer, demodulates the returning interferometric signal by way of Digital Signal Processing, while simultaneously relaying control and signal data via PC based software. Index Terms — Digital signal processors, Demodulation, Interferometry, Optical signal processing, Pressure measurement, Remote sensing, Signal detection.
I. INTRODUCTION Fiber-based interferometry has been employed in the sensing of various physical phenomena for a number of years now. These phenomena include the sensing of pressure, strain, temperature, and flow [1]. Presented herewith is an approach to interferometric pressure sensing engaging the use of a Digital Signal Processor (DSP). The DSP is capable of modulating the laser transmitter and demodulating the photodetected signal, in addition to facilitating a process of duplex communication between the Acquisition Unit itself and a Windows PC application. The application aids the user in controlling the various parameters involved when obtaining the interferometric measurand signal. This software also permits the user to view and record time and spectral domain plots concerning the demodulation of the sensed signal. The system outlined in this paper is targeted primarily at industrial applications requiring the general purpose measurement of dynamic pressure, via fiber optic interferometic sensors; and in addition, lends itself as a generic design for more specific applications. Such applications might well involve sharing the processor with operations not pertinent to pressure sensing. At the crux of sensor-based interferometic detection systems, are the demodulation schemes they employ when converting the photodetected signal to a signal proportional to that being sensed. Demodulation schemes fall into two main categories, active and passive [2].
0-7803-8722-8/04/$20.00 ©2004 IEEE
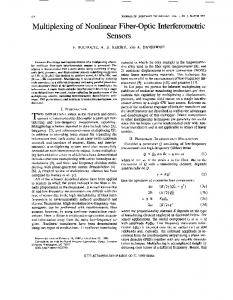
Active schemes, while more sensitive, require electrical feedback, negating one of the primary advantages associated with fiber sensors. Passive schemes are therefore more popular than their active counterpart, and for this reason the authors have decided to concentrate their design efforts on the former. In particular, we are investigating the Synthetic-Heterodyne demodulation technique [3]-[4]. From a commercial perspective, this system is attractive for three major reasons when compared with more traditional analog systems. The first reason is with respect to the flexibility provided by digital hardware, over analog. For example, if the demodulation or control algorithm requires a modification, this can be achieved by simply modifying the software, which runs on the DSP. It is also possible to select different demodulation algorithms depending on the type of sensor used, while under such circumstances, an analog design would require additional hardware. The second advantage relates to the fact that DSPs are now readily available in all sorts of environments. Again as an example, many aircraft now rely heavily on DSP processors for control and monitoring purposes. Therefore for such cases, it makes sense to fully utilize the available resources by opting for an acquisition method based around digital signal processing. The final advantage granted concerns integrating the primary function of obtaining the pressure signal, with the auxiliary functions of logging and control. Logging is handled by simply storing digital samples of the acquired signal in storage memory, while control is handled by augmenting the software to flag the required events. II. SYSTEM Fig. 1. outlines the various components and processes involved when sensing a pressure signal, and in presenting this signal to the user in an appropriate form. This diagram can be abstracted into three physical parts, the PC, the Acquisition Unit and the Sensor/Interferometer.
153
1 Analog Output
Codec
Laser
3
2
Pressure
Software Receiver
Circulator
DSP
PC Fig. 1.
Acquisition Unit
Sensor / Interferometer
System Overview.
applied to the photodetected signal. A 32bit floating-point processor, the Texas Instruments TMS320C6711, was chosen to serve as the motherboard for the Acquisition Unit. The PC and Acquisition Unit communicate with each other via a parallel port interface. With respect to the Synthetic-Heterodyne demodulation technique, this system is capable of demodulating signals with a maximum frequency of 4.41kHz. A correlation algorithm is employed by the DSP in order to synchronize the incoming modulated signal with the local oscillator signals employed by the detection scheme.
Generally, passive demodulation techniques require that the laser output is frequency modulated, usually via amplitude modulation of the laser drive current. To achieve this, a Digital-to-Analog Converter (DAC) interfaces to the laser driver, allowing the DSP to dictate the type of modulation applied, whether that be sine wave or saw-tooth modulation, etc. An Analog-to-Digital Converter (ADC) is also utilized in converting the photodetected signal to the digital domain. This digitalized signal is then demodulated by the DSP in order to extract the measurand signal. The laser is a Distributed Feedback (DFB) fiber laser, operating with a wavelength of 1550nm. A laser driver was selected to provide both a d.c. bias and a modulation current to the laser. This is accomplished by means of voltage to current conversion, applied to the laser driver voltage input. A clipper circuit between the DAC and the voltage input is also necessary in order to protect the laser from excessive currents. Mounting the laser on a copper block provides satisfactory temperature stabilization. A p-i-n photodiode is used in converting the returning lightwave signal from the interferometer to an electrical signal. The photodetector circuitry is concerned with the suitable amplification of this signal, and in insuring that capacitances within the circuit do not forward bias the photodiode at any stage of its operation. The Codec Daughterboard consists of two 16bit DACs and two 16bit ADCs, operating with a maximum sampling rate of 44.1kHz. The ADCs include an amplifier stage, which can be controlled by the DSP software in real-time. As a result, the user has the option, via the control software, of adjusting the amplification
III. SOFTWARE PC based software has been specially designed and written to assist the user in both the control of the acquisition system, as well as the display and storage of the measured signal. From a control perspective, the user selects a demodulation scheme and adjusts the parameters relating to this scheme to suit their particular application. These parameters, in the case of Synthetic-Heterodyning, include the frequency and depth of laser modulation, the amplification applied to the photodetected signal, the filter lengths, as well as the sensor transfer function, which relates the demodulated signal with the physical phenomenon under investigation. The user also has the option of saving the parametric settings to file. A number of demodulation schemes are currently covered, including Synthetic Heterodyne [3], Homodyne with Phase Generated Carrier [5] and Pseudo-Heterodyne [6].
154
Synthetic Heterodyne Demodulation File
E dit
V iew Control
Log S cale
Help
Modulation Frequency Modulation Depth Photodetector Amplification Transfer Function
Ctrl+F Ctrl+D Ctrl+A Ctrl+T
Detected Signal X-Axis Time in milliseconds 0 Y-Axis is Normalized Amplitude Peak amplitude 1.00
-1
0
1
2
3
4
5
0
5
10
15
20
0
441
0
2.21k
6
7
8
9
10
11
35
40
45
50
55
2646
3087
12
13
14
15
16
17
75
80
85
1
Demodulated Signal X-Axis Time in milliseconds 0 Y-Axis is Normalized Amplitude Peak amplitude 1.00
-1 882
1323
25 1764
30 2205
3528
3969
60
65
70
4410
1
Detected Spectrum Peak amplitude 0.65 Demodulated Spectrum Peak amplitude 1.00 X-Axis Frequency in Hertz Y-Axis is Normalized Amplitude 0
4.41k 6.62k
8.82k 11.03k 13.23k 15.44k 17.64k 19.85k 22.05k
Ready
Fig. 2.
Windows application, screen capture.
With regard to signal presentation, real-time plots of the interferometric signal, the demodulated signal, as well as the magnitude and phase spectra of the detected and demodulated signals, are available, as seen in Fig. 2. The user may also save a downsampled version of the demodulated signal to file for subsequent analysis. A downsampling factor of 5 is used.
Signal to Noise Ratio (dBs)
In addition, a low-finesse extrinsic Fabry-Perot cavity has been constructed. This sensor is illustrated in Fig. 4. and includes a reflecting mirror mounted on a piezoelectric cylinder, which moves in response to an applied voltage.
IV. EXPERIMENTAL RESULTS The system sensitivity has been established by considering the power spectral density of the demodulated signal, within its signal bandwidth. For the case in question, the latter is defined within the range of 44.1Hz to 4.41kHz, giving a signal bandwidth of 4.366kHz. The power spectral density is used to quantify the signal to noise ratio for various amplitudes of the measurand signal, as presented in Fig. 3. The sensitivity is in turn defined by the measurand signal that results in a signal to noise ratio of 0dB. This value was found to be approximately 10 µrads, giving a sensitivity of
1 × 10 −5 4366
= 0.5µrads / Hz .
50 40 30 20 10 0
-10
-4 -3 -5 π×10-1 π×10-2 π×10 π×10 π×10
Measurand Signal Amplitude (rads) Fig. 3. Signal to noise ratio of demodulated signal for various amplitudes of the measurand signal.
(1)
155
Collimator
Fiber
Fig. 4.
Collimated Beam
Cavity
Mirror
Power Amplifier 0 to 100Volts
Piezoelectric Cylinder
Fabry-Perot cavity.
would result in a decrease in quantization noise and therefore an increase in sensitivity. This system also has the potential to sense physical properties other than dynamic pressure.
The PZT is capable of inducing a maximum phase shift of π radians within the cavity, which corresponds to a displacement of 775nm. For experimental purposes, the PZT was driven at 10Volts, producing a phase shift of π/10 radians. The results are depicted in Fig. 5. below. The distortion of the demodulated signal is believed to result primarily from multiple reflections within the cavity.
VI. CONCLUSION We have designed and developed a digital interferometric sensor interrogation system and its associated software, which enables the user to configure a wide variety of demodulation schemes and also carry out sophisticated real-time analysis on the demodulated signal.
Detected Signal
ACKNOWLEDGEMENT Supported by Enterprise Ireland Research Innovation Fund, Project IF/2002/332N.
Demodulated Signal
REFERENCES
0
Fig. 5.
Time (ms)
[1] A. D. Kersey and A. Dandridge, “Applications of FiberOptic Sensors, IEEE Transactions on Components and Manufacturing Technology”, Vol. 13, No. 1, March 1990. [2] T.G. Giallorenzi, J.A. Bucaro, A. Dandridge, G.H. Siegel, J.H. Cole, “Optical Fiber Sensor Technology”, IEEE J. Quantum Electon., Vol. QE-18, No. 4, 1992. [3] J.A. Cole, B.A. Danver, J.A. Bucaro, “SyntheticHeterodyne Interferometric Demodulation”, IEEEJ. Quantum Electon., Vol. QE-18, No. 4, 1982. [4] M. J. Connelly, “Digital Synthetic-Heterodyne Interferometric Demodulation”, J. Opt. A: Pure Appl. Opt. 4, 2002. [5] A. Dandridge, A. B. Tveten, T.G. Giallorenzi, “Homodyne Demodulation Scheme for Fiber Optic Sensors with Phase Generated Carrier”, IEEE J. Quantum Electron., Vol. QE18. No. 4, 1982. [6] H. Sing, J.S. Sirkis, J. Andrews, “Evaluation of Integrated Optic modular-Based Detection Schemes for In-Line Fiber Etalon Sensors”, J. Lightwave Technol., Vol. LT-13, 1995.
10
Experimental results from DSP system.
V. FUTURE WORK Active demodulation schemes use control loops operating in a bandwidth close to d.c. To facilitate these schemes, it would be necessary to remove the d.c. coupling stages from both the ADCs and DACs. The current system is designed specifically for two-arm interferometers. An increase in the number of arms would require an increase in ADCs and DACs. A future design could include converters with a higher resolution than that currently available. Replacing the 16bit ADCs and DACs
156