Dimension Inference in Spreadsheets∗ Chris Chambers Oregon State University
[email protected]
Martin Erwig Oregon State University
[email protected]
Abstract
This latter aspect makes type checking approaches attractive since they promise mostly automatic error detection. Two immediate problems with type checking are that they are limited in the kinds of errors they find and that abstract typing concepts may be difficult to communicate to end users. The limited scope of type checking simply means that type systems should not intend to replace testing, but to complement it. That this can work very well has been demonstrated, for example, in [13]. The usability concern has been addressed in two different (although related) ways. First, based on the observation that spreadsheet users often place labels as comments into spreadsheets close to the relevant data, we can reason about the combination of these labels in formulas that refer to labeled data and thus detect inconsistencies [9, 6]. In a recent study on the usability of a type system in spreadsheets we discovered that end users can effectively use such label-based type systems to debug a variety of errors in their spreadsheets [5]. Second, we can employ units of measurements, or dimensions, as a concrete notion of types that is well known among end users [7]. Dimensions are used to characterize different kinds of values, much like traditional, more abstract, type systems used in general-purpose programming languages, but on a more fine-grained level. For example, a floating point number, which has just one type, can nevertheless represent different kinds of quantities, such as length or time values. In this paper we describe dimension inference, a method to automatically find dimension errors in spreadsheets. Our work builds on previous approaches and extends them in several important ways. First, through incorporating header inference [1], the presented system does not have to rely on additional user annotations and provides therefore a high degree of automation (“one-click checking”). Second, in addition to checking whether dimensions of values are correctly dealt with in formulas, our approach can infer dimensions based on context provided by formulas. This feature is particularly helpful in cases when header inference does not provide a detailed enough account of all the dimensions for all values in the spreadsheet. Dimension inference can then in many cases close the gap. Finally, the presented system can automatically infer conversion factors between different units of measurement (such as meters and feet) and can enforce the correct use of conversions in formulas. In addition to the formal model of dimension inference, we
We present a reasoning system for inferring dimension information in spreadsheets. This system can be used to check the consistency of spreadsheet formulas and can be employed to detect errors in spreadsheets. We have prototypically implemented the system as an add-in to Excel. In an evaluation of this implementation we were able to detect dimension errors in almost 50% of the investigated spreadsheets, which shows (i) that the system works reliably in practice and (ii) that dimension information can be well exploited to uncover errors in spreadsheets.
1. Introduction Spreadsheets are widely used [18] end-user programs that contain many errors [16] with a substantial negative impact on society [10]. To improve the quality of spreadsheets a variety of approaches to prevent, detect, and remove errors from spreadsheet have been investigated. Since preventive approaches, in principle, have to interfere with the spreadsheet creation process that makes spreadsheets so attractive to end users, much research has focused rather on the detection and removal of errors. The two major approaches to detect errors are testing/auditing and static (type) checking. For example, the “What You See Is What You Test” approach [17] that uses data-flow adequacy and coverage criteria to give the user feedback on how well tested the spreadsheet is. Test-case generation systems [12, 2] can support users in their testing efforts. However, a problem with testing is that is suffers from oracle mistakes (that is, incorrect decisions made by users during testing) [14]. Even though some of these problems can be alleviated by automating parts of the testing/debugging process [3], testing is also problematic because it requires substantial effort on part of the user, which poses a serious challenge since many of the spreadsheet users are end users who mainly want to get their job done and are much less motivated than professional software developers to spend additional time on their spreadsheets for testing purposes. ∗ This work is partially supported by the National Science Foundation under the grant ITR-0325273 and by the EUSES Consortium (http://EUSESconsortium.org).
1
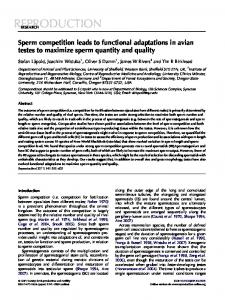
Figure 1. Example spreadsheet
describe a practical tool that has been implemented as an extension to Microsoft Excel. We also present an empirical analysis of how dimension inference works in practice. The rest of this paper is structured as follows. In Section 2 we illustrate the issues involved in dimension checking and inference with a small example. In Section 3 we formalize spreadsheets and a model of dimensions. We introduce in Section 4 a characterization of valid dimensions that is expected to be useful in practice to detect more errors. The process of dimension inference is then described in Section 5. In Section 6 we report on an evaluation of a prototypical implementation of a tool for dimension analysis. We discuss related work in Section 7 and give conclusions and ideas for future work in Section 8.
determining the dimension of a formula we can also infer dimensions for values whose dimension could not be determined from a label/header and is so far unknown. In the example, we see that C5 is subtracted from F2*60. Since all additive operations require that the arguments have the same dimension, we can conclude that F2*60 must be minutes, which is possible if the constant 60 has the dimension minutes/hour. In fact, only the value 60 has this dimension.1 In other words, any other factor (or no factor at all) would have caused a mistake in this formula. Since the dimension behavior of MAX is the same as that of other addition operators, we can infer that 0 and the whole expression MAX(F2*60-C5,0) also have the dimension minutes. Here we can observe that the ability to infer dimensions in arbitrary directions, that is, for arguments from results (instead of only being able to reason from arguments to results) is crucial for obtaining a flexible and user-friendly reasoning system, because requiring the user to annotate 0 with minutes and 60 with minutes/hour would mean a big impact on usability. The final two steps are to figure out the correct dimension for D5 so that the sum with B5 is dimension correct. Since B5 is in $, the product MAX(F2*60-C5,0)*D5 must have the same dimension. Since the MAX expression is in minutes, we can therefore conclude that D5 must have the dimension $/minute.
2. An Example Figure 1 shows a spreadsheet for computing costs of different phone plans for different companies and different usage profiles. The monthly totals for each plan and a particular hours-of-use value is computed by adding the base fee and the cost for the minutes exceeding the free minutes. For example, for the plan in row 5 and for the use of 25 hours, the formula in cell F5 is as follows. B5+MAX(F2*60-C5,0)*D5 By inspecting the labels in the spreadsheet we can see that the value in cell B5, 39, represents a money amount, which could be without further information given in any currency. It makes sense for a system to assume whatever currency is set to be the default, which we assume here to be $. Similarly, we can conclude that C5 is a time value. In this case there is no doubt about the unit, which is minutes. The same applies to F2, which contains an hour value. However, it is not clear at all what dimension the value in D5 has. Given (partial) information about the dimensions of values we can reason about formulas to find out the dimension of the computed value, or identify an error in case the formula combines dimensions incorrectly. In the course of
3. Spreadsheets and Dimensions We work with the following simple model of spreadsheets. A spreadsheet (S) is a mapping from addresses (a ∈ A) to expressions (e). We write S(a) to refer to the expression stored at address a in the spreadsheet S. Expressions can be values (v) or references to other cells (↑a), or are constructed using arithmetic (+ or ∗), aggregating (count), or conditional operators. e
::= v | ↑a | e + e | e ∗ e | count(e, . . . , e) | if(e, e, e)
1 Constants can have multiple dimensions, for example, 60 also has the dimension seconds/minute.
2
Here + and ∗ represent, respectively, a whole class of additive operators (including − and MAX) and multiplicative operators (including /). A dimension (d) is given by a set of dimension components (c). Each component is given by a base (b), a conversion factor ( f ), and an integer exponent (n). (We can view a dimension as a partial mapping from base dimensions to pairs (n, f ).) For the purpose of dimension inference, a dimension component can also be a dimension variable (δ). If a dimension contains only one component, it is called a singleton dimension, whereas a dimension that contains more than one component is called a composite dimension. The identity dimension {} is used for dimensionless values.
We have seen examples of conversion factors in Figure 1, namely min = time60 and hr = time3600 . We can also illustrate the effect of conversion variables using that example. The label “Base Fee” in cell B4 can be mapped to a dimension moneyφ , but it is not clear in which currency. If B4 were added in some formula to a value that is known to be of dimension $ = money1 or cent = money0.01 , the requirement of both arguments of addition to be of the same dimension would cause the unification of both dimensions and create the substitution {φ 7→ 1} or {φ 7→ 0.01}, respectively, and thus B4 would also receive the dimension $ or cent, respectively. Representing conversion by just a factor is not general enough to cover some conversions, such as degrees Fahrenheit to degrees Celsius. Nevertheless, we have chosen this simple model because it keeps the unification of dimensions feasible and works in most cases. This restriction is not too severe since in the spreadsheet repository that we have tested our prototype implementation on only 2 out of 487 spreadsheets contained dimensions that could not be converted using the presented model. The use of dimensions in computations effectively restricts the allowed computations in the sense of typing annotations. Consider the following definition of the semantics for addition.
::= {c, . . . , c} ::= bnf | δ
d c
For each base dimension we identify a default unit with factor 1. For example, the default for length is meter (m), that is, m = length11 , which also means that cm = length10.01 and ft = length10.3 . In general, the following relationship holds (where x is a dimensionless number and b is an arbitrary base). x bnf = x f bn1 We may also omit conversion factors and exponents of 1 for brevity, that is, we write more shortly bn for bn1 , b f for b1f , and simply b for b11 . In general, the choice of dimensions is arbitrary and depends on the application. For the task of analyzing dimensions in arbitrary spreadsheets, we have chosen the seven SI units and some further units that we have found in the EUSES spreadsheet corpus [11]. The quantities and their default units are shown in Table 1.
e1 −→ v1 e2 −→ v2 e1 + e2 −→ v1 + v2 When the semantics is based on values that are annotated with dimensions, the rule becomes the following. e1 −→ v1 : d e2 −→ v2 : d e1 + e2 −→ v1 + v2 : d
Table 1. Base dimensions with default units Quantity length mass time electric current temperature amount of substance luminous intensity money angle
This definition leaves the addition of expressions that evaluate to values with different dimensions undefined. Multiplication transforms the dimensions of values according to the function ./, which is defined as follows. First, d ./ d 0 is undefined if d and d 0 contain two dimension components with the same base b but different conversion factors, that is, bnf ∈ d ∧ bmf0 ∈ d 0 ∧ f 6= f 0 . Otherwise, we have
Default Unit meter (m) kilogram (kg) second (s) ampere (A) kelvin (K) mole (mol) candela (cd) dollar ($) degree (deg)
d ./ d 0 = {bn+m | bnf ∈ d ∧ bmf ∈ d 0 } ∪ d4d 0 f where the symmetric difference, d4d 0 , is defined as all the dimension components that are a variable or have a base that is in either d or d 0 , but not in both. The dimension-aware semantics for multiplication is then given by the following rule, which enforces the use of proper conversion factors in multiplications. For example, to calculate the distance a plane travels in 5 seconds when its speed is 950 km/hr, one has to use a conversion factor with dimension hr/s in the multiplication, otherwise ./ is
Examples of composite dimensions are speed, measured in m/s, which is {length, time−1 }, or force, measured in kg m/s2 , which is {mass, length, time−2 }. A conversion factor can be either a real number (r) or a conversion variable (φ), which serves as a placeholder to be used during dimension inference. f
::= r | φ 3
5. Dimension Analysis
undefined, and the rule cannot be applied. e1 −→ v1 : d1
The dimension analysis of a spreadsheet goes through the following four distinct steps. The last step applies only in those cases when the third step produces underspecified dimensions, that is, when it results in inferred dimensions that contain dimension variables.
e2 −→ v2 : d1 d1 ./ d2 = d e1 ∗ e2 −→ v1 ∗ v2 : d
The shown rules are a bit over-simplified because they ignore the notion of dimension validity discussed in the next section. The purpose of the rules was to show that incorporating a dimension concept into the semantics yields a more precise notion of what correct computations are, which forms the basis for an approach to identify errors based on dimension analysis.
1. 2. 3. 4.
In the following we will describe these four steps in some detail.
4. Dimension Validity Dimensions span a space, and values having a certain dimension can be regarded as points in this space. The traditional handling of dimensional values requires arguments of addition to have the same dimension, but places no constraints on the argument (or the result) dimension for multiplication. However, in practice dimensions cannot be multiplied arbitrarily. For example, no reasonable value can have the dimension kg3 . Ruling out such unreasonable dimensions can strengthen dimensional analysis by effectively placing a validity constraint on the multiplication of dimensional values, that is, the result dimension of a multiplication must be a valid dimension. It is an interesting scientific (or even philosophical) question what, in principle, is a valid dimension. Since we are not aware of any general rules that could be used to determine the validity of dimensions, we have taken a pragmatic approach and have gathered dimensions that have been reported and documented [15]. The set of the thus obtained dimensions is taken as a definition of the predicate V (d) that yields true if and only if d is a valid dimension. This predicate can be defined as a test of the exponents of all base dimensions occurring b R (b) in d with three exceptions. The length -3 .. 3 electric current -2 .. 1 allowed exponent ranges are time -3 .. 2 defined by the table shown to all others -1 .. 1 the right. The exceptions to this table are the valid dimensions (1) farads and (2) Siemens, captured by the following predicate.
E (d) = d = kg−1 m−2 s4 A2 ∨ d = kg−1 m−2 s3 A2
Header inference Label analysis Dimension inference Dimension instantiation
5.1 Header Inference Header inference analyzes the structure of a spreadsheet and returns a set of headers for each cell. A header is simply the address of another cell. Therefore, header inference produces a binary relation H ⊆ A × A such that (a, a0 ) ∈ H says that a0 is a header of a. In general, one cell can be a header for many cells, and any particular cell can have zero, one, or more headers. For example, in Figure 1 B4 is a header for B5, B6, B7, and B8, that is, H −1 (B4) = {B5, B6, B7, B8}, and A5 and B4 are headers of B5, that is, H(B5) = {A5, B4}. Header inference essentially works by analyzing the spatial relationships between different kinds of formulas. It can also take into account layout information. Techniques for header inference have been described in detail elsewhere [1, 4]. In the context of this paper we simply reuse those techniques. 5.2 Label Analysis In the second phase of dimension analysis we try to derive a dimension for each label contained in a cell that has been identified as a header by header inference. This process works by (a) splitting labels into separate words, (b) removing word inflections, (c) mapping word stems to dimensions, and (d) combining dimensions into one dimension. For example, cell C4 in Figure 1 is a header cell and therefore subject to label analysis. Its value can be split into the two words “Free” and “Minutes”, and the plural of “Minutes” can be removed. The resulting “Minute” can then be mapped to the dimension min. In contrast, “Free” cannot be mapped into any dimension and will thus be mapped to {}. Finally, the combination of both dimensions yields min. If no part of a header label can be mapped to a dimension other than {}, the label is mapped to a dimension variable δ, which indicates that the dimension is at this time unknown.
(1) (2)
With the definitions for R and E we can define the dimension validity predicate as follows.
V (d) = (∀bnf ∈ d.n ∈ R (b)) ∨ E (d)
5.3 Dimension Inference The third step of dimension analysis is dimension inference, which inspects each cell containing a formula and derives for it a dimension using a system of rules given in
This predicate is still only a crude approximation since it considers quite a few non-existing dimensions as valid, for example, kg m. Ultimately, the best approach to realize V might be to simply store a table of all valid dimensions. 4
A DDR H(a) = {a1 , a2 }
S(a1 ) ⇒ d1
S(a2 ) ⇒ d2
V (d)
d ∈ d1 ⊗ d2
H(a) = {a}
S, H ` a : d VAL S, H ` a : d
R EF S, H ` (a, S(a0 )) : d
S, H ` (a, e2 ) : {bnf2 } ∪ d S, H
M ULT S, H ` (a, e1 ) : d1
S, H ` (a, e2 ) : d2
H(a) = ∅ S, H ` a : δ
S, H ` a : d
S, H ` (a, ↑a0 ) : d
S, H ` (a, v) : d A DD S, H ` (a, e1 ) : {bnf1 } ∪ d
S(a) ⇒ d
S, H ` a : d
c1 = f1 / f
c2 = f2 / f
S, H ` a : {bnf } ∪ d
` (a, c1 ∗ e1 + c2 ∗ e2 ) : {bnf } ∪ d
d = d1 ./ d2
S, H ` (a, e1 ∗ e2 ) : d IF S, H ` (a, e2 ) : d
V (d)
S, H ` a : d
C OUNT S, H ` (a, ei ) : d
S, H ` a : {}
S, H ` (a, count(e1 , . . . , en )) : {} S, H ` (a, e3 ) : d
S, H ` a : d
S, H ` (a, if(e1 , e2 , e3 )) : d
Figure 2. Dimension inference rules rules given in Figure 2 formalize this process. Since a cell can have more than one header2 we have to define how to deal with the cases when both headers are identified as dimensions. Do we just take one dimension? If so, which one do we choose? Or shall we combine the dimensions somehow? As with the mapping of values to dimensions, the correct interpretation depends in many cases on the context, so that for the purpose of dimension inference it is best to principally allow all possibilities. We can realize this approach through the definition of a function that generates all possible dimensions that can be obtained from the combination of two3 dimensions.
Figure 2. Whenever the rule application fails, the formula for which no dimension could be inferred has been identified as erroneous. Moreover, derived dimensions that are not valid also indicate formula errors. Since the derived dimension can be the identity dimension {}, the system simply ignores (areas of) spreadsheets that do not involve any headers or identified dimensions, that is, dimension analysis works smoothly on any kind of spreadsheet and is not disruptive in cases it does not apply. Dimension inference is defined through the following three judgments that tie together dimensions inferred from headers/labels, known dimensions for conversion factors, and dimension transformations in expressions. Value dimensions. The judgment v ⇒ d says the value v, if used as a label or factor, describes the dimension d. This judgment combines the result of the label analysis process and prior knowledge of conversion factors, such as 60 ⇒ min/hr, 60 ⇒ s/min, or 100 ⇒ cm/m. Note that the judgment v ⇒ d is not a function, that is, one value can generally indicate different dimensions. This flexibility allows dimension inference to select the correct interpretation based on the context, that is, based on usage in formulas. Location dimensions. The judgment S, H ` a : d says the location given by address a has dimension d. This judgment combines the result of label analysis and header analysis into a judgment about the expected dimensions for cell locations. For example, in Figure 1 we have S, H ` C5 : min. Cell dimensions. The judgment S, H ` (a, e) : d says the cell (a, e) in the spreadsheet S has the dimension d under the given header relationship H. For example, if S represents the spreadsheet shown in Figure 1 and H is the corresponding header relationship, then we obtain S, H ` (F5, B5+MAX(F2*60-C5,0)*D5) : $. How this result is obtained was explained informally in Section 2. The
d ⊗ d 0 = {d, d 0 , d ./ d 0 , d ./ d¯0 , d¯ ./ d 0 } Here the operation d¯ computes the inverse of a dimension, which is obtained by negating all exponents in all components. n d¯ = {b−n f | b f ∈ d} Now we can provide the rules that define the dimension inference. Figure 2 shows the three rules for the location judgment covering the cases when a cell has two, one, or zero headers, and a rule for each possible expression to define the cell judgment. Note that a rule like A DD actually represents a whole class of rules covering the dimension inference for all “additive” operations (including -, MAX, SUM, etc.). Moreover, combinations of rules like A DD and C OUNT yield rules for correspondingly derived operations like AVG. 2 In practice, a cell has almost always at most two headers (row and column). This fact depends, however, on the method that is used for header inference. 3 Since we are working with a header inference that produces at most two headers for any cell, the restriction to considering only two dimensions is appropriate. It would not be difficult to extend the definition to an arbitrary number of headers.
5
We can observe the following four principal kinds of dimension rules. 1. 2. 3. 4.
in the computations. We expect a considerable number of spreadsheets to contain dimensions. RQ2: Does dimension inference run effectively on spreadsheets involving dimensions? For those spreadsheets that contain dimensions, we would like to know whether or not dimension inference runs correctly, that is, whether it can infer the proper dimensions for values and formulas and whether it can find errors based on inconsistent dimension use in formulas. RQ3: To what degree is dimension analysis dependent on the underlying header inference and label analysis? Header inference is the first step in dimension analysis. If this step fails to work properly, dimension analysis cannot take off. Following header inference, label inference is the crucial link that ties header information to dimension information. In general, label analysis is complicated by the fact that the process in inherently ambiguous. Anything that can improve header or label analysis has potentially a great impact on the applicability and accuracy of dimension analysis. RQ4: Does dimension validity matter? The concept of dimension validity was introduced to make the inference rule M ULT stronger so that more dimension errors can be detected. If this additional test helps in practice to detect dimension errors, we can refine the definition of V to make it even stronger.
Dimension generators (VAL and A DD) Dimension preservers (A DD, R EF, and I F) Dimension composers (M ULT) Dimension consumers (C OUNT)
Consistency checks are contained in some form or another in all rules but R EF. The most restrictive rules are I F and C OUNT since they require arguments to have the same dimensions. A little less restrictive is the rule A DD that requires its arguments to have the same base, but allows for differences in the conversion factors as long as the arguments are scaled accordingly. Effectively, all conversions between dimensions happen within the rule A DD. Rule M ULT is least restrictive since it allows the multiplication of any quantities as long as the result is a valid dimension. 5.4
Dimension Instantiation
An inferred dimension might contain dimension variables and/or conversion-factor variables. The occurrence of variables happens whenever the spreadsheet doesn’t provide enough information to precisely narrow down the dimensions. In these cases we have to find substitutions for the variables to obtain proper dimensions. In fact, a dimension involving variables describes a whole class of possible dimensions. For example, lengthφ can be m, cm, or any other length dimension that can be obtained by substituting values for φ. Similarly, the dimension {m, δ} can be instantiated to velocity or acceleration using the substitution {δ 7→ s−1 } or {δ 7→ s−2 }, respectively. The instantiation of dimensions can be realized by generating substitutions for conversion-factor variables so that default dimensions are obtained and by generating substitutions for dimension variables that produce valid dimensions (as defined in Section 4). Of those valid dimensions we can then select the one that is most common (as indicated by the numbers to be reported in Section 6).
6.1
Experiments
To answer RQ1 we have employed the EUSES spreadsheet corpus [11], which currently contains 4498 spreadsheets collected from various sources. Dimension analysis is relevant only for those 1977 spreadsheets containing formulas. We ran label analysis on those spreadsheets to find which dimensions occur how often. To investigate RQ2 and RQ3 we ran our tool on a subset of 40 spreadsheets randomly selected from the 1977 spreadsheets that contain formulas. We inspected all results, and in cases the header inference or label analysis was not working, we adjusted that information “by hand” and ran only the dimension inference part of the tool. To investigate RQ4 we have categorized the dimension errors that were reported according to which decision in the inference process led to their discovery.
6. Evaluation We have implemented a tool for performing automatic dimension analysis as an add-in to Microsoft Excel. This tool reuses the header analysis implementation [1] of the UCheck tool [4]. In this section we describe an evaluation of this dimension analysis system to answer the following research questions. RQ1: How wide-spread is the use/occurrence of dimensions in spreadsheets? Dimension inference can be an effective tool to check formulas and spot errors in spreadsheet computations, but only if those computations involve dimensions, or, to be more precise, if the tool can identify the dimensions involved
6.2
Results
The occurrence of dimensions in the spreadsheets from the EUSES corpus containing formulas is detailed in Table 2, which shows the number of occurrences of dimensions in total and in different spreadsheets. Altogether dimensions were found in 487 spreadsheets, that is, in only 1/4th of the spreadsheets with formulas. This number is smaller than the total of 603 from Table 2 since several spreadsheets contain more than one type of dimension. 6
among the 1977 spreadsheets with formulas are over 700 grading spreadsheets, which have no dimensions at all. Label analysis and dimension inference worked very reliably. The weakest link in the chain of steps for dimension analysis was clearly the header inference, which is not too surprising since labeling practices vary widely across spreadsheets. The fact that dimension errors were found in almost half of the selected spreadsheets shows that dimension analysis is an effective tool for uncovering errors in spreadsheets. Even though we found two instances of an error that was due to the concept of invalid dimensions, the number of spreadsheets studied was too small to draw conclusions about the importance of this concept/feature.
Table 2. Occurrences of dimensions Quantity/ Dimension Money Time Length Mass $/hr Area Velocity Temperature kW Mole Luminous Intensity Total
Total 390 351 35 27 20 12 10 10 3 3 3 864
Occurrences In Spreadsheets 279 237 26 20 15 8 5 5 3 3 2 603
7. Related Work Most closely related to our work is the Xelda system [7] that is designed to check a spreadsheet for units of measurement, such as meters, grams, and seconds. Xelda requires the user to annotate the units for all of the cells in a spreadsheet. Note that this does not only include data cells, but also all formula cells. While analyzing a spreadsheet Xelda checks the annotated units against the results of formulas to insure correctness. The advantage of the Xelda approach is that it works well independently of the spreadsheet layout, whereas our approach depends on header and label analysis. On the other hand, Xelda’s disadvantage is the huge amount of extra work required by the user whereas our approach is fully automatic. Moreover, Xelda cannot infer conversion factors. UCheck [4] was designed to check for units in a spreadsheet, and as such it does not handle dimensions. UCheck works by inferring headers for all the cells in a spreadsheet, based on the structure and content of the spreadsheet. Once these headers are inferred, the system derives units for the cells and checks for unit errors. While UCheck works completely automatically, some other related approaches require the user to annotate the spreadsheet with label information [9, 6]. The same advantages and disadvantages that we have mentioned for Xelda apply here as well. SLATE [8] separates the unit from the object of measurement and defines semantics for spreadsheets so that the unit and the object of measurement are considered. In SLATE, every expression has three attributes: a value, a unit, and a label. The value is what is contained in a cell. Units, such as meters, kilograms, and seconds, capture information about the scale at which the measurement was taken and the dimensions of the measurement. The final attribute, labels, defines characteristics of the objects of measurement. For example, a cell referring to 25 pounds of apples might read “25 lbs. (apples)”. Like Xelda, this system requires the user to annotate the spreadsheet before the analysis can begin.
We found that certain headers were more prevalent than others and had a greater impact. For example, for the quantity money, the two most common results were “Dollars” and “Money”, with 201 and 159 occurrences, respectively. For the quantity time, the results were distributed more evenly, with the most common, “Year”, occurring 91 times and the least common, “Month”, occurring 28 times. Header inference was able to infer the correct header information in 30 of the 40 cases. In the 10 other cases headers were placed too distant of the data they were labeling, in some cases having other unrelated data in between the headers and the data. Label analysis worked correctly in all cases. To take the limitations of header inference out of the analysis of dimension inference, we have altered those 10 spreadsheets so that dimension inference could start with proper header information. Dimension inference was then successfully run on all spreadsheets and was able to map 222 headers into 188 singleton and 34 composite dimensions. The tool detected 21 dimension errors in 17 of the 40 spreadsheets. To verify these errors, the spreadsheets were manually inspected, leading to the discovery of three false positives (caused by the label analysis) and zero false negatives. Of the 18 correctly identified dimension errors, 2 were invalid dimensions ($2 in both cases), and 1 error was detected in an if formula, and the remaining 15 errors were all due to violations of the rule A DD. The found 18 different errors had, due to copies in several rows/columns, altogether 105 error instances. 6.3
Discussion
We were initially surprised by the overall low occurrence rate of dimensions in spreadsheets, but we later found by inspecting spreadsheets containing formulas that had no dimension that this result is largely due to the kind of spreadsheets that are collected in the repository. For example, 7
This annotation involves adding the units and labels to all cells containing no references to other cells. The system then analyzes the cells with formulas containing references and determines the unit and label for these cells.
[3] R. Abraham and M. Erwig. GoalDebug: A Spreadsheet Debugger for End Users. In 29th IEEE Int. Conf. on Software Engineering, pages 251–260, 2007. [4] R. Abraham and M. Erwig. UCheck: A Spreadsheet Unit Checker for End Users. Journal of Visual Languages and Computing, 18(1):71–95, 2007. [5] R. Abraham, M. Erwig, and S. Andrew. A Type System Based on End-User Vocabulary. In IEEE Int. Symp. on Visual Languages and Human-Centric Computing, pages 215– 222, 2007. [6] Y. Ahmad, T. Antoniu, S. Goldwater, and S. Krishnamurthi. A Type System for Statically Detecting Spreadsheet Errors. In 18th IEEE Int. Conf. on Automated Software Engineering, pages 174–183, 2003. [7] T. Antoniu, P. A. Steckler, S. Krishnamurthi, E. Neuwirth, and M. Felleisen. Validating the Unit Correctness of Spreadsheet Programs. In 26th IEEE Int. Conf. on Software Engineering, pages 439–448, 2004. [8] M. J. Coblenz, A. J. Ko, and B. A. Myers. Using Objects of Measurement to Detect Spreadsheet Errors. In IEEE Symp. on Visual Languages and Human-Centric Computing, pages 314–316, 2005. [9] M. Erwig and M. M. Burnett. Adding Apples and Oranges. In 4th Int. Symp. on Practical Aspects of Declarative Languages, LNCS 2257, pages 173–191, 2002. [10] EuSpRIG. European Spreadsheet Risks Interest Group. http://www.eusprig.org/. [11] M. Fisher and G. Rothermel. The EUSES Spreadsheet Corpus: A Shared Resource for Supporting Experimentation with Spreadsheet Dependability Mechanism. In 1st Workshop on End-User Software Engineering, pages 47–51, 2005. [12] M. Fisher II, M. Cao, G. Rothermel, C. Cook, and M. M. Burnett. Automated Test Case Generation for Spreadsheets. In 24th IEEE Int. Conf. on Software Engineering, pages 141–151, 2002. [13] J. Lawrence, R. Abraham, M. M. Burnett, and M. Erwig. Sharing Reasoning about Faults in Spreadsheets: An Empirical Study. In IEEE Int. Symp. on Visual Languages and Human-Centric Computing, pages 35–42, 2006. [14] A. Phalgune, C. Kissinger, M. Burnett, C. Cook, L. Beckwith, and J. Ruthruff. Garbage In, Garbage Out? An Empirical Look at Oracle Mistakes by End-User Programmers. In IEEE Int. Symp. on Visual Languages and Human-Centric Computing, pages 45–52, 2005. [15] R. Rowlett. A Dictionary of Units of Measurement, July 2005. http://www.unc.edu/~rowlett/units/ index.html. [16] K. Rajalingham, D. Chadwick, B. Knight, and D. Edwards. Quality Control in Spreadsheets: A Software EngineeringBased Approach to Spreadsheet Development. In 33rd Hawaii Int. Conf. on System Sciences, pages 1–9, 2000. [17] G. Rothermel, M. M. Burnett, L. Li, C. DuPuis, and A. Sheretov. A Methodology for Testing Spreadsheets. ACM Transactions on Software Engineering and Methodology, pages 110–147, 2001. [18] C. Scaffidi, M. Shaw, and B. Myers. Estimating the Numbers of End Users and End User Programmers. In IEEE Symp. on Visual Languages and Human-Centric Computing, pages 207–214, 2005.
8. Conclusions and Future Work We have introduced a system for inferring and checking dimensions in spreadsheets. By interpreting headers as dimensions and relating those to formulas, the system can identify errors in formulas. This system differs from previous approaches in the following ways. • No user annotation required. The system can infer labels for cells automatically and use them to determine what the dimension is. • Dimension inference. The system even works well in situations when only partial label/dimension information is given since constraints can also be propagated upstream of computations. This aspect contributes to flexibility and robustness. • Conversion factors allow different units of measurement. Some formulas in a spreadsheet require conversion of quantities whenever non-compatible dimensions, such as meters and feet, are involved in additive operations. The described rule system handles such conversions smoothly. • Dimension instantiation. As a consequence of dimension inference there are situations in which dimension variables remain unsolved at the end of the analysis. These “dimension templates” can be instantiated to the most likely dimensions expected. The evaluation has demonstrated that the system works well in practice and can detect errors in many cases. The evaluation has also revealed two promising directions for future research. First, we could improve the system with a more accurate header inference. Second, a combination of dimension inference with the purely label-based approaches as pursued by UCheck [4] or the system described in [6] could strengthen the reasoning of the system. To some degree this was already tried in the SLATE approach [8]. However, SLATE only transforms labels and dimensions and does not identify errors. Moreover, the fact that SLATE is a standalone spreadsheet system and cannot be integrated into Excel renders the approach currently impractical.
References [1] R. Abraham and M. Erwig. Header and Unit Inference for Spreadsheets Through Spatial Analyses. In IEEE Int. Symp. on Visual Languages and Human-Centric Computing, pages 165–172, 2004. [2] R. Abraham and M. Erwig. AutoTest: A Tool for Automatic Test Case Generation in Spreadsheets. In IEEE Int. Symp. on Visual Languages and Human-Centric Computing, pages 43–50, 2006.
8