Proceedings of the 18th International Symposium on Chironomidae - Fauna norvegica 2012 vol. 31: 137-149. ISSN: 1502-4873
Phenotypic and genetic variation within the Cricotopus sylvestris speciesgroup (Diptera, Chironomidae), across a Nearctic - Palaearctic gradient Susan E. Gresens1,2 Elisabeth Stur2 and Torbjørn Ekrem2 Gresens SE, Stur E, Ekrem T. 2012. Phenotypic and genetic variation within the Cricotopus sylvestris species-group (Diptera, Chironomidae), across a Nearctic - Palaearctic gradient. Fauna norvegica 31: 137-149. Intraspecific variation sometimes obscures species boundaries and makes identification of certain Chironomidae difficult. This is true for many species in the genus Cricotopus. We used DNA barcode data and multivariate statistical analyses to investigate which phenotypic characters in populations of the Cricotopus sylvestris species-group are useful for species identification. Specimens collected across a broad latitudinal range from the Southwest United States through subarctic Canada to northern Norway formed nine distinct barcode clusters. Body size of adult flies decreased by 51% from the northern to southernmost populations. Meristic characters in wings and legs were strongly related to overall body size, and related morphometric ratios were not species specific. Antennal ratio increased significantly with body size, thus limiting its value in species delimitation. Non-metric ordinations of setal and coloration pattern data were characteristic for most species in the sylvestris-group. DNA barcode data worked well in separating morphologically different populations, except for the case of C. (I.) sylvestris and C. (I.) trifasciatus, which were distinguished by ordination of color pattern, but not by barcoding data. These two species appeared closely related, and we conclude that sequence data from neutral nuclear markers will be necessary to determine if these are genetically distinct species, or whether there is merely a high level of environmental plasticity in pigmentation within this geographically widespread barcode cluster. doi: 10.5324/fn.v31i0.1417. Received: 2011-11-29. Accepted: 2012-07-09. Published on paper and online: 2012-10-17. Keywords: DNA barcoding, morphometrics, phenotypic plasticity, species delimitation, color pattern 1. Department of Biological Sciences, Towson University, 8000 York, Towson, MD 21252-0001, USA 2. Museum of Natural History and Archaeology, Norwegian University of Science and Technology, NO-7491, Trondheim, Norway Corresponding author: Susan E. Gresens E-mail:
[email protected]
Introduction The genus Cricotopus van der Wulp, 1874 is one of the largest in the Orthocladiinae, containing five subgenera, with species distributed across the globe (Cranston et al. 1989). Aquatic macrophytes and algae provide typical habitat for Cricotopus larvae: species of the genus are known to inhabit a wide range of water bodies, from pristine streams and brooks to eutrophic ponds and brackish estuaries (Hirvenoja 1973; Boesel 1983). Certain species may become so abundant in eutrophic waters that adult swarms can reach nuisance proportions (Spies 2000;
Hirabayashi et al. 2004). Species-level identification of adult Cricotopus is difficult because high levels of intraspecific variation lead to overlap in the values of morphological traits between species. This is particularly true for many mensural data; coloration and the pattern of setae on thorax and the abdominal tergites are therefore important for identification of Cricotopus species (Hirvenoja 1973). Within a species, however, pigmentation varies seasonally and geographically (LeSage & Harrison 1980; Boesel 1983; Oliver & Dillon 1988) and can potentially obscure otherwise good differences
137
Gresens, Stur and Ekrem: Variation in the Cricotopus sylvestris species-group
between species. Hirvenoja (1973) revised the genus Cricotopus for the western Palaearctic and his revision has become the main reference for further work on this genus. Within the subgenus Isocladius (Kieffer, 1909) he placed twelve species in the sylvestris species-group. Six of the Palaearctic sylvestris gr. species are also reported from the Nearctic (Poole & Gentili 1998). Although several Cricotopus species are regarded as Holarctic (Hirvenoja 1973), there could be some bias in identification of Nearctic species, because a translation (Simpson et al. 1983) of Hirvenoja’s (1973) keys are used in North America. Further taxonomic challenges in North American Cricotopus are a number of undescribed taxa (own observation) and the fact that certain populations seem particularly difficult to identify. For instance, Nearctic populations of C. (I.) sylvestris Fabricius, 1794 and C. (I.) trifasciatus Meigen, 1813 have proved difficult to distinguish, and there have been conflicting reports as to which species is more abundant in North America (LeSage & Harrison 1980, Boesel 1983). There has been debate over which Nearctic populations warrant species status: e.g., C. (I.) lebetis Sublette, 1964 was ultimately recognized as a Nearctic relative of C. (I.) tricinctus Meigen, 1818 (Epler et al. 2000), whereas C. (I.) remus Sublette, 1964 has been synonymized with C. (I.) trifasciatus (Boesel 1983). Cricotopus. (I.) flavibasis Malloch, 1915 and C. (I.) myriophylli Oliver, 1984, represent additional sylvestris gr. species, unique to the Nearctic (Boesel 1983; Oliver 1984). A combination of traits is used to distinguish adult males of the sylvestris species-group from the six other groups within the subgenus Isocladius. The superior volsella is always rounded and hump-shaped; the median setae form a single longitudinal row on the abdominal tergites, while the anterior transverse row of tergal setae is absent. On the tarsi, small pulvilli are visible, and light markings are usually present on the legs and abdomen. Within the sylvestris-group Hirvenoja (1973) used the size and abundance of tergal setae, the number of sensillae chaetica, and various morphometric ratios to distinguish species. While color pattern is the main criterion for identification of half of the species in this group, Hirvenoja also mentioned variation from light to dark-pigmented forms of C. (I.) sylvestris, C. (I.) trifasciatus, C. (I.) speciosus Goetghebuer, 1921 and C. (I.) tricinctus. In the extreme case, discrimination of dark forms of C. (I.) sylvestris from C. (I.) glacialis Edwards, 1922 may only be possible when adult females and pupal exuviae can be associated with adult males (Hirvenoja 1973). Phenotypic plasticity refers to the ability of environmental conditions to alter the expression of the genotype of an organism. Both temperature regime and food quality control size and growth rate of chironomids: larvae from colder habitats mature at larger size, on a given diet (Gresens 1997). Chironomid taxonomy has accounted for body size variation by expressing measurements of antenna, leg and wing structures in terms of morphometric ratios. Nevertheless, plasticity in body size raises the issue of allometry, wherein the relative
138
proportions of body parts change with body size. Allometry leads to differences in shape among large and small individuals of the same species, such that the values of morphometric ratios themselves change with body size (McKie & Cranston 2005). Allometric responses of morphometric ratios and shape of the hypopygium have been reported for several species of chironomids (Kobayashi 1998; McKie & Cranston 2005) and plasticity of pigmentation in response to temperature has also been demonstrated experimentally for several species of Conchapelopia Fittkau, 1957 (Kobayashi and Hayashi 2001). Our study focused on adult male specimens of the Cricotopus sylvestris species group, where the problems posed by allometry and phenotypic plasticity have not been addressed. Our goals were to determine how well species identifications based on phenotype corresponded to genetically defined populations and to identify which traits were most effective in distinguishing species within the C. Sylvestris-group. Our analysis emphasized multivariate analyses of traits that are not expressed as morphometric ratios: i.e., color pattern and distribution of thoracic and tergal setae. Given the potential for observing phenotypic plasticity in populations spanning a wide range of latitude and environmental conditions, it was crucial to have genetic data to define populations independent of phenotype. Thus we combined quantitative analyses of phenotype with DNA sequence data from the cytochrome c oxidase subunit 1 (COI) gene, (i.e., “DNA barcodes”) from specimens collected from sites across a broad geographic range, including the United States, Canada, Iceland and northern Norway. We sought to answer the following questions: 1) To what extent does allometry bias the values of measurement ratios across populations? 2) How useful are leg and wing ratios for distinguishing species within the C. sylvestris-group? 3) How well do multivariate analyses of setae and pigmentation data correspond to genetically distinct populations? 4) Which particular setal and pigment variables are most useful in distinguishing species of the C. sylvestris-group?
Methods Nucleotide sequence data was obtained for 64 specimens, including one C. Cricotopus cylindraceous gr. specimen which served as the outgroup. Tissue samples for barcoding consisted of 1-2 legs per specimen, preserved in 96% ethanol. Gene sequence data was provided by the Canadian Centre for DNA Barcoding, University of Guelph, according to their standard procedures for extraction, PCR and sequencing. Partial COI sequences and metadata for specimens are available through the Barcode of Life Datasystems (Ratnasingham & Hebert 2007). A taxon identification tree was constructed using MEGA 5 software (Tamura et al. 2011) employing the Neighbor-Joining method and 500 bootstrap replicates. Pairwise distances within the final COI dataset, consisting of 658 codon positions, were computed using the Kimura 2-parameter substitution model
Fauna norvegica 31: 137-149. 2012
(Kimura 1980) in MEGA 5. Phenotypic measurements were made on thirty eight cleared and slide mounted specimens. We calculated several of the morphometric ratios reported by Hirvenoja (1973). The length of femur, tibia and each tarsal segment (i.e., t1,…t5) were measured for fore-, mid- and hindleg. These lengths were used to calculate the following “leg ratios”: BV = (femur + tibia + t1) / (t2 + t3 + t4 + t5) LR = (t1/tibia) SV = (femur + tibia) / t1 The antennal ratio was calculated as: AR = (apical flagellomere) / (combined length of basal flagellomeres). McKie and Cranston (2005) reported wing length to be an accurate indicator of total body size in chironomids. Wing length was measured from arculus to wingtip. Two wing ratios (Hirvenoja 1973) were then calculated: VRC = (distance between R 2+3 and R4+5) / (distance from tip of R1 to tip of R4+5) VRCU = (distance from arculus to FCu) / (distance from arculus to RM). Three additional measurements were made to quantify wing shape: the distance from FCu to RM, the distance from FCu to the tip of R4+5, and the distance from FCu to the furthest extent of the anal lobe. The following groups of thoracic setae were quantified: dorsocentrals, antepronotals, acrostichals, prealars and scutellars. The pattern of setation of abdominal tergites 3 and 4 are important for discrimination of sylvestris gr. species. The number of medial and lateral setae on these tergites was recorded and the diameter of the medial setae relative to the laterals was classified as 0= medial and lateral of similar diameter, or 0.5 = medials slightly wider than laterals, 1 = medial setae clearly wider than laterals. The number of sensilla chaetica, appearing at 400 times magnification as a row of small depressed hooklets along the edge of t1 of the hindleg, was recorded. We devised a numerical scoring system to quantify patterns of pigmentation on the scutum, abdominal tergites and legs. This approach required a modest amount of simplification but it allowed us to capture major patterns and subject them to statistical analysis. Thoracic pigmentation was assigned several scores, on a scale from 0 (pale yellow exoskeleton, no pigmentation), to 5 (black, very dark pigmentation). Thoracic pigment scores were recorded for the anterior and posterior scutum, the humeral area, scutellum and postnotum. Areas that were darkened by uncleared musculature were avoided in the scoring process. Leg pigmentation scores included 0
(presence of a light ring contrasting sharply with brown color of segment), 1 (a pale brown ring on a darker brown ground), and 2 (no ring, segment uniformly pigmented). The femur, tibia and all tarsomeres of fore-, mid- and hind-leg received separate scores. Quantification of tergal pigmentation was most complex: the distribution of dark pigment was scored separately for abdominal tergites 1- 8, plus the anterior and posterior part of the hypopygium. In most cases, tergites exhibited a more-orless transverse band of pigment; therefore, the average locations of the anterior and posterior edges of this pigment band were recorded as the percent of distance back from the anterior of the tergite. For example, a brown pigment band extending from the anterior of a tergite to its midpoint would receive a score of 0 for its anterior margin and a score of 50 for its posterior margin The presence of different pigment patterns not resembling transverse bands was recorded as a separate variable, with a code number (0 to 10) for a particular pattern, e.g., 4 = two posterolateral spots, whereas 7 = one medial triangular spot. Thus each abdominal tergite received 3 pattern-variables. Multivariate statistics were initially used to distinguish variation in leg and wing measurements that were simply due to body size from independent variation in leg or wing shape, which might prove species-specific. Principal components analysis (PCA) was judged to be applicable given the distribution of variables; PCAs based on correlation matrices were applied separately to the leg and wing datasets. Significant principal component axes (PCs), which summarized independent aspects of morphological variation, were then subject to linear regression on wing length (i.e., surrogate for body size). Morphometric ratios were also regressed on wing length to detect any persistent allometry. Linear regressions were run on both raw data and on log-transformed data; these gave similar results. Although allometric relationships of body size and shape are typically nonlinear, the range of body size, although substantial in this study, was not large enough to detect the nonlinear component of the size-shape relationships. Regression diagnostics including the distribution of residuals from the regression model and the proportion of variance explained, R 2, showed that it was more accurate to report the regressions on raw data. Regressions were performed using Microsoft Excel® spreadsheet software. Both the setae and pigment datasets contained large numbers of variables with highly non-normal distributions. Variables that did not actually vary among specimens were removed from analysis. Setae and pigment datasets were analyzed separately because the difference in magnitude of their variables would have biased the results. Non-metric multidimensional scaling (NMDS) was used to determine which groups of variables (i.e., ordination axes) best distinguished genetically distinct populations. All multivariate statistical procedures were run using PC-ORD v. 5 software (McCune & Mefford 2006).
139
Gresens, Stur and Ekrem: Variation in the Cricotopus sylvestris species-group
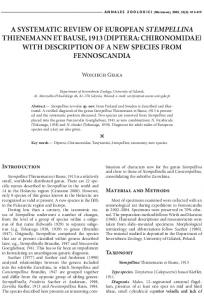
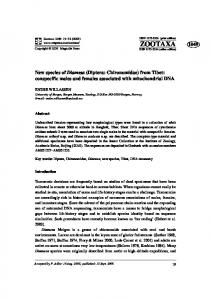
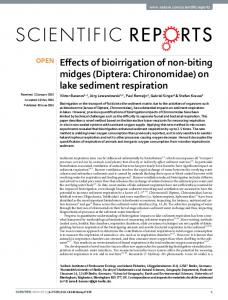
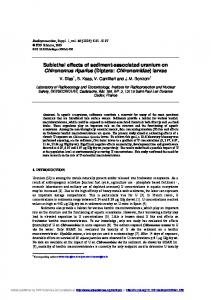
Results The taxon identification tree revealed nine genetically distinct populations, i.e., “barcode clusters” (Figure 1). Three barcode clusters closely matched Hirvenoja’s (1973) descriptions of C. (I.) ornatus (Meigen, 1818), C. (I.) tricinctus and C. (I.) glacialis, whereas the largest cluster contained diverse populations of both C. (I.) sylvestris and C. (I.) trifasciatus. The remaining five clusters were given provisional designations because they differed noticeably from Hirvenoja’s descriptions, based largely on material collected in Finland. Two of these populations were from Finnmark, Norway: Cricotopus (I.) sp. 3, which resembled C. (I.) pilitarsis, and C. (I.) sp. 5 which did not clearly resemble any described species. The three Canadian populations included C. (I.) sp. 4, in the sylvestris-group, plus C. (I.) sp. 6 and C. (I.) sp. 7, which were both close to C. (I.) ornatus, although they differed from each other in the length of setae and intensity of pigmentation. Given the range of body size represented, allometry should have been observed if present. Wing length (i.e., body size) decreased by 51% from the largest (2.94 mm) to smallest individual (1.44 mm). Multivariate analyses of leg and wing measurements were unable to detect any trends in shape independent of size. The PCA on wing dimensions (not including wing length) returned only one significant PC axis which accounted for 85% of total variation in wing dimensions. A linear regression of these PC scores on wing length was significant (R 2 = 97%, p < 0.0001), thus virtually all variation in wing measurements across populations was due to body size. Similarly, a PCA of leg segment length gave one significant PC axis explaining 92% of total variation, which was also closely linked to body size (R 2 = 85%, p = 0.0001). No systematic variation in leg segmentation independent of body size was detected. Four of the six morphometric ratios examined were isometric. None of the regressions of leg ratios (BV1, LR1 and SV1) and wing ratio VRC on wing length were significant: pvalues ranged from 0.716 to 0.270, with R 2 ranging from 0.5% to 4% of variation explained by body size. Although leg and wing ratios did not vary systematically with body size, their values overlapped broadly for most barcode groups, as typified by BV1 (Figure 2). Only antennal ratio showed clear evidence of being allometric (R 2 = 62%, p < 0.0001); AR increased in value with body size across populations (Figure 2). Too few individuals were available for each of the barcode clusters to determine whether the same allometric relation existed within each population. Wing ratio VRCU showed a weak but statistically significant relation to size (p = 0.002, R 2 = 27%), however this was influenced by one individual with aberrant wing venation, so the regression was not considered strong evidence for allometry (Figure 2). The ability of thoracic and abdominal setae to distinguish barcode clusters was examined via NMDS ordination; the best solution, based on a Euclidean distance matrix, had three axes.
140
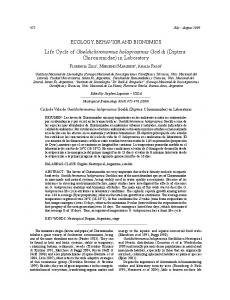
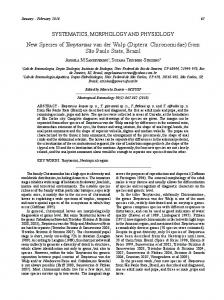
Axes 1 and 2 together explained 88% of variation in the data, and clearly separated C. (I.) ornatus, plus C. (I.) sp. 3, C. (I.) sp. 6 and C. (I.) sp. 7 (Figure 3) from the remaining barcode clusters. Correlations of the original setae variables with axis scores (Table 1) indicate that Axis 1 contrasted the numbers of tergal, dorsocentral and scutellar setae vs. the number of acrosticals and the robustness of scutellar and medial tergal setae. The number of sensilla chaetica was also correlated with Axis 1 scores. Thus C. (I.) ornatus and C. (I.) sp. 3 (nr. pilitarsis) exhibited high scores on Axis 1 (Figure 3) because they had more lateral tergal setae, but narrower scutellar and medial tergal setae (ca. 2.5 µm diameter) compared to Cricotopus (I.) sylvestris and related barcode clusters (medial setae ca. 5 µm). Axis 2 contrasted of the numbers of lateral setae on tergites 3 and 4, with the robustness of the medial setae on these tergites and the scutellum. The number of sensilla chaetica and prealar setae also contributed to higher scores on Axis 2. Therefore C. (I.) sylvestris and related populations are located in the upper left corner of Figure 3. Pigmentation patterns were summarized by a NMDS ordination, based on a Sørensen distance matrix. The best solution had 6 significant axes but only 2 were retained, due to their effectiveness in summarizing color variation (e.g., final STRESS = 10). When ordination results were associated with barcode clusters three distinct phenotypes were revealed within the largest barcode group, which according to Hirvenoja (1973) corresponded to C. (I.) sylvestris and C. (I.) trifasciatus small form (Figure 4). Within this largest barcode cluster, a third dark-pigmented Canadian population of C. (I.) sylvestris largely intermingled with C. (I.) ornatus and three other barcode clusters. Crictopus (I.) glacialis formed a tight cluster distinct from C. (I.) sylvestris, but which completely overlapped with that of C. (I.) sp. 3. Correlations of the original pigment variables with the ordination scores (Table 2) indicated high scores on the first axis reflected the width and form of pigment bands on tergites 1,4 and 7, white gonocoxites and light bands on tarsal segments 2 and 3 of the midleg. Lower scores on Axis 1 reflected darker pigment on the scutellum and location of the pigment band on tergite 2. Given our scoring system, individuals with darker pigment on these leg segments as well as darker pigmentation of the scutellum, and posterior scutum and humeral area (e.g. C. (I.) ornatus and C. (I.) glacialis) had higher scores on Axis 1 (Figure 4). Axis 2 generally emphasized the brightness of light rings on the legs, especially on the femur, tibiae and first 3 tarsal segments of the mid and hind legs, as well as brightness of the gonocoxites and posterior scutum. The extent of pigmentation of the abdominal tergites was represented by both axes, whereas presence of a medial pigment spot on tergite 4 (typical of C. (I.) sylvestris) was uniquely represented by axis 2. In summary, individuals in the upper left corner of Figure 4 (e.g., C. (I.) trifasciatus, C. (I.) tricinctus) have brightly banded legs, strongly contrasting pigment patterns on the thorax, and a light-colored scutellum. Individuals with low scores on both axes had darker legs with
Fauna norvegica 31: 137-149. 2012
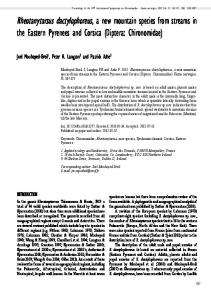
Figure 2. Morphometric ratios for foreleg (BV1), wing venation (VCU), and antennae (AR) plotted against size (wing length). BV1 was isometric, but both AR and VCU showed evidence of allometric relations with size. Table 1. Pearson correlations of the original setae variables with NMDS ordination scores. Correlations (R 2) between the original data and scores in reduced dimensions: axis 1 R 2 = 0.516, axis 2 R 2 = 0.359, axis 3 R 2 = 0.113. Final “Stress” = 4.48. Axis
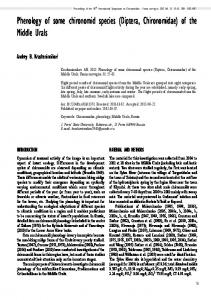
Figure 1. Taxon identification tree: a neighbor-joining tree with bootstrap support based on 1000 random replications. The COI dataset included 658 positions. Distances were computed using the Kimura 2-parameter method. Individual specimen codes indicate location of collection site: “SV”= Svalbard, Norway; “IS” = Iceland; “OSF”= Oslofjord, Norway; “CHIR CH” and “HLC” = Churchill, Manitoba, Canada; “SEG5” - 7 = Nevada, USA; “SEG59”= Minnesota, USA; “SEG36” – 38 = Maryland, USA; “Finnmark”= northern Norway.
sensilla chaetica dorsocentral setae prealar setae scutellar setae acrostichal setae antepronotal setae lateral setae-tergite 3 medial setae-tergite3 lateral setae-tergite 4 medial setae tergite 4 robustness-scutellar robustness-medial
1
2
3
.531 .677 .278 .549 -.419 .397 .823 .396 .801 .464 -.507 -.608
.622 .108 .496 -.024 -.132 -.220 -.708 .213 -.713 -.047 .604 .664
.523 .661 .312 .393 .626 .341 .358 .635 .361 .605 -.155 -.189
141
Gresens, Stur and Ekrem: Variation in the Cricotopus sylvestris species-group
Table 2. Pearson correlations of the pigmentation variables with NMDS ordination scores. Only variables with correlations greater than 0.300 are listed. Subscripts refer to fore (1), mid (2) or hind (3) leg. “T#” refers to a specific abdominal tergite; “T#a” refers to the location of the anterior edge and “T#p” to the posterior edge of a pigment band. Correlations (R 2) between the original data and scores in reduced dimensions: axis 1 R 2 = 0.649, axis 2 R 2 = 0.298. “Stress” = 10.75. Axis Contrast of leg rings Femur1 Tibia1 Femur2 Tibia2 1st tarsomere2 2nd tarsomere2 3rd tarsomere2 Femur3 Tibia3 1st tarsomere3 2nd tarsomere3 3rd tarsomere3 T1p T2a T3a T4a T4p T4 (pattern) T5a T6p T7p T7 T8p Gonocoxites Posterior scutum Scutellum
1
2
.343 .328 .360 .215 .184 .219 .515 .475 .279 .137 .112 .156 .198 .532 -.509 .088 .735 .886 -.236 .268 -.331 .387 .350 -.280 .476 -.003 -.532
-.411 -.700 -.325 -.593 -.377 -.455 -.669 -.495 -.593 -.401 -.385 -.470 .328 -.899 .891 .552 -.147 -.706 -.318 .401 .267 -.299 -.135 .378 -.441 -.430 -.023
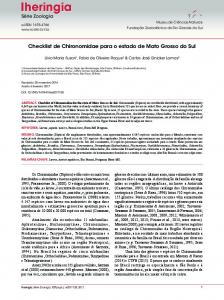
less obvious rings, and more extensive tergal pigment bands. The “typical” form of C. (I.) sylvestris, with a triangular or round pigment patch on tergite 4 had intermediate scores on Axis 1. Although neither setae nor pigmentation alone were sufficient to distinguish all nine barcode clusters within the C. (I.) sylvestris-group, these two datasets did provide complimentary information. To further characterize unidentified barcode clusters we sought additional morphological features whose shape was more difficult to quantify: the inferior volsella and the gonostylus (Figure 5). The inferior volsella of C. (I.)
142
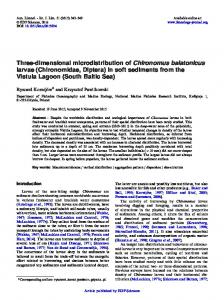
Figure 3. NMDS axis scores for an ordination of counts of thoracic and abdominal seta. Barcode groups as numbered in legend: 1 = sylvestris gr. spp.; 2 = C. (I.) glacialis; 3 = C. (I.) sp. 3; 4 = C. (I.) sp. 4; 5 = C. (I.) sp. 7; 6 = C. (I.) ornatus; 7 = C. (I.) sp. 6; 8 = C. (I.) sp. 5; 9 = C. (I.) tricinctus.
Figure 4. NMDS axis scores for an ordination of pigment pattern on legs, thorax and abdominal tergites. Barcode groups are coded as in Figure 3.
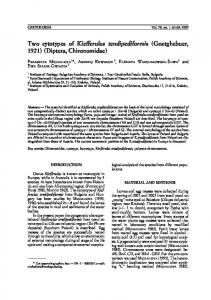
nr. pilitarsis is relatively broad and blunt, whereas in C. (I.) ornatus it is more slender and parallel-sided. In contrast, the inferior volsellae of C. (I.) sylvestris and C. (I.) trifasciatus were distinctly triangular. Although the appearance of the gonostylus may be biased by its angle of presentation in slide-mounted specimens, we found consistent differences in shape between populations. Canadian C. (I.) sp. 4 had an elongate, “cucumbershaped” gonostylus, whereas gonostyli of C. (I.) ornatus and C. (I.) sylvestris were clearly tapered at the base. Gonostyli of C.
Fauna norvegica 31: 137-149. 2012
Figure 5. Variation in structure of the male hypopygium. Inferior volsella of: a. C. (I.) sp. 3; b. C. (I.) ornatus; c. C. (I.) trifasciatus. Gonostylus of: d. C. (I.) sp. 4; e. C. (I.) ornatus; f. C. (I.) sylvestris.
(I.) sylvestris and C. (I.) trifasciatus were distinctly curved and generally more slender than that of C. (I.) ornatus, which was quite broad distally (Figure 5).
Discussion The extremes observed for size/wing length generally reflected latitude: the largest specimens were collected from Finnmark (latitude 70°N), whereas the smallest specimens were reared during summer in Maryland (latitude 39°N). It was not possible to distinguish latitudinal and seasonal effects on body size, because the majority of specimens were collected between the months of June and August. Antennal ratio significantly increased with size, showing allometric changes in the length of the terminal flagellomere relative to the basal antennal segments. Clear evidence of allometry in both the AR and the BV leg ratio has also been reported in two wide-ranging Australian chironomid species (McKie & Cranston 2005). We found weak evidence for allometry in the wing ratio VRCU, which appeared to decrease with size, but a larger sample size is needed to decide whether or not an outlier does represent the normal range of variation. Morphometric analysis of wing venation in Drosophila lummei Hackman, 1972 did find variation in wing shape consistent with genetic differences in geographically distant populations (Haas & Tolley 1998). However, our ordination of wing dimensions failed to show any variation that was not simply due to size, and suggests that wing ratios may not be informative in the sylvestris-group. For the sylvestris-group species studied, leg ratios and the wing ratio, VRC, were free of allometric effects, but their values
varied widely within and between species, with no evidence of size-independent pattern. Oliver and Dillon (1988) similarly concluded that leg ratios were not useful for distinguishing Cricotopus species from the Canadian arctic. Boesel (1983) found both AR and leg ratios highly variable among Cricotopus in the eastern United States. Unfortunately it is impossible to generalize about the occurrence of allometry as it appears to affect only certain morphometric ratios, on a species and gender specific basis (Kobayashi 1998; McKie & Cranston 2005). Within the sylvestris-group, ratios may have some use in distinguishing particular pairs of species, but should be treated with caution until more thorough sampling of geographical variation of populations has been achieved. The ordination of setae was particularly effective in separating a group consisting of C. (I.) ornatus, C. (I.) sp. 3, C. (I.) sp. 6 and C. (I.) sp. 7 from the remaining populations (Figure 3). The number of lateral tergal setae played an important role as noted by Oliver & Dillon (1988) who found them useful in distinguishing C. (I.) sylvestris from C. (I.) ornatus. The ordination also emphasized the robustness of scutellar setae and median tergal setae, traits which Hirvenoja (1973) used to separate C. (I.) ornatus and C. (I.) relucens from the remaining sylvestris-group species. The first ordination axis strongly emphasized the number of sensilla chaeticae and dorsocentral setae. Hirvenoja (1973) considered the number of tarsal sensilla chaetica to be very important in separating particular pairs of species, whereas the dorsocentrals merit further comparison across a wider range of populations to confirm their utility. The ordination of color pattern was most successful in distinguishing populations of C. (I.) sylvestris, C. (I.) glacialis, C. (I.) trifasciatus and C. (I.) tricinctus, which commonly pose the greatest difficulty in identification of adults (LeSage & Harrison 1980; Boesel 1983; Oliver & Dillon 1988). Ironically, C. (I.) glacialis, from Svalbard, and C. (I.) sp. 3, from Finnmark, clustered tightly, but were separated from the “dark-form” C. (I.) sylvestris population (from Canada). Oliver and Dillon (1988) concluded that although C. (I.) glacialis appeared similar to dark C. (I.) sylvestris from the Canadian arctic, C. (I.) glacialis was restricted to the Palaearctic. The remaining Canadian barcode clusters plus C. (I.) ornatus from Finnmark grouped together in the ordination, reflecting the trend for arctic populations to be more darkly pigmented than their temperate zone relatives (Oliver & Dillon 1988). The analyses of pigmentation and setae thus yielded complementary information for distinguishing barcode clusters. Given the complex and subtle variation in pigmentation of legs, thorax and abdomen in many Cricotopus species, the ability to visualize trends in color patterns is valuable. Numerical quantification of color patterns followed by ordination analysis appears to be a useful tool for comparative studies of Cricotopus populations. Methods of coding pigment variables can be modified to capture different types of markings, or more precise banding patterns, as required. However, the next step in phenotypic analysis would be to expand the
143
Gresens, Stur and Ekrem: Variation in the Cricotopus sylvestris species-group
dataset to include greater latitudinal and seasonal sampling of populations to capture a wider range of within-species variation in pigmentation. If color patterns are indeed uniquely associated with particular species, the discontinuities observed in the ordination should remain, but if environmental plasticity dominates, one would expect to see continuous gradations of color pattern among barcode clusters. Our inability to resolve C. (I.) sylvestris and C. (I.) trifasciatus using COI sequence data suggests that either the analyzed specimens represent one highly plastic species, or two evolutionarily young species that are have not yet had the time to diverge genetically, or two species that have hybridized one or more times resulting in mitochondrial introgression. Cytogenetic evidence indicates that hybridization within the sylvestris species-group also contributes to the high degree of variation in the group. Compared to sympatric populations of C. (I.) ornatus and C. (I.) tricinctus, C. (I.) sylvestris had a lower number of chromosomes, which showed a high degree of polymorphism, and were characterized by incomplete pairing of homologues. This evidence suggests that speciation of C. (I.) sylvestris involved hybridization and has occurred relatively recently (Michailova 1976, 1980). Mitochondrial genes such as COI, which are maternally inherited, would not detect the effects of hybridization; instead, sequence data from neutral nuclear genes are necessary to test the hypothesis that C. (I.) sylvestris and C. (I.) trifasciatus constitute a single species. Finding genetic markers that can accurately distinguish very closely related and evolutionarily young species is a challenge. Barcoding data is widely used in delineation of animal species, and a pairwise sequence divergence of 2% has been found to characterize the great majority of interspecific comparisons across many genera (Hebert et al. 2003). However, COI sequence data were considerably less successful in distinguishing species of Diptera within a dataset composed of a large number of closely related species (Meier et al. 2006). The need for multiple genetic markers is further emphasized by Carew et al. (2011) in their study of a taxonomically difficult complex of Procladius Skuse, 1889 species: COI data resolved only half of the six genetically distinct clusters that were detected by Cytb and CAD sequence data. Each of these genes provided unique information for these species. Ekrem et al. (2010) also found the nuclear marker CAD superior to COI in reconstruction of genus-level relations within tribe Tanytarsini. The difficulty in distinguishing intra- and interspecific variation in Cricotopus has been well documented, and is especially great in the sylvestris-group (Hirvenoja 1973; Boesel 1983; Oliver & Dillon 1988). The ability to connect phenotypic and genotypic variation should improve our ability to delimit species across a broad geographic range. To this end, we defined a numerical method which was successful in summarizing complex patterns of pigmentation and which facilitated comparison of coloration among individuals and populations. A similar analysis of the distribution of setae complemented the ability of pigmentation data to distinguish populations.
144
Mapping the identity of barcode clusters onto the results of ordinations of phenotypic data showed the distinctiveness of many described species. It also showed various degrees of intergradation of traits between Palaearctic species (e.g., C. (I.) ornatus) and similar Nearctic populations. Barcode data was not always able to distinguish some phenotypically and geographically distinct populations, e.g. C. (I.) sylvestris and C. (I.) trifasciatus. Given the evidence for divergence of geographically distant populations and for hybridization within sympatric species, sequence data from nuclear genes, such as CAD, are also required to define closely related sylvestris-group species. Our study of populations across a Palaearctic-Nearctic gradient is an initial step in formally addressing geographic variation of these species, and it underscores the impact of under-sampling (Oliver & Dillon 1988, Meier et al. 2006) on the perceived “gap” (phenotypic or genetic) between species. More comprehensive sampling both within and among species across their geographical ranges is needed to improve our ability to “draw the line” between species with confidence.
Acknowledgments Thanks to M. Wolfire and L. C. Ferrington, Jr. who helped obtain the material from Nevada and Minnesota, respectively, and to Paul Hebert and the CCDB team for generating most of the DNA barcodes used in this study. Sequence analysis at the CCDB was enabled by support from Genome Canada through the Ontario Genomics Institute to Paul Hebert. S.E.G. gratefully acknowledges lab support and resources provided by the Museum of Natural History and Archaeology during her sabbatical visit.
References Boesel MW. 1983. A review of the genus Cricotopus in Ohio, with a key to adults of the species of the Northeastern United States (Diptera, Chironomidae). Ohio Academy of Science 83 (3): 74-90. Carew ME, Marshall SE, Hoffmann AA. 2011. A combination of molecular and morphological approaches resolves species in the taxonomically difficult genus Procladius Skuse (Diptera: Chironomidae) despite high intra-specific morphological variation. Bulletin of Entomological Research 101 (5): 505-519. Cranston PS, Oliver DR, Sæther OA. 1989. The adult males of Orthocladiinae (Diptera: Chironomidae) of the Holarctic region – Keys and diagnoses. In: Wiederholm T (Ed.). The adult males of Chironomidae (Diptera) of the Holarctic region – Keys and diagnoses. Entomologica Scandinavica Supplement 34:165-352. Ekrem, T, Willassen E, Stur E. 2010. Phylogenetic utility of five genes for dipteran phylogeny: a test case in the Chironomidae leads to generic synonymies. Molecular Phylogenetics and Evolution 57:561-571. Epler JH, Cuda JP, Center TD. 2000. Redescription of Cricotopus lebetis (Diptera: Chironomidae), a potential biocontrol agent
Fauna norvegica 31: 137-149. 2012
of the aquatic weed Hydrilla (Hydrocharitaceae). Florida Entomologist 83(2): 171-180. Gresens SE. 1997. Interactive effects of diet and thermal regime on growth of the midge Pseudochironomus richardsoni Malloch. Freshwater Biology 38: 365-373. Haas HL, Tolley KA. 1998. Geographic variation of wing morphology in three Eurasian populations of the fruit fly, Drosophila lummei. Journal of Zoology, London 245: 197-203. Hebert PDN, Ratnasingham S, de Waard JR. 2003. Barcoding animal life: cytochrome c oxidase subunit 1 divergences among closely related species. Proceedings of the Royal Society of London B. (Supplement) 270: S96-S99. Hirabayashi K, Matsuzawa M, Yamamoto M, Nakamoto N. 2004. Chironomid fauna (Diptera, Chironomidae) in a filtration plant in Japan. Journal of the American Mosquito Control Association 20(1): 74-82. Hirvenoja M. 1973. Revision der Gattung Cricotopus van der Wulp und ihrer Verwandten (Diptera, Chironomidae). Annales Zoologici Fennici 10:1-363. Kimura M. 1980. A simple method for estimating evolutionary rate of base substitution through comparative studies of nucleotide sequences. Journal of Molecular Evolution 16: 111-120. Kobayashi T. 1998. Seasonal changes in body size and male genital structures of Procladius choreus (Diptera: Chironomidae: Tanypodinae). Aquatic Insects 20(3): 165-172. Kobayashi T, Hayashi F. 2001. Inter- and intraspecific variation in body size and scutal marking pattern in three species of Conchapelopia (Diptera: Chironomidae). Entomological Science 4(1):39-45. LeSage L, Harrison AD. 1980. Taxonomy of Cricotopus species (Diptera: Chironomidae) from Salem Creek, Ontario. Proceedings of the Entomological Society of Ontario 111: 57114. Meier R, Shiyang K, Vaidya G, Ng PKL. 2006. DNA barcoding and taxonomy in Diptera: a tale of high intraspecific variability and low identification success. Systematic Biology 55(5): 715728. Michailova P. 1976. Cytotaxonomical diagnostics of species from the genus Cricotopus (Chironomidae, Diptera). Caryologia 29(3): 291-306. Michailova P. 1980. Cytotaxonomic features of species of the subfamily Orthocladiinae (Diptera, Chironomidae) from Bulgaria. Genetica 52/53: 263-266. McKie B, Cranston PS. 2005. Size matters: systematic and ecological implications of allometry in the responses of chironomid midge morphological ratios to experimental temperature manipulations. Canadian Journal of Zoology 83: 553-568. McKune B, Mefford MJ. 2006. PC-ORD Multivariate analysis of ecological data v.5.10. MJM Software. Gleneden Beach, Oregon, USA. Oliver DR. 1984. Description of a new species of Cricotopus van der Wulp (Diptera: Chironomidae) associated with Myriophyllum spicatum. Canadian Entomologist 116(10): 1287-1292. Oliver DR, Dillon ME. 1988. Review of Cricotopus (Diptera: Chironomidae) of the Nearctic arctic zone with description of two new species. Canadian Entomologist 120: 463-496. Poole RW, Gentili P.1998. Nomina Insecta Nearctica. www.nearctica.com/nomina/main.htm. Accessed 2010-06-16. Ratnasingham S, Hebert PDN. 2007. BOLD: The barcode of life
data system (www.barcodinglife.org). Molecular Ecology Notes 7: 355-364. Simpson KW, Bode RW, Albu P. 1983. Keys for the genus Cricotopus adapted from “Revision der Gattung Cricotopus van der Wulp und ihrer Verwandten (Diptera, Chironomidae)” by M. Hirvenoja. Bulletin No. 450. New York State Museum. The State Education Department, Albany, New York 133 p. Spies M. 2000. Non-biting ‘nuisance’ midges (Diptera, Chironomidae) in urban southern California, with notes on taxonomy, ecology and zoogeography. In: Hoffrichter O (Ed.) Late 20th century research on Chironomidae: an anthology from the 13th International Symposium on Chironomidae. Shaker Verlag, Aachen, pp 621-628. Tamura K, Peterson D, Peterson N, Stecher G, Nei M, Kumar S. 2011. MEGA5: Molecular Evolutionary Genetics Analysis using maximum likelihood, evolutionary distance, and maximum parsimony methods. Molecular Biology and Evolution 28 (10): 2731-2739.
145
Gresens, Stur and Ekrem: Variation in the Cricotopus sylvestris species-group
Appendix. List of specimens used in molecular analyses. Associated larval and pupal exuviae are abbreviated “Lex” and “Pex”, respectively. BOLD Sample ID
Species
Identifier
Life stage
Country
Province
Region
CH-OSF187
Cricotopus glacialis
Elisabeth Stur
Male adult
Norway
Oslo
Oslo
IS40
Cricotopus glacialis
Elisabeth Stur
Larva
Iceland
Geysir
IS41
Cricotopus glacialis
Elisabeth Stur
Larva
Iceland
Geysir
IS45
Cricotopus glacialis
Elisabeth Stur
Female adult
Iceland
SV103
Cricotopus glacialis
Elisabeth Stur
Male adult
Norway
Svalbard
Adventdalen
SV148
Cricotopus glacialis
Elisabeth Stur
Male adult
Norway
Svalbard
Adventdalen
SV181
Cricotopus glacialis
Elisabeth Stur
Male adult
Norway
Svalbard
Nordenskioldland
SV184
Cricotopus glacialis
Elisabeth Stur
Male adult
Norway
Svalbard
Nordenskioldland
SV185
Cricotopus glacialis
Elisabeth Stur
Male adult
Norway
Svalbard
Nordenskioldland
SV319
Cricotopus glacialis
Elisabeth Stur
Male adult
Norway
Svalbard
Nordenskioldland
SV326
Cricotopus glacialis
Elisabeth Stur
Larva
Norway
Svalbard
Nordenskioldland
SV61
Cricotopus glacialis
Elisabeth Stur
Female adult
Norway
Svalbard
Adventdalen
SV66
Cricotopus glacialis
Elisabeth Stur
Female adult
Norway
Svalbard
Adventdalen
SV72
Cricotopus glacialis
Elisabeth Stur
Male adult
Norway
Svalbard
Adventdalen
SV84
Cricotopus glacialis
Elisabeth Stur
Female adult
Norway
Svalbard
Adventdalen
SV89
Cricotopus glacialis
Elisabeth Stur
Female adult
Norway
Svalbard
Adventdalen
Finnmark156
Cricotopus ornatus
Elisabeth Stur
Male adult
Norway
Finnmark
Vardo
Finnmark635
Cricotopus ornatus
Elisabeth Stur
Male adult
Norway
Finnmark
Sor-Varanger
Finnmark639
Cricotopus ornatus
Elisabeth Stur
Male adult
Norway
Finnmark
Sor-Varanger
Finnmark175
Cricotopus sp. 3
Elisabeth Stur
Male adult
Norway
Finnmark
Kautokeino
Finnmark192
Cricotopus sp. 3
Elisabeth Stur
Male adult
Norway
Finnmark
Kautokeino
Finnmark512
Cricotopus sp. 3
Elisabeth Stur
Male adult
Norway
Finnmark
Kautokeino
Finnmark580
Cricotopus sp. 3
Elisabeth Stur
Male adult
Norway
Finnmark
Lebesby
Finnmark356
Cricotopus sp. 5
Elisabeth Stur
Male adult
Norway
Finnmark
Porsanger
CHIR_CH229
Cricotopus sp. 4
Elisabeth Stur
Male adult
Canada
Manitoba
Churchill
CHIR_CH78
Cricotopus sp. 4
Elisabeth Stur
Male adult
Canada
Manitoba
Churchill
CHIR_CH79
Cricotopus sp. 4
Elisabeth Stur
Female adult
Canada
Manitoba
Churchill
CHIR_CH80
Cricotopus sp. 4
Elisabeth Stur
Male adult
Canada
Manitoba
Churchill
CHIR_CH81
Cricotopus sp. 4
Elisabeth Stur
Male adult
Canada
Manitoba
Churchill
CHIR_CH82
Cricotopus sp. 4
Elisabeth Stur
Male adult
Canada
Manitoba
Churchill
CHIR_CH83
Cricotopus sp. 4
Elisabeth Stur
Female adult
Canada
Manitoba
Churchill
CHIR_CH133
Cricotopus sp. 6
Elisabeth Stur
Male adult
Canada
Manitoba
Churchill
CHIR_CH134
Cricotopus sp. 6
Elisabeth Stur
Male adult
Canada
Manitoba
Churchill
CHIR_CH135
Cricotopus sp. 6
Elisabeth Stur
Male adult
Canada
Manitoba
Churchill
CHIR_CH136
Cricotopus sp. 6
Elisabeth Stur
Male adult
Canada
Manitoba
Churchill
CHIR_CH292
Cricotopus sp. 6
Elisabeth Stur
Male adult
Canada
Manitoba
Churchill
CHIR_CH54
Cricotopus sp. 6
Elisabeth Stur
Male pupa, Lex
Canada
Manitoba
Churchill
CHIR_CH94
Cricotopus sp. 6
Elisabeth Stur
Female pupa, Lex
Canada
Manitoba
Churchill
CHIR_CH291
Cricotopus sp. 7
Elisabeth Stur
Larva
Canada
Manitoba
Churchill
CHIR_CH525
Cricotopus sp. 7
Elisabeth Stur
Male adult
Canada
Manitoba
Churchill
CHIR_CH575
Cricotopus sp. 7
Elisabeth Stur
Male adult
Canada
Manitoba
Churchill
HLC-26965
Cricotopus sp. 7
Elisabeth Stur
Male adult
Canada
Manitoba
Churchill
146
Geysir
Fauna norvegica 31: 137-149. 2012
Locality
Latitude
Longitude
Elev
Collection Date
Collectors
Blankvann, Karussputten
60.013901
10.662700
360
19-Jul-2010
L.O. Hansen & M. Steinert
Stream from hot springs
64.311996
-20.301001
123
01-Oct-2006
T. Ekrem & E. Stur
Stream from hot springs
64.311996
-20.301001
123
01-Oct-2006
T. Ekrem & E. Stur
Stream from hot springs
64.311996
-20.301001
123
01-Oct-2006
T. Ekrem & E. Stur
at Gruvedalen
78.224998
15.650000
50
11-Jul-2005
M. Skjøstad
at Todalen
78.160004
15.830000
100
07-Jul-2005
M. Skjøstad
Griegfjella, Griegbekken
78.009003
13.662000
20
07-Aug-2008
T. Ekrem & K. Hårsaker
Griegfjella, Griegbekken
78.009003
13.662000
20
07-Aug-2008
T. Ekrem & K. Hårsaker
Griegfjella, Griegbekken
78.009003
13.662000
20
07-Aug-2008
T. Ekrem & K. Hårsaker
Griegfjella, Griegbekken
78.009003
13.662000
20
07-Aug-2008
T. Ekrem & K. Hårsaker
Griegfjella, Griegbekken
78.009003
13.662000
20
07-Aug-2008
T. Ekrem & K. Hårsaker
at Gruvedalen
78.224998
15.650000
50
07-Jul-2005
M. Skjøstad
at Gruvedalen
78.224998
15.650000
50
07-Jul-2005
M. Skjøstad
at Gruvedalen
78.224998
15.650000
50
07-Jul-2005
M. Skjøstad
at Gruvedalen
78.224998
15.650000
50
09-Jul-2005
M. Skjøstad
at Gruvedalen
78.224998
15.650000
50
09-Jul-2005
M. Skjøstad
Indre Kiberg, rockpools
70.269402
30.945400
3
29-Jul-2010
T. Ekrem
Grense Jakobselv, rockpools
69.791603
30.795799
7
01-Aug-2010
T. Ekrem
Grense Jakobselv, rockpools
69.791603
30.795799
7
01-Aug-2010
T. Ekrem
Kautokeinoelva, near Masi
69.448196
23.757601
275
24-Jul-2010
T. Ekrem
Kautokeinoelva, near Masi
69.448196
23.757601
275
31-Aug-2010
A. Anderson
Lahpoluoppal, at Nahpoljohka river
69.210297
23.761999
320
16-Aug-2010
T. Ekrem & E. Stur
near Njallavarri, at lake
70.452103
27.010099
62
28-Jul-2010
T. Ekrem
near Gaggavann, at fen
69.823700
25.200899
106
16-Jun-2010
T. Ekrem & E. Stur
23 km E Churchill, Ramsay Creek
58.730999
-93.779999
13
15-Aug-2006
T.Ekrem & E.Stur
22 km E Churchill, CNSC, pond at road
58.737000
-93.819000
11
12-Aug-2006
E.Stur & T.Ekrem
22 km E Churchill, CNSC, pond at road
58.737000
-93.819000
11
12-Aug-2006
E.Stur & T.Ekrem
22 km E Churchill, CNSC, pond at road
58.737000
-93.819000
11
12-Aug-2006
E.Stur & T.Ekrem
22 km E Churchill, CNSC, pond at road
58.737000
-93.819000
11
12-Aug-2006
E.Stur & T.Ekrem
22 km E Churchill, CNSC, pond at road
58.737000
-93.819000
11
12-Aug-2006
E.Stur & T.Ekrem
22 km E Churchill, CNSC, pond at road
58.737000
-93.819000
11
12-Aug-2006
E.Stur & T.Ekrem
16 km E Churchill, Bird Cove, Rock Bluff B
58.771999
-93.843002
5
11-Aug-2006
E.Stur & T.Ekrem
16 km E Churchill, Bird Cove, Rock Bluff B
58.771999
-93.843002
5
11-Aug-2006
E.Stur & T.Ekrem
16 km E Churchill, Bird Cove, Rock Bluff B
58.771999
-93.843002
5
11-Aug-2006
E.Stur & T.Ekrem
16 km E Churchill, Bird Cove, Rock Bluff B
58.771999
-93.843002
5
11-Aug-2006
E.Stur & T.Ekrem
16 km E Churchill, Bird Cove, Rock Bluff C
58.765999
-93.867996
5
16-Jul-2007
T.Ekrem & E.Stur
16 km E Churchill, Bird Cove, Rock Bluff C
58.765999
-93.867996
3
12-Aug-2006
T.Ekrem & E.Stur
16 km E Churchill, Bird Cove, Rock Bluff C
58.765999
-93.867996
3
12-Aug-2006
T.Ekrem
16 km E Churchill, Bird Cove, Rock Bluff C
58.765999
-93.867996
5
16-Jul-2007
T.Ekrem & E.Stur
16 km E Churchill, Bird Cove, Rock Bluff B
58.771000
-93.852997
3
22-Jul-2007
E.Stur
2 km NW Churchill, Churchill Harbour
58.778999
-94.195000
2
25-Jul-2007
P.D.N. Hebert
Town of Churchill, 111 Hearne St., backyard
58.769001
-94.160004
11-Aug-2007
J.Lankshear & J.McGowan
Continued on next page.
147
Gresens, Stur and Ekrem: Variation in the Cricotopus sylvestris species-group
Appendix. Continued. BOLD Sample ID
Species
Identifier
Life stage
Country
Province
Region
HLC-26966
Cricotopus sp. 7
Elisabeth Stur
Female adult
Canada
Manitoba
Churchill
HLC-26980
Cricotopus sp. 7
Elisabeth Stur
Male adult
Canada
Manitoba
Churchill
HLC-26985
Cricotopus sp. 7
Elisabeth Stur
Female adult
Canada
Manitoba
Churchill
CHIR_CH234
Cricotopus sp. 21
Susan E. Gresens
Male adult
Canada
Manitoba
Churchill
CHIR_CH13
Cricotopus sylvestris Susan E. Gresens
Male adult
Canada
Manitoba
Churchill
CHIR_CH152
Cricotopus sylvestris Susan E. Gresens
Male adult
Canada
Manitoba
Churchill
CHIR_CH205
Cricotopus sylvestris Susan E. Gresens
Male adult
Canada
Manitoba
Churchill
CHIR_CH271
Cricotopus sylvestris Susan E. Gresens
Male adult
Canada
Manitoba
Churchill
CHIR_CH488
Cricotopus sylvestris Elisabeth Stur
Male adult
Canada
Manitoba
Churchill
CHIR_CH494
Cricotopus sylvestris Susan E. Gresens
Male adult
Canada
Manitoba
Churchill
CHIR_CH523
Cricotopus sylvestris Susan E. Gresens
Male adult
Canada
Manitoba
Churchill
CHIR_CH576
Cricotopus sylvestris Elisabeth Stur
Male adult
Canada
Manitoba
Churchill
HLC-27050
Cricotopus sylvestris Susan E. Gresens
Male adult
Canada
Manitoba
Churchill
HLC-27058
Cricotopus sylvestris Elisabeth Stur
Male adult
Canada
Manitoba
Churchill
SEG36
Cricotopus trifasciatus Susan E. Gresens
Male adult
United States Maryland
Baltimore Co.
SEG37
Cricotopus trifasciatus Susan E. Gresens
Male adult
United States Maryland
Baltimore Co.
SEG38
Cricotopus trifasciatus Susan E. Gresens
Male adult, Pex
United States Maryland
Baltimore Co.
SEG5
Cricotopus sylvestris Susan E. Gresens
Male adult
United States Nevada
Clark County
SEG59
Cricotopus trifasciatus Susan E. Gresens
Male adult, Pex, Lex United States Minnesota Ramsey Co.
SEG7
Cricotopus sylvestris Susan E. Gresens
Male adult, Pex
United States Nevada
Clark County
CHIR_CH102
Cricotopus tricinctus Susan E. Gresens
Female adult
Canada
Manitoba
Churchill
CHIR_CH511
Cricotopus tricinctus Susan E. Gresens
Male adult
Canada
Manitoba
Churchill
148
Fauna norvegica 31: 137-149. 2012
Locality
Latitude
Longitude
Elev
Collection Date
Collectors
Town of Churchill, 111 Hearne St., backyard
58.769001
Town of Churchill, 111 Hearne St., backyard
58.769001
-94.160004
11-Aug-2007
J.Lankshear & J.McGowan
-94.160004
11-Aug-2007
J.Lankshear & J.McGowan
Town of Churchill, 111 Hearne St., backyard
58.769001
-94.160004
23 km E Churchill, Ramsay Creek
58.730999
-93.779999
13
11-Aug-2007
J.Lankshear & J.McGowan
15-Aug-2006
T.Ekrem & E.Stur
23 km E Churchill, Ramsay Creek
58.730999
-93.779999
26 km SE Churchill, Twin Lakes burn site
58.618000
-93.806999
13
15-Aug-2006
T.Ekrem & E.Stur
33
14-Aug-2006
T.Ekrem & E.Stur
23 km E Churchill, Ramsay Creek
58.730999
23 km E Churchill, Ramsay Creek
58.730999
-93.779999
13
15-Aug-2006
T.Ekrem & E.Stur
-93.779999
13
15-Aug-2006
T.Ekrem & E.Stur
Town of Churchill, 111 Hearne St., backyard 2 km NW Churchill, Cape Merry
58.769001
-94.160004
8
21-Jul-2007
J.McGowan
58.786999
-94.197998
3
25-Jul-2007
E.Stur & T.Ekrem
16 km E Churchill, Bird Cove, Rock Bluff B
58.771000
-93.852997
3
22-Jul-2007
E.Stur
2 km NW Churchill, Churchill Harbour
58.778999
-94.195000
2
25-Jul-2007
P.D.N. Hebert
13 km E Churchill, Eastern Creek
58.754002
-93.948997
20-Aug-2006
T.Ekrem
13 km E Churchill, Eastern Creek
58.754002
-93.948997
20-Aug-2006
T.Ekrem
Towson University, Lily Pond
39.395000
-76.605003
127
22-Jul-2010
Susan Gresens
Towson University, Lily Pond
39.395000
-76.605003
127
22-Jul-2010
Susan Gresens
Towson University, Lily Pond
39.395000
-76.605003
127
22-Jul-2010
Susan Gresens
Lake Meade, marina
36.029999
-114.776001
366
20-Mar-2010
Mark Wolfire
Shoreland, Lake Owasso
45.029999
-93.129997
270
20-Oct-2010
Susan Gresens
Lake Meade, marina
36.029999
-114.776001
367
20-Mar-2011
Mark Wolfire
26 km SE Churchill, Twin Lakes fen
58.632000
-93.786003
22
15-Aug-2006
E.Stur & T.Ekrem
11 km S Churchill, Churchill River weir
58.675999
-94.167999
1
25-Jul-2007
T.Ekrem
149