ISSN 1022-7954, Russian Journal of Genetics, 2006, Vol. 42, No. 7, pp. 752–765. © Pleiades Publishing, Inc., 2006.
GENERAL GENETICS
Genetic Structure of the Genera Psorophora (Diptera: Culicidae) in Columbian and North American Populations Using Isoenzymes and ITS2 Sequences* M. Ruiz-Garciaa, F. Belloa, b, D. Ramireza, and D. Alvareza a Unidad
de Genetica (Genetica de Poblaciones-Biologia Evolutiva), Departamento de Biologia, Facultad de Ciencias, Pontificia Universidad Javeriana, Bogotá, Colombia; e-mail:
[email protected] b Departamento de Biologia, Universidad de la Salle, Bogotá, Colombia Received December 16, 2004; in final form, November 18, 2005
Abstract—Two a priori Psorophora columbiae and one a priori Ps. toltecum populations from Colombia were studied by means of eleven isoenzyme loci. The levels of genetic diversity, Hardy–Weinberg equilibrium, gene flow estimates, isolation by distance and genetic relationships among these three populations were studied and the results were as follows: (1) The gene diversity levels were high as well as very similar among the three populations indicating no differences between them. (2) Within each population and from a hierarchical standpoint several loci were not in Hardy–Weinberg equilibrium simultaneously by excess and defect of heterozygous. This could reflect that several natural selection forces are acting upon these mosquito populations. (3) The gene flow estimate for these populations showed the existence of this event between them. This agrees quite well with the fact that the three populations really belong to a single species. In addition, maximum parsimony analyses with 16 isoenzyme for several individuals from four Colombian and two United States Psorophora populations showed that effectively only one species was present in the Colombian area surveyed, and that this species is Ps. columbiae, which hardly contrast with that previously suggested by other authors. DOI: 10.1134/S102279540607009X
INTRODUCTION Psorophora spp. (Arribalzaga, 1891) is a mosquito of medical and veterinary importance due to its efficacy as a vector of Venezuelan Equine Encephalitis viruses (VEE) [1]. This species is found throughout the American continent from the United States to northern Argentina [2]. In Colombia, the presence of this species has been recorded in the departments of northern Santander, Santander, Tolima, Boyacá, Meta, Huila, Cundinamarca, Córdoba, Guajira, Arauca, Casanare, and Amazonas [2]. Periodic human and equine VEE epidemics have affected Colombia since 1938 [3]. The last recorded epidemic occurred at the Colombian-Venezuelan Guajira in 1995. The number of affected humans was estimated from 75 000 to 100 000, with 3000 suffered neurological complications, with 300 dies. The mosquito species, involved in VEE transmission in this epidemics, were Aedes taeniorhynchus and Psorophora spp. Despite the considerable importance of VEE to public health, and the economic impact on equines, there is little information on the genetic variability of Psorophora in Colombia and other South American countries. Traditionally, the species reported for Colombia has been Psorophora confinnis. Nevertheless in a previous study, Lanzaro [4] revealed the existence of two different taxa in United States and Mexico in complex * The text was submitted by the authors in English.
form (columbiae and toltecum). This author also suggested that the three taxa (columbiae, toltecum, confinnis) could be present in Colombia. In the northern area, Atlantic Caribbean Colombia, P. toltecum could have its geographic distribution, in the Central Andean region P. columbiae should be the predominant taxa meanwhile the real P. confinnis could be established at the southern area of Colombia. The two main aims of the present study were as follows: (1) to determine the “real” molecular systematics of the Colombian Psorophora in three distant geographic and ecological regions of this country; and (2) to bring insight to elements of the genetic structure of this genus in Colombia. To undertake the first objective, we compared 16 isoenzyme loci between individuals from the three Colombian areas studied with individuals of two United States populations, one belonging to Ps. columbiae (Galveston, Texas) and other to Ps. toltecum (Thermal, California). To carry out the second aim, analysis of the genetic structure, eleven isoenzyme markers were employed together with some karyotypic studies undertaken by one of us (F.B). The potential of the multilocus enzymatic electrophoresis (MLEE) to reveal some detailed aspects of the genetic structure in several diptera species could be appreciated in the following examples. Dujardin et al. [5] identified two cryptic species of Lutzomyia, undifferentiated at a morphological level by means of isoenzymes, as well as the historical pattern of differentiation in cryptic spe-
752
GENETIC STRUCTURE OF THE GENERA PSOROPHORA (DIPTERA: CULICIDAE)
cies may be quite distinctive from that of the historical pattern of reproductive isolation [6]. In the same sense, Kreutzer et al. [7] identified different Lutzomyia taxa in the verrucarum species group, determining diagnostic allomorphs for the 6PGDH and FUM loci (L. youngi and L. spinicrassa) whereas other tree species were not differentiated among them (Lu. longoflocosa, Lu. quasitownsedi and Lu. sauroida). Byrne and Nichols [8] determined the differential gene flow capacity of Culex pipiens within and outside of London Underground tunnels. Ward et al. [9] determined the central and the allopatric distribution ranges of Phlebotomus perfiliewi using this kind of markers as well as it was the case of Lutzomyia panamensis [10]. The isoenzymes have played a determinant role to detect significant spatial structure in several diptera species such as the cases of Drosophila melanogaster [11] and Zaprionus indianus [12] in India or in diverse Drosophila species [13]. MATERIALS AND METHODS Mosquitoes sampled for the analysis of the genetic structure of the Colombian Psorophora population. Adult individuals of three populations of Psorophora were collected in three different Colombian areas, near to rice fields. These samples were obtained at Lórica (Córdoba Department; 09°13′54″ N, 75°49′11″ W) at the northern Atlantic coast of Colombia and supposedly belonging to Ps. toltecum “sensu” Lanzaro [4], Ambalema (Tolima Department; 04°47′10″ N, 76°46′00″ W) at the central Andean cordillera, and Granada (Meta Department; 03°32′19″ N, 73°42′02″ W) at the piedemonte of the Eastern Andean Cordillera. “Sensu” Lanzaro [4], both populations belonged to Ps. columbiae. Adult mosquitoes were collected and frozen at –70°C until used for electrophoresis. Approximately 30–60 individuals were analyzed in each population for each one of the biochemical markers employed. Samples analyzed to determine the phylogenetic relationships among the Columbian and the North America Psorophora populations. Two sets of Psorophora individuals were analyzed to determine the genetic relationships among Psorophora populations from Colombia and North America. In the first approach, seven mosquitoes from Lorica (Córdoba, Atlantic Caribbean Colombia), seven mosquitoes from Granada (Meta, Eastern Andean Cordillera Piedemonte), seven mosquitoes from Ambalema (Tolima, Central Andean Cordillera) and seven mosquitoes from Puerto Boyacá (Boyacá Department, Eastern Andean Cordillera) were analyzed in Colombia by means of 16 isoenzyme loci as well as three mosquitoes from Galveston (Texas, United States) and three mosquitoes from Thermal (California), representing Ps. columbiae and Ps. toltecum, respectively. With respect to the Colombian mosquitoes, the Lorica population again represented Ps. toltecum sensu Lanzaro [4] meanwhile the three Colombian Andean Psorophora populations represented a priori the taxa Ps. columbiae. RUSSIAN JOURNAL OF GENETICS
Vol. 42
No. 7
753
Electrophoretic procedures carried out. The isoenzymes applied to study the genetic structure of Psorophora in Colombia were analyzed using cellulose acetate electrophoresis (Titan III, Helena Laboratories), following the procedure described by Kreutzer and Christensen [14]. Each mosquito was homogenized in 15 µl H2O. The eleven isoenzyme loci analyzed were: malate dehydrogenase (MDH) (E.C. 1.1.1.37), phosphoglucomutase (PGM) (E. C. 5.4.2.2), isocitrate dehydrogenase (IDH) (E. C. 1.1.1.42), leucine aminopeptidase (LAP) (E. C. 3.4.11.1), α-glycerophosphate dehydrogenase (α-GDH) (E. C. 1. 1.1.8), malic enzyme (ME) (E. C. 1.1.1.40), hexokinase (HK) (E. C. 2.7.1.1), phosphoglucose isomerase (PGI) (E. C. 5.3.1.9), mannose6-phosphate isomerase (MPI) (E. C. 5. 3. 1.8), 6-phosphogluconate dehydrogenase (6PGD) (E. C. 1.1.1.44), and aspartate transaminase (AAT) (E. C. 2.6.1.1). The band pattern had a good resolution for each one of the markers employed. The 16 isoenzymes, analyzed in 12.5% starch gels, employed for phylogenetics tasks comparing a few individuals of several populations from Colombia, United States and Mexico were as follows: aconitase-1 (ACO-1) (E.C. 4.2.1.3), acid phosphatase (ACPH) (E. C. 3.1.3.2), adenylate kinase (ADK) (E. C. 2.7.4.3), creatine kinase-2 (CK-2) (E. C. 2.7.3.2), fumarase (FUM) (E. C. 4.2.1.2), α-glycerophosphate dehydrogenase (α-GDH) (E. C. 1. 1.1.8), aspartate aminotranspherase 1 and 2 or glutamic-oxalacetic transaminase 1 and 2 (GOT-1) (E. C. 2.6.1.1) (GOT-2), 2-hydroxy-acid dehydrogenase (HADH) (E. C. 1.1.99.6), hexokinase-1 (HK-1), hexokinase-2 (HK-2), hexokinase-3 (HK-3) (E. C. 2.7.1.1), isocitrate dehydrogenase (IDH) (E. C. 1.1.1.42), malate dehydzogenase 1 (MDH-1), malic enzyme (ME) (E. C. 1.1.1.40), and phosphoglucomutase (PGM) (E.C. 5.4.2.2). The staining buffer for the isoenzymes CK-2, α-GDH, HK, IDH, ME, PGM was Tris-HCl pH 7.5, for ACO-1, ADK, FUM, GOT, HADH, and MDH was Tris-HCl pH 8.0 and for ACPH was Acetate pH 5.0. Population genetics analyses. Genetic variability in each of the populations analyzed was estimated using the average number of alleles per locus, the proportion of polymorphic loci and the expected heterozygosity [15]. Hardy–Weinberg equilibrium was measured using the Wright’s F [16] statistic. The variance of this statistic was calculated using the procedure of Rasmussen [17]. The significance of this statistic was tested by using the chi-square test. The hierarchical genetic structure of the populations surveyed was estimated using the F-statistics of Wright [16], by means of the FSTAT program [18]. The significance of these statistics was measured with 500 bootstrap permutations of alleles and genotypes within each sample analyzed. Using the FST statistic, indirect gene flow estimates were obtained, where Nm is the product of the effective population size (Ne) by the migration rate per generation (m), assuming an n-dimensional island 2006
754
RUIZ-GARCIA et al.
model, with the equation Nm = [(1/FST) – 1]/4[n/(n – 1)]2, being n the number of populations analyzed [19]. This relationship in based on an island model, where the effects of gene drift and gene flow are balanced in a subdivided population. The stepping-stone models offer gene flow estimates much similar to those obtained with the island model [20] although the values are underestimated for the unidimensional stepping-stone model. Relationships among the three Colombian population studied for genetic structure were determined using the Nei’s D [21], the chord Cavalli-Sforza and Edwards’s [22], and the Prevosti’s [23] genetic distances. To generate different phenetic analyses, three hierarchical algorithm were employed: UPGMA, Single [24] and neighbor-joining [25]. As the results were identical, only the neighbor-joining tree with the Prevosti’s genetic distance is shown here. In addition, a Principal Coordinate Analysis (PCA) was carried out with the different genetic distances employed by using the Gower [26] procedure. To determine possible spatial structure, the Mantel test [27]was used to detect feasible relationships among the genetic distance matrices and the geographic distance matrix. To normalize this test, the method of Smouse et al. [28]was employed. The statistic significance was evaluated with a Mantel’s asymptotic t test and with 2000 Monte Carlo permutations. Maximum parsimony phylogenetics procedures. The basic strategy to determine phylogenetic relationships between different Psorophora populations sampled in different regions of Colombia (some a priori Ps. columbiae and others Ps. toltecum populations), United States (some clearly determined as Ps. columbiae and others as Ps. toltecum) and Mexico (Ps. toltecum) was the presence or absence of different alleles for 16 different isoenzymes studied. Several maximum parsimony procedures were used for this task. Making use of the state of discrete characters, this method allows us to minimize the length of the phylogenies obtained, thereby minimizing the occurrence of parallelism or homoplasies. The different procedures employed here were as follows. Three general methods were used, heuristic, branch-and-bound and exhaustive searches. With the heuristic search, the strategies employed were those named “general” procedure with tree hold at each step using stepwise addition and tree-bisection reconnection branch-swapping performed, the “stepwise addition” procedure by using different methods (simple, closest, as is, and random with 50 repetitions), and the “branchswapping” method with the procedures tree bisectionreconnection, subtree prunning-regrafting, nearestneighbor interchanges and no swapping. The branchand-bound method was computed via stepwise by using the “furthest,” “as is” and “simple” procedures. The third method applied was the exhaustive research procedure.
To select the maximum parsimony trees, several indices were used. They were the tree length (TL), the consistency index (CI), the retention index (RI), the rescaled consistency index (RCI), the homoplasy index (HI), and, in several cases, the CI and HI excluding uninformative characters were calculated as well. To determine the consistency of the diverse internal clades within the trees obtained, a bootstrap analysis by using 500 replicates and generating bootstrap consensus trees retaining groups with frequencies >50%. In those case where more than one maximum parsimony trees was generated, diverse consensus strategies were displayed, being as follows: strict, semistrict, 50% majority rule and Adams consensus trees. To measure quantitatively these consensus trees, several indices were used: the component information (consensus fork) index (FI), the Nelson–Platnick term and total information indices (NPTE, NPTO), the Mickevich consensus index (MI), the Colles weighted consensus fork index (CW), the Schuh–Farris index (SFI) and the Rohlf’s CI(1) and –ln CI(2) indices (R1I and R2I). All these trees were built by using the PAUP 3.1.1 [29], HENNIG86 v. 1.5 and MCLADE 3.0 programs. RESULTS Genetics Analysis of the Colombian Populations Genetic variability statistics. Only 6-PGD and ASAT of eleven loci analyzed were monomorphic in the three populations. The majority of the polymorphic loci did not have more than three alleles and the frequency of the most common allele usually was higher than 0.6 (Table 1). Several rare alleles were observed in Lorica (LAP-C and PGI-C) and Granada (GDH-C) populations. The loci which had the highest number of alleles were MDH (five alleles), IDH and MPI (with four alleles). MDH and MPI showed the highest levels of expected heterozygosity (He). In the case of MDH, He ranged from 0.530 (Granada) to 0.666 (Lorica), whereas, for MPI, He ranged from 0.604 (Ambalema) to 0.684 (Lorica). Loci with the lowest He were α-GDH (Lorica, He = 0.042 and Granada, He = 0.159) and ME (Ambalema, He = 0.188, and Granada, He = 0.315). The average genetic variability statistics for each one of the populations analyzed were as follows. The average number of alleles per locus ranged from 2.5 and 2.8 alleles. The percent of polymorphism was 81.8% in each populations, whereas He ranged from 0.39 (Lorica) to 0.42 (Ambalema), with no significant differences (Student’s t test). Hardy–Weinberg equilibrium (H–W). Table 2 shows comparisons to H–W. Ambalema had the most loci not in equilibrium (5/9 = 55.55%) for a significance level of α = 0.05. The loci in no H–W equilibrium were PGM (heterozygous excess), α-GDH (homozygous excess), PGI (heterozygous excess), HK (homozygous excess), and MPI (homozygous excess). Thus, there was simultaneously a disagreement from
RUSSIAN JOURNAL OF GENETICS
Vol. 42
No. 7
2006
GENETIC STRUCTURE OF THE GENERA PSOROPHORA (DIPTERA: CULICIDAE)
755
Table 1. Allele frequencies and standard deviations of the nine polymorphic isoenzymes of Psorophora columbiae populations studied in Ambalema, Granada and Lorica, Colombia Locus
Ambalema (n = 39–56)
Granada (n = 43–60)
Lorica (n = 49–58)
A
0.547 ± 0.055
0.484 ± 0.057
0.844 ± 0.041
B
0.453 ± 0.055
0.453 ± 0.056
0.141 ± 0.039
C
0.000 ± 0.000
0.063 ± 0.027
0.016 ± 0.014
A
0.854 ± 0.039
0.458 ± 0.056
0.833 ± 0.041
B
0.146 ± 0.039
0.167 ± 0.042
0.125 ± 0.039
C
0.000 ± 0.000
0.357 ± 0.055
0.042 ± 0.023
A
0.667 ± 0.052
0.979 ± 0.016
0.708 ± 0.051
B
0.333 ± 0.052
0.021 ± 0.016
0.167 ± 0.042
C
0.000 ± 0.000
0.000 ± 0.000
0.125 ± 0.037
A
0.083 ± 0.030
0.063 ± 0.027
0.021 ± 0.016
B
0.917 ± 0.030
0.917 ± 0.031
0.979 ± 0.016
C
0.000 ± 0.000
0.021 ± 0.016
0.000 ± 0.000
A
0.341 ± 0.052
0.333 ± 0.053
0.481 ± 0.056
B
0.659 ± 0.052
0.667 ± 0.053
0.481 ± 0.056
C
0.000 ± 0.000
0.000 ± 0.000
0.038 ± 0.022
A
0.139 ± 0.038
0.361 ± 0.054
0.361 ± 0.054
B
0.611 ± 0.054
0.472 ± 0.056
0.403 ± 0.055
C
0.194 ± 0.044
0.153 ± 0.041
0.167 ± 0.042
D
0.056 ± 0.025
0.014 ± 0.013
0.069 ± 0.029
A
0.125 ± 0.037
0.135 ± 0.039
0.118 ± 0.036
B
0.306 ± 0.051
0.135 ± 0.039
0.408 ± 0.055
C
0.528 ± 0.055
0.662 ± 0.054
0.359 ± 0.055
D
0.028 ± 0.018
0.041 ± 0.022
0.079 ± 0.042
A
0.614 ± 0.054
0.806 ± 0.045
0.792 ± 0.046
B
0.043 ± 0.022
0.014 ± 0.013
0.028 ± 0.019
C
0.300 ± 0.051
0.097 ± 0.033
0.139 ± 0.039
D
0.043 ± 0.022
0.083 ± 0.031
0.042 ± 0.023
A
0.067 ± 0.028
0.034 ± 0.020
0.117 ± 0.037
B
0.033 ± 0.019
0.155 ± 0.041
0.000 ± 0.000
C
0.900 ± 0.033
0.810 ± 0.044
0.883 ± 0.036
PGM
HK
PGI
α-GDH
LAP
MPI
MDH
IDH
ME
Note: n is the number of specimens analyzed for each locus. The number of individuals studied for each isoenzyme could be slightly different in each population. The initials of the isoenzymes could be seen in the text. RUSSIAN JOURNAL OF GENETICS
Vol. 42
No. 7
2006
756
RUIZ-GARCIA et al.
Table 2. Deviations of the Hardy–Weinberg equilibrium measured by means of the Wright’s F (1965) statistic with the significance evaluated using the chi-square test Populations
F
df
χ2
–0.828
1
21.969**
HK
0.832
1
16.643**
PGI
–0.500
1
6.000*
1.000
1
24.000**
LAP
–0.193
1
1.529
MPI
0.440
6
20.948**
MDH
–0.158
10
3.814
IDH
–0.296
6
9.218
ME
0.277
3
4.607
PGM
–0.629
3
25.361**
HK
–0.205
3
2.051
PGI
–0.021
1
0.011
α-GDH
–0.072
3
0.253
LAP
–0.269
1
2.827
MPI
0.465
6
23.354**
MDH
0.276
10
11.277
IDH
–0.079
5
0.684
ME
–0.185
3
2.052
PGM
–0.165
3
1.758
HK
0.710
3
24.254**
PGI
0.816
3
32.023**
α-GDH
–0.021
1
0.011
LAP
–0.075
3
0.299
MPI
0.217
6
5.125
MDH
–0.360
6
14.833*
IDH
–0.027
6
0.810
ME
–0.132
1
0.523
Loci
Ambalema PGM
α-GDH
Granada
Lorica
Note: d.f., degree of freedom. * P < 0.05; ** P < 0.001.
the H–W equilibrium for an excess as well as a defect of homo- and heterozygotes, in function of the biochemical markers employed. If the Bonferroni’s method is applied to obtain more precise signification levels, α' = 0.00185 (0.05/27), the loci, which were yet in H–W disequilibrium, were PGM, α-GDH and HK. The populations of Granada and Lorica had 22.22% and 33.33% of their loci significantly different from H–W
equilibrium, respectively. For Granada, the loci with a significant H–W disagreement were PGM (heterozygous excess) and MPI (homozygous excess). For Lorica, the loci which were not in H–W equilibrium were MDH (heterozygous excess), PGI (homozygous excess), and HK (by homozygous excess). Therefore, Ambalema was the population which yielded the highest H–W biased estimates and there were no discernible patterns in the deviations from H–W equilibrium within and between populations. Several examples are to bring out as follows: while PGM and MPI showed a significant heterozygous excess in Ambalema and Granada, this was not found in Lorica. αGDH yielded a significant homozygous excess in Ambalema, but not in Granada and Lorica. On the other hand, PGI and HK showed a significant skew from the H-W equilibrium in Ambalema and Lorica, but not in Granada. Lastly, it is noteworthy that PGI yielded a heterozygous excess in Ambalema, it was in H-W equilibrium, whereas there was a homozygous excess in Lorica. IDH, LAP, and ME were in H–W equilibrium for all three populations studied. Hierarchical population structure. Wright’s F-statistics (FIS, FST, and FIT) for the nine polymorphic markers are shown in Table 3. Significance levels were measured using 500 allele bootstrap permutations within each subpopulation sample to obtain the FIS significance with 95% intervals, 500 allele bootstrap permutations in the total sample to determine the levels of significance of FIT and FST, whereas another 500 genotype bootstrap permutations within the total sample to determine FST significance. LAP did not show any significance for all three F-statistics. The markers, which yielded a significant deviation from 0 at the subpopulation level (FIS), were α-GDH (FIS = 0.421, range for α = 0.05, –0.053–0.185, P = 0.008), MPI (FIS = 0.371, range for α = 0.05, –0.119–0.135, P = 0.002), HK (FIS = 0.265, range for α = 0.05, –0.202– 0.229, P = 0.016), all of them by homozygous excess, and PGM (FIS = –0.600, range for α = 0.05, –0.192– 0.210, P = 0.002) with a striking heterozygous excess, as well as IDH (FIS = –0.143, range for α = 0.05, –0.143– 0.158, P = 0.016–0.032), with a more slight significant heterozygous excess. Likewise, other markers showed negative FIS values, although they were not significant (MDH, ME, and LAP). Despite of this, the overall average FIS for the nine markers employed was low (FIS = 0.022), due a balance of positive and negative values. FST measures genetic heterogeneity among all the populations analyzed. All the loci, excepting α-GDH and LAP, showed significant heterogeneity between populations. Those which showed the most remarkable heterogeneity were HK (FST = 0.171, range for α = 0.05, –0.020–0.038, P = 0.002), PGI (FST = 0.136, range for α = 0.05, –0.020–0.054, P = 0.002), and PGM (FST = 0.133, range for α = 0.05, –0.008–0.017, P = 0.002). Overall, the genetic differentiation among the three
RUSSIAN JOURNAL OF GENETICS
Vol. 42
No. 7
2006
GENETIC STRUCTURE OF THE GENERA PSOROPHORA (DIPTERA: CULICIDAE)
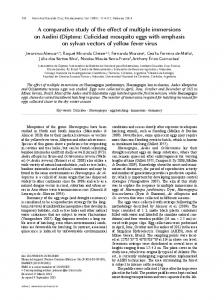
populations analyzed in Psorophora was significant but only moderate (FST = 0.067). The MDH, IDH, ME, and LAP loci showed that they were not significantly affected by striking intrasubpopulational differentiation nor by marked intersubpopulational differentiation (FIT). The average value of FIT was 0.090. Briefly, it was observed that the loci, which hardly discriminated at a intrapopulation level, were PGM, α-GDH, and MPI, as well as those, which discriminated noteworthy at a interpopulation level, were HK, PGI, and PGM. The markers which better discriminated at both levels were α-GDH, HK, PGM, and MPI. Using the average FST statistic, an estimate of the gene flow (Nm) among these three populations was Nm = 1.54, indicating that, in contrast to what was previously believed, there is gene flow among these populations and thus the first evidence that all these populations constituted a single species. Isoenzyme genetics relationships among the Colombian populations analyzed. Figure 1 shows a dendrogram obtained using a neighbor-joining tree with the Prevosti’s genetic distance (all distances offered the same results). The Lorica population, on the Atlantic Coast of Colombia, presented a relevant genetic affinity with one of the Andean central population, Ambalema. It can be commented that the value among Ambalema and Lorica (D = 0.04, Nei’s distance) was only the half than the value obtained among both Andean Psorophora populations. All these values indicated a moderate but existent relationship among the three populations studied. Indeed, there are three loci that link Ambalema and Granada (PGM, GDH, LAP), three loci that link Ambalema and Lorica (HK, PGI, ME) and two loci that link Granada and Lorica (MPI and IDH). Therefore, we have a second evidence in favor of the existence of a single species of Psorophora in the Columbian areas sampled. A principal coordinate analysis, with the Nei’s distance, ratified this result as well. The first coordinate clearly discriminated Granada from Ambalema and Lorica, and, in turn, explained 89% of the overall variance. The second coordinate differentiated Ambalema and Lorica and explained the remaining 11% of the variance. 0.12
0.10
0.08
0.06
757
Table 3. Genetic structure analysis of the three Psorophora populations surveyed in Colombia by means of hierarchical Wright’s F statistics for the nine polymorphic loci Loci
FIS
FST
FIT
–0.600*
0.133*
–0.388*
HK
0.265*
0.171*
0.391*
PGI
0.179
0.136*
0.290*
α-GDH
0.421*
PGM
LAP
–0.137
MPI
0.371*
–0.009 0.021 0.026*
0.415* –0.149 0.388*
MDH
–0.087
0.049*
–0.033
IDH
–0.143*
0.043*
–0.094
ME
–0.033
0.027*
–0.005
0.022
0.067
0.090
Average
Note: FIS is fixation index of individuals relative to the subpopulations; FIT is fixation index of individuals relative to the total Psorophora population; FST is degrees of genetic heterogeneity among the subpopulations analyzed. * P < 0.05.
Relationships among the genetic and geographic distances. Although the number of populations analyzed is clearly limited, the possible relationship among the genetic distances employed and the geographic distances of separation among these populations was analyzed. By using the normalized Mantel’s test, with a significant level calculated throughout 500 Monte Carlo permutations, it was put forward an inexistent relationship among the genetic distance matrices (Nei, Cavalli-Sforza and Prevosti) and the geographic distance matrix (r = 0.113, r = 0.084, and r = 0.146, respectively). This means that the geographic distance did not significantly explain the genetic distances obtained between the populations analyzed. This insignificant correlation pointed out the no existence of some kind of geographic isolation among Lorica and the populations of the Andes. This result suggested another
0.04
0.02
0 Ambalema (Tolima) Central Andes Lorica (Atlantic Caribbean) Granada (Meta) Andes
Fig. 1. Neighbor-joining dendrogram with the Nei’s genetic distance between three Colombian populations of Psorophora using 9 polymorphic isoenzymes. RUSSIAN JOURNAL OF GENETICS
Vol. 42
No. 7
2006
758
RUIZ-GARCIA et al.
Table 4. Genotypes found at isoenzyme loci in four Psorophora populations in Colombia and two United States populations Loci
Lorica (Colombia)
Granada (Colombia)
Puerto Boyaca (Colombia)
Ambalema (Colombia)
Galveston (United States)
Thermal (United States)
ACO-1
AA
AA
AA
AA
AA
AA
ACPH
AA
AA
AA
AA
AA
BB
ADK
AA
AA
AA
AA
AA
AA
FUM
AA
AA
AA
AA
AA
AA
α-GDH
AA
AA
AA
AA
AA
AA
GOT-1
AA
AA, AE
AA
AA
AA, AE
CC
GOT-2
AA, AD
AA
AA
AA
AA
AA
HADH
AA
AA
AA
AA
AA
AA
HK-1
AA
AA
AA
AA
AA
AA
HK-2
AA
AA
AA
AA
AA
AA
HK-3
AA
AA
AA
AA
AA
AA
IDH
AA
AA
AA
AA
AA
BB
MDH-1
AA
AA
AA
AA
AA
AA
ME
AA
AA
AA
AA
AA
AA
PGM
AA
AA
AA
AA
AA
AA
Note: These genotypes were employed in a maximun parsimony analysis.
striking evidence in favor of the existence of a single Psorphora species in the Atlantic and in the Central Andean Colombian areas surveyed. Phylogenetics Relationships between Psorophora Populations from Colombia and United States The previous results clearly pointed out that only one species is presented in the Colombian area sampled. But what is this species? To resolve this enigma, firstly we analyzed 16 isoenzymes for several mosquitoes from four Colombian populations (Ambalema, Puerto Boyacá and Granada, presumably Ps. columbiae; Lorica, Caribbean Atlantic Coast, presumably Ps. toltecum) and from two United States populations (Galveston, Texas, presumably Ps. columbiae; Thermal, California, presumably Ps. toltecum). As the number of individuals analyzed was low, maximum parsimony analyses were carried out for presence-absence of alleles in these populations. In Table 4, the genotypes of the 16 isoen-
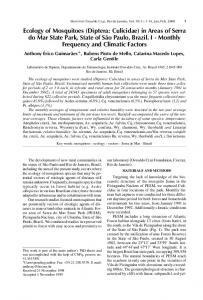
zymes analyzed for the different individuals and populations are shown. Practically, all the maximum parsimony procedures employed showed the same results (Fig. 2). There were four maximum parsimony trees, 720 rearrangements and 13 steps. The unique exceptions were the methods of heuristic stepwise addition with the “as is” and the “random” procedures which showed 744 rearrangements and the branch swapping method with the “subtree–pruning–regrafting” procedure which yielded 528 rearrangements. The exhaustive method analyzed 135 135 trees and four maximum parsimony trees were found as well. In the seven mosquitoes from Lorica and Granada appeared two different genotype combinations (haplotypes) in each sample. The same was true for the two individuals analyzed from Galveston (Texas), where two haplotypes were found. Within the other samples (Thermal, Ambalema, and Puerto Boyacá) no variation was discovered. All the four maximun parsimony trees showed Thermal (Ps. toltecum) as the most
Fig. 2. (a–d) The four maximum parsimony trees inferred from isoenzyme variability in four Colombian populations and two United States populations of Psorophora columbiae and Ps. toltecum. (e) The semi-strict consensus tree of the four maximum parsimony trees. Component information (consensus fork) = 2 (normalized = 0.333); Nelson-Platnick term information = 5; Nelson-Platnick total information = 7; Mickevich’s consensus information = 0.333; Colles weighted consensus information = 0.259; Schuh–Farris levels sum = 0.294; Rohlf’s CI (1) = 6.061 and Rohlf’s – lnCI (2) = 0.00233. RUSSIAN JOURNAL OF GENETICS
Vol. 42
No. 7
2006
GENETIC STRUCTURE OF THE GENERA PSOROPHORA (DIPTERA: CULICIDAE) (a)
(b) Thermal-1 (California, United States)
Thermal-1 (California, United States)
Lorica-1 (Cordoba, Colombia)
Lorica-1 (Cordoba, Colombia)
Lorica-2 (Cordoba, Colombia)
Lorica-2 (Cordoba, Colombia) Granada-1 (Meta, Colombia)
Granada-1 (Meta, Colombia)
Granada-2 (Meta, Colombia)
Puerto Boyaca (Boyaca, Colombia)
Galveston-2 (Texas, United States)
Ambalema (Tolima, Colombia)
Puerto Boyaca (Boyaca, Colombia)
Galveston-1 (Texas, United States)
Ambalema (Tolima, Colombia)
Granada-2 (Meta, Colombia)
Galveston-1 (Texas, United States)
Galveston-2 (Texas, United States)
(c)
(d)
Thermal-1 (California, United States) Lorica-1 (Cordoba, Colombia)
Lorica-1 (Cordoba, Colombia)
Lorica-2 (Cordoba, Colombia)
Lorica-2 (Cordoba, Colombia)
Granada-1 (Meta, Colombia)
Granada-1 (Meta, Colombia)
Puerto Boyaca (Boyaca, Colombia)
Puerto Boyaca (Boyaca, Colombia)
Ambalema (Tolima, Colombia)
Ambalema (Tolima, Colombia)
Granada-2 (Meta, Colombia)
Galveston-1 (Texas, United States)
Galveston-2 (Texas, United States)
Granada-2 (Meta, Colombia)
Galveston-1 (Texas, United States)
(e)
Galveston-2 (Texas, United States)
Thermal-1 (California United States) Lorica-1 (Cordoba, Colombia) Lorica-2 (Cordoba, Colombia) 50
Granada-1 (Meta, Colombia) Puerto Boyaca (Boyaca, Colombia) Ambalema (Tolima, Colombia)
100
Granada-2 (Meta, Colombia) Galveston-2 (Texas, United States) Galveston-1 (Texas, United States)
RUSSIAN JOURNAL OF GENETICS
Vol. 42
No. 7
Thermal-1 (California, United States)
2006
759
760
RUIZ-GARCIA et al.
divergent populations and in no case it was clustered with other population. One of the haplotypes of Granada was clustered with one of the haplotypes of Galveston (Ps. columbiae) as well as the two haplotypes of Lorica (“a priori” Ps. toltecum) were grouped, in the four trees, with the haplotypes of Ambalema, Puerto Boyacá, and one of the haplotypes of Granada and Galveston (Texas). Different consensus trees (Strict, Semistrict, Majority rule, Adams) ratified the results commented. For instance, the clade conformed for one of the haplotypes of Granada and one from Galveston was highly consistent (bootstrap, 100%). The consensus indices could be seen in the text of Fig. 2. Therefore, here we present another outstanding evidence which agrees quite well with the fact that the Caribbean Lorica Psorophora population is not differentiated from the Colombian Andean Psorophora populations as it was previously believed. Even it seems clear that the species presented in Colombia is Ps. columbiae and no Ps. toltecum. DISCUSSION Genetic Diversity The number of alleles per locus found in the Colombian Psorophora studied (2.5–2.8) was some higher than to that reported in other diptera species such as Lutzomyia trapidoi (1.57–2.29) [5], Aedes aegypti in Thailand (1.6–2.1) [30], in Brazil (1.6–2.1) [31] and in Argentina (1.3–1.8) ([32], Ae. albifasciatus (1.7–2.1) [33], Ae. dorsalis, Ae. campestris, Ae. melanimon (1.2– 2.3, 1.2–1.9, and 1.3–2.6, respectively) [34], Anopheles nuñeztovari (1.4–2.1) [35], An. trinkae and A. rangeli (1.7 and 1.2–2.0, respectively) [36] but similar to that determined by Kassem et al. [37] for five wild populations of Plebotomus papatasi, as well as Gimnig et al. [38] for populations of Culex tarsalis in California (1.9–3.2). This could be motivated by the selection of the markers employed in this study for the studied genetic structure of Psorophora in Colombia, due to that there was a skew in favor of markers which had been presented polymorphism in another organisms. However, in the major fraction of these other studies commented, the selection of the isoenzyme markers chosen was similar to that carried out here and, in addition, several of these isoenzymes are the same. The results of He for each one of the populations studied (0.39–0.42) were very similar to that reported by other authors, such as Dinardo-Miranda and Contel [31], for populations of Ae. aegypti from Brasil (0.48– 0.53), but higher than the He values found in another diptera species such as Ae. dorsalis, Ae. campestris, Ae. melanimon (0.029–0.111, 0.032–0.098, and 0.046– 0.111, respectively) [34], L. carrerai and L. yucumensis (0.120–0.145) [39], L. longipalpis (0.036), E. solidaginis (0.009–0.028) [40], Anopheles nuñeztovari, An. trinkae and A. rangeli (0.037–0.100, 0.069, and 0.094–0.113, respectively) [36], Culex tarsalis (0.097–
0.22) [38], Ae. aegypti from Argentina (0.091–0.153) [32], Ae. aegypti from Thailand (0.07–0.27) [30], Lutzomyia shannoni (0.16–0.22) [41], as well as significantly lower than other species such as Ae. albifasciatus (0.47–0.74, mean of 0.60) [33] or A. darlingi (H = 0.693) [42]. Therefore, our samples of Psorophora presented levels of genetic diversity more elevated than those found in a wide range of other mosquito species when the most unskewed genetic variability statistic, He, was employed. These high genetic diversity levels could indicate that the effective numbers of the populations analyzed could be large enough to possibility an important amount of gene flow between them and that only one taxa of Psorophora is presented in the Colombian Caribbean coast and the central Andean mountains. Generally, those insect species with widespread geographic areas appear to have considerable levels of gene diversity at a mtDNA and allozyme levels, such as it was observed in Papilio machaon [43] and in D. simulans [44]. Nevertheless, the levels of genetic variability in other mosquito species are substantially superior when other kind of molecular markers, such as microsatellite loci have been used, showing the limited genetic variation found with isoenzymes. This was the case Anopheles gambiae in Kenyan populations (0.59–0.70) [45] and An. maculatus in Thailand (0.83–0.92) [46], for instance. These levels of genetic variability are similar to those found in several mammal and other insect species with DNA microsatellites [47–52]. For this reason, microsatellite are desired markers to be applied to Ps.columbiae for future studies. Hardy–Weinberg Equilibrium Deviations from the H–W equilibrium were detected for homozygous excess as well as for heterozygous excess, although the first predominated. These deviations were presented in all the populations analyzed. The Ambalema population had the highest number of loci in H–W disequilibrium. H–W deviations were mainly at three loci: PGI, HK, and MPI. In other studies, similar results have been obtained. For instance, P. papatasi from Egypt showed 30 significant deviations out 73 analyses and 12 of 17 loci investigated had a homozygous excess [37]. The inexistence of H–W equilibrium by homozygous excess was determined for Lutzomyia presented in Paraiso Escondido and La Tablada (Ecuador) by Dujardin et al. [5]. Furthermore, several markers, such as 6-PGD, FUM, PFK and PGM presented homozygous excess in L. townsendi and L. longiflocosa [7]. Cárdenas et al., [41] showed an elevated departure from H–W equilibrium in Lutzomyia shannoni in Colombia for EST-2, Fum, GPD, AK, ME, and GPI by homozygous excess, although PGI showed heterozygous excess in one population. They claimed the possibility of endogamy in that case. Paupy et al. [53] demonstrated that the urban Ae. aegypty from Tahiti and Moorea (French Polynesia) showed significant
RUSSIAN JOURNAL OF GENETICS
Vol. 42
No. 7
2006
GENETIC STRUCTURE OF THE GENERA PSOROPHORA (DIPTERA: CULICIDAE)
homozygous excess for the HK2, MDH, and MPI loci, whereas the rural populations did not. These authors concluded that the insecticides in urban environments create numerous mosquito breeding sites within cities with continuous genetic bottlenecks and recolonization [54] and this facilities the Wahlund effect (subdivision effect), which creates homozygous excess. Likely, Gimnig et al. [38] detected 21.8% of H–W deviations by homozygous excess in Californian populations of Culex tarsalis mainly happening at the loci PGM, MDH-2, PGD, and AAT. The Wahlund effect was suggested by seasonal variation of allele frequencies due to seasonal fluctuation of this species or by immigration of genetically distinct individuals. Dinardo-Miranda and Contel [31] also found a significant homozygous excess at the loci LAP2, MDH-1, and ME probably by Wahlund effect in populations of Ae. aegypti from Brazil. In an identical way, Rongnoparut et al. [46] showed that four microsatellite loci analyzed in a Thailand population of An. maculatus presented significant excess of homozygous for the four markers. However, sampling effects by the large numbers of alleles found and small number of specimens examined or mutation or deletion at the PCR primer binding site were invoked in that case. Indeed, the Wahlund effect has been reiteratively claimed to explain the deviations relative to the H–W equilibrium by the inclusion of different subspecies, or by the presence of cryptic species, unknown at the sample moment [5, 37, 55]. In our sample, we observed heterozygous deficiencies for certain loci as well as heterozygous excess for other loci. Prosimulium mixtum [56] also simultaneously had homozygous (MDH-2 and LDH) and heterozygous excess (IDH and PGI) loci. Although some biochemical markers presented homozygous excess, several markers, such as MDH, ME or LAP, were in H–W equilibrium and PGM yielded a clear heterozygous excess, which is not compatible with generalized endogamy. The Wahlund effect, which could explain the homozygous excess in loci such as α-GDH, HK or MPI, has been invoked in the major fraction of the quoted works to explain homozygous excess. That is, little local Wahlund effects could explain the cases of homozygous excess in our study. However, how could be explained the loci which showed a heterozygous excess? Perhaps the explanation resides in the existence of selection in favor of heterozygotes at some loci (heterotic or overdominance selection). For example, some results obtained by other authors could be a relevant explanation. Coosemans et al. [57] found that infected An. gambiae with Plasmodium falciparum showed significant genetic differences from the non-infected ones. Allelic and genotypic frequencies were significantly different for MPI and ACP. The homozygote carriers of the allele MPI-130 were significantly more infected by P. falciparum than the six other genotypes presented in the samples studied by these authors. Another feasible explanation to understand the heterozygous excess at the PGM loci is that invoked by Conn et al. [58] and RUSSIAN JOURNAL OF GENETICS
Vol. 42
No. 7
761
Scarpassa et al. [35] throughout a hypothesis of Nevo [59]. These authors suggested that an excess of heterozygotes could be due either to epistatic interactions or to frequency-dependent selection. Scarpassa et al. [35] explained the excess of heterozygotes at the MDH locus with the 2La and/or 2Lb inversions of the polytene chromosomes observed in populations of An. nuñeztovari in western Venezuela and in several Colombian localities (hitchhiking effect). This explanation could be also useful for understanding the current genetic structure of Psorophora in Colombia. Genetic Distances and Genetic Heterogeneity Several authors, such as Rice and O’Brien [60], Ahmad et al. [61], and Ruiz-Garcia [62], showed that populations genetically identical showed Nei’s genetic distance (Dn) < 0.02, while the populations more slightly related presented values of 0.08 > Dn > 0.02 and populations hardly divergent yielded Dn values > 0.12. As it was observed the genetic distance among Ambalema and Lorica was enough little (D = 0.04) to be considered both populations members of a same taxa. In addition, both populations presented a value of D = 0.07– 0.08 regard to the other Andean population, Granada, which is within the range of populations more or less related from a genetic standpoint. Hence, the three Colombian Psorophora populations studied are part of a same taxa, which does not agree with the hypothesis of Lanzaro [4] in favor of the existence of two different Psorophora taxa in the Caribbean Atlantic coast of Colombia and other in the Andean mountains of this country. Several comparative genetic distance results put forward that the Nei’s values obtained reflected that all these Colombian populations are part of a single species. Ayala [63] obtained genetic distances from 0.15 to 0.18 for subspecies in given species of Drosophila and from 0.19 to 0.21 for incipient species. For instance, the Nei’s distance among cryptic species of Lutzomyia trapidoi was 0.211 and similar results were obtained among other mosquito species, such as L. carrerai and L. yucumensis (D = 0.256) [39], An. gambiae and An. arabiensis (D = 0.31) [57], An. rangeli and An. trinkae, or An. rangeli and An. nuñeztovari (D = 0.149– 0.197, 0.286, respectively) [36]. Even, the values of the genetic distances presented here are smaller to that reported between populations of other mosquito species, such as An. nuñeztovari from Brazil and Colombia (D = 0.125) [35]. A similar case occurred within Haematobia irritans (D = 0.011) and within P. papatasi (D = 0.0072) [37]. On the contrary, several diptera species highly differentiated at a morphologic level, such as L. longiflocosa, L. quasitownsendi, and L. sauroida presented Nei’s genetic distances noteworthy lower (D = 0.01) [7]. Also Gimnig and Eldridge [34] did not practically detected any genetic isoenzyme differences among Ae. campestris and Ae. melanimon. 2006
762
RUIZ-GARCIA et al.
Thus more evidence in favor of the existence of a single species is obtained. The three loci, which yielded the highest FST values were PGM, HK, and PGI (0.133, 0.171, and 0.136, respectively). It is possible that the diversifying natural selection was acting upon these loci more intensively than upon the remainder loci analyzed. The gene flow estimate among all the populations analyzed were sufficiently righ to reveal the three populations as a members of a single species (Nm = 1.54). The genetic differentiation found among Lorica and the other two Andean populations was clearly small, showing the existence of a current gene flow among them or that these populations have been separated in recent times.
Tehuantepec-1 (Western Mexico) Ps. toltecum Tehuantepec-2 (Western Mexico) Ps. toltecum College-Station (Texas, United States) Ps. columbiae Lorica (Cordoba, Colombia) Kerville-1 (Texas, United States) Ps. columbiae Kerville-2 (Texas, United States) Ps. columbiae
Phylogenetics Relationships among Colombian and Other United States Psorophora Populations
Fig. 3. Only one maximum parsimony tree was found using ITS2 (rDNA) sequences of a length of 365 base pairs. Clearly the population of Lorica (Cordoba, Colombia) showed a higher phylogenetic relationship with the populations of Psorophora columbiae from United States than with the Ps. toltecum populations from Mexico.
Sometimes, this situation is more complex depending of the molecular markers employed. Conn et al. [58] showed that An. aquasalis and An. rangeli have a common conserved HindIII site at 1295 in the tRNATrp gene, which they did not share with other Anopheles species. Nevertheless, they are considered from a morphological point of view more closely related to An. oswaldoi (An. aquasalis) and An. nuñeztovari (An. rangeli), respectively. Thus, to solve systematic conflicts, many different morphological and molecular markers are required. Although a significant degree of genetic heterogeneity among the three populations analyzed was obtained, it was relatively scarce (FST = 0.067). Other insect populations have presented similar genetic differentiation levels as follows: An. gambiae showed, in two Kenyan populations (Jego and Asembo), a value of FST = 0.072 – 0.10 [45], although the genetic differentiation was conspicuously lower in other African areas separated by 6000 km (FST = 0.016) [64]. Cárdenas et al. [41] showed that several populations of Lu. shannoni in Colombia presented a FST = 0.061 as well as De Souza et al. [32] showed a similar population differentiation in A. aegypti from Argentina (FST = 0.065) and among Prosimulium mixtum populations (FST = 0.096) despite that other species, like several An. nuñeztovari populations in Colombia and Brazil was substantially greater (FST = 0.324) as well as several other cases showed an underlying lower genetic heterogeneity (Ae. aegypti from Brazil, FST = 0.018 [31], Ae. albifasciatus from Argentina, FST = 0.003 [33], or P. fuscum, FST = 0.003 [56]) than the mosquito populations here analyzed.
First Lanzaro [4], and later Hernández et al. [65], affirmed that the Psorophora population of the Caribbean Atlantic Colombian coast could be grouped within Ps. toltecum, meanwhile the Andean populations could be associated with Ps. columbiae, exhibiting some kind of hybrid zone among their distributions as it is happening in the United States and Mexico. These second authors found karyotype differences among two Colombian stocks, one from Lorica (Atlantic coast) and the other from Granada (Andean region). These results showed remarkable differences in several chromosome characteristics such as short arms, long arms, arm ratio, total length, relative length, centromeric index, and relative length of the chromosomes in the metaphases analyzed, as well as in the C and G band patterns. In addition, the constitutive heterochromatin presented higher amount in the Lorica than in the Granada population (C-band pattern) as well as the number of bands in each chromosome were different among both populations (G-band pattern). These karyotype findings seem to be in agreement with the hypothesis of Lanzaro [4]. However, we must remember that populations, which were undifferentiated at an allozyme level (Prosimulium fuscum; FST = 0.003), have exceptionally shown elevated values of genetic heterogeneity at the karyotype level (FST = 0.421) [66]. Nonetheless, the present results by means of nine polymorphic isoenzymes between three distant Colombian areas and 16 isoenzymes comparing some individuals of four Colombian populations (three Andean and one Caribbean) and two populations from the United States (one Ps. columbiae and the other Ps. toltecum) revealed the existence of a single taxa in Colombia and that this species is extremely similar from a genetic point of view to the United States populations classified as Ps. columbiae. We have other (unpublished) results, which agree quite well with this affirmation. ITS2 sequences (CP-P1A and CP-P1B primers) of 356 base
RUSSIAN JOURNAL OF GENETICS
Vol. 42
No. 7
2006
GENETIC STRUCTURE OF THE GENERA PSOROPHORA (DIPTERA: CULICIDAE)
763
Table 5. Lake’s method of phylogenetic invariants (quartet procedure) applied to two Mexican Psorophora toltecum populations and three United States Psorophora columbiae as well as to the Colombian Lorica population Tehuantepec-1 Tehuantepec-2 College Station (Ps. toltecum) (Ps. toltecum) (Ps. columbiae)
Lorica (Cordoba)
Kerville-1 Kerville-2 (Ps. columbiae) (Ps. columbiae)
Tehuantepec-1 (Ps. toltecum)
–
0(0)
1(1)
1(1)
1(0)
1(0)
Tehuantepec-2 (Ps. toltecum)
2(1)
–
1(1)
1(1)
1(0)
1(0)
College Station (Ps. columbiae)
0(0)
0(0)
–
0(0)
0(0)
0(0)
Lorica (Cordoba)
0(0)
0(0)
1(1)
–
0(0)
0(0)
Kerville-1 (Ps. columbiae)
0(0)
0(0)
0(0)
0(0)
–
0(0)
Kerville-2 (Ps. columbiae)
0(0)
0(0)
0(0)
0(0)
1(0)
–
Note: This analysis reveals that the Colombian samples belong to Psorophora columbiae. Above main diagonal matrix, number of times that the ITS2 sequences was rejected among population pairs. Below main diagonal matrix, number of times that the ITS2 sequences was accepted among population pairs. P = 0.05. Within parenthesis, P = 0.001.
pairs were obtained by us for some of these individuals. Only one maximum parsimony tree with 294 steps was found for all the methods and procedures employed (Fig. 3). The major fraction of the procedures determined 30 rearrangements with the exception of two branch-swapping procedures (“nearest-neighbor interchanges” and “no swapping”), which effectuated only six rearrangements. The exhaustive search analyzed 105 trees and only one maximum parsimony tree with 294 steps was found as well. This analysis clearly showed as a sequence of Psorophora obtained from an individual from Lorica was grouped with the ITS2 sequence of several mosquitoes from College Station, in Texas, belonging to Ps. columbiae. Both, in turn, were clustered with two sequences of Ps. columbiae proceeding from Kerville (Texas). On the contrast, the sequences of various individuals of Ps. toltecum from Tehuantepec (Mexico) were highly divergent of all these sequences of Ps. columbiae, including the Lorica sequence. The Lake’s method for phylogenetic invariants (Table 5) showed that the Lorica sequence was significantly superimposed with the College Station sequence (Ps. columbiae) and significantly rejected from those of Tehuantepec (Ps. toltecum). All the evidences yielded agree quite well with the fact that only one species is presented in the Colombian area sampled (Caribbean and Andes mountains) and that species is Ps. columbiae. Future studies in southern Colombia are needed to determine the possible presence of Psorophora confinnis by means of different molecular markers. ACKNOWLEDGMENTS The authors thank Jaime Rodriguez and Jesus Escobar for their assistance with the Psorophora collections in Colombia. Thanks go to Dr. Lanzaro to assist to FeRUSSIAN JOURNAL OF GENETICS
Vol. 42
No. 7
lio Bello and for providing all the United States and Mexico biological material. This work was financed jointly by Colciencias (grant 1243-05-278-97), La Salle University, Pontificia Universidad Javeriana, and the Colombian National Institute of Health. REFERENCES 1. Venezuelan Encephalitis, PAHO–Panamerican Sanitary Bureau, scientific publication no. 243, Washington, DC, 1972, pp. 157–161. 2. Olano, V.A. and Morales, A., Colonización de una cepa de Psorophora confinnis (Grabhamia) Arribalzaga, 1891 en Colombia, Biomédica, 1981, vol. 1, pp. 12–15. 3. Sanmartin, C., Mackenzie, R.B., Trapido, H., et al., Encefalitis equina venezolana en Colombia, Bol. Ofic. Sanit. Panam., 1977, vol. 74, pp. 108–137. 4. Lanzaro, G.C., Genetics of the Mosquito Vector of Epidemic Venezuelan Equine Encephalitis, in Advanced Res. Program, Texas: A&M University, 1977. 5. Dujardin, J.P., Le Pont, F., Cruz, M., et al., Cryptic Speciation in Lutzomyia (Nyssomyia) trapidoi (Fairchild & Hertig) (Diptera: Psychodidae) Detected by Multilocus Enzyme Electrophoresis, Am. J. Trop. Med. Hyg., 1996, vol. 54, pp. 42–45. 6. Besansky, N.J., Powell, J.R., Caccone, A., et al., Molecular Phylogeny of the Anopheles gambiae Complex Suggest Genetic Introgression between Principal Malaria Vectors, Proc. Natl Acad. Sci. UNITED STATES, 1994, vol. 91, pp. 6885–6888. 7. Kreutzer, R.D., Palau, M.T., Morales, A., et al., Genetic Relationships Among Phlebotomine Sand Flies (Diptera: Psychodidae) in the verrucarum Species Group, J.Med. Entomol., 1990, vol. 27, pp. 1–8. 8. Byrne, K. and Nichols, R.A., Culex pipiens in London Underground Tunnels: Differentiation between Surface 2006
764
9.
10.
11.
12.
13.
14. 15. 16. 17.
18.
19. 20.
21. 22. 23. 24.
RUIZ-GARCIA et al. and Subterranean Populations, Heredity, 1999, vol. 82, pp. 7–15. Ward, R.D., Pasteur, N., and Rioux, J.A., Electrophoretic Studies on Genetic Polymorphism and Differentiation of Phlebotomine Sand Flies (Diptera: Psychodidae) from France and Tunisia, Ann. Trop. Med. Parasitol., 1981, vol. 75, pp. 235–245. Peterson, J.L., Preliminary Survey of Isoenzyme Variation in Anthropophilic Panamanian Lutzomyia Species, in Biochemical Characterization of Leishmania, Chance M.L., and Walton B.C., Eds., Geneva, 1982, pp. 104–114. Singh, R.S. and Rhomberg, L.R., A Comprehensive Study of Genetic Variation in Natural Populations of Drosophila melanogaster. II. Estimates of Heterozygosity and Patterns of Geographic Differentiation, Genetics, 1987, vol. 117, pp. 255–271. Parkash, R. and Yadav, J.P., Geographical Clinal Variation at Seven Esterase-Coding Loci in Indian Populations of Zaprionus indianus, Hereditas, 1993, vol. 119, pp. 161–170. Larruga, J.M., Cabrera, V.M., González, A.M., and Gullón, A., Molecular and Chromosomal Polymorphism in Continental and Insular Populations from the Southwestern Range of Drosophila subobscura, Genetica, 1983, vol. 60, pp. 191–205. Kreutzer, R.D. and Christensen, H.A., Characterization of Leishmania spp. by Isozyme Electrophoresis, Am. J. Trop. Med. Hyg., 1980, vol. 29, pp. 199–208. Nei, M., Analysis of Gene Diversity in Subdivided Populations, Proc. Natl. Acad. Sci. UNITED STATES, 1973, vol. 70, pp. 3321–3323. Wright, S., The Interpretation of Population Structure by F-Statistics with Special Regard to Systems of Mating, Evolution, 1965, vol. 19, pp. 395–420. Rasmussen, D.I., Blood Groups Polymorphism and Inbreeding in Natural Populations of the Deer Mouse, Peromyscus maniculatus, Evolution, 1964, vol. 18, pp. 219–229. Goudet, J., FSTAT, a Program for IBM PC Compatiblers to Calculate Weir and Cockerham’s (1984) Estimators of F-Statistics (Version 1.2), J. Hered., 1995, vol. 86, pp. 344–345. Takahata, N., Gene Identity and Genetic Differentiation of Populations in the Finite Island Model, Genetics, 1983, vol. 104, pp. 497–512. Crow, J.F. and Aoki, K., Group Selection for a Polygenic Behavioral Trait: Estimating the Degree of Population Subdivision, Proc. Natl Acad. Sci. UNITED STATES, 1984, vol. 81, pp. 6073–6077. Nei, M., Estimation of Average Heterozygosity and Genetic Distance from a Small Number of Individuals, Genetics, 1978, vol. 89, pp. 583–590. Cavalli-Sforza, L.L. and Edwards, A.W.F., Phylogenetic Analysis: Models and Estimation Procedures, Amer. J. Hum. Genet., 1967, vol. 19, pp. 233–257. Prevosti, A., La distancia genética entre poblaciones, Miscellanea Alcobé, 1974, vol. 10, pp. 109–118. Sneath, P.H.A. and Sokal, R.R., Numerical Taxonomy, San Francisco: Freeman, 1973.
25. Saitou, N. and Nei, M., The Neighbor-Joining Method: A New Method for Reconstructing Phylogenetic Trees, Mol. Biol. Evol., 1987, vol. 4, 406–425. 26. Gower, J.C., Some Distance Properties of Latent Root and Vector Methods used in Multivariate Analysis, Biometrika, 1966, vol. 53, pp. 325–338. 27. Mantel, N.A., The Detection of Disease Clustering and a Generalized Regression Approach, Cancer Res., 1967, vol. 27, pp. 209–220. 28. Smouse, P.E., Long, J.C., and Sokal, R.R., Multiple Regression and Correlation Extension of the Mantel Test of Matrix Correspondence, Syst. Zool., vol. 35, pp. 627– 632. 29. Swofford, D.L., PAUP: Phylogenetic Analysis Using Parsimony, Version, 3. 1. User’s Manual, Illinois Natural History Survey: Champaign, 1993. 30. Lerdthusnee, K. and Chareonviriyaphap, T., Comparison of Isoenzyme Patterns of Aedes aegypti Populations Collected from Pre-and Post-Bacillus thuringensis israelensis Treatment Sites in Thailand, J. Amer. Mosquito Control Assoc., 1999, vol. 15, pp. 48–52. 31. Dinardo-Miranda, L.L. and Contel, E.P.B., Enzymatic Variability in Natural Populations of Aedes aegypti (Diptera: Culicidae) from Brazil, J. Med. Entomol., 1996, vol. 33, pp. 726–733. 32. De Souza, G.B., Avilés, G., and Gardenal, G.N., Allozymic Polymorphism in Aedes aegypti Populations from Argentina, J. Amer. Mosquito Control Assoc., 2000, vol. 16, pp. 206–209. 33. De Souza, G.B., Blanco, A., and Gardenal, C.N., Genetic Structure of Aedes albifasciatus (Diptera: Culicidae) from a Marsh Ecosystem in Córdoba, Argentina, J. Med. Entomol., 1996, vol. 33, pp. 531–536. 34. Gimnig, J.E. and Eldridge, B.F., Genetic and Morphological Characterization of the Aedes (Ochlerotatus) dorsalis (Diptera: Culicidae) Group in North America, J. Med. Entomol., 1999, vol. 36, pp. 685–694. 35. Scarpassa, V.M., Tadei, W.P.., and Suárez, M.F., Population Structure and Genetic Divergence in Anopheles nuneztovari (Diptera: Culicidae) from Brazil and Colombia, Amer . J. Trop. Med. Hyg., 1999, vol. 60, pp. 1010–1018. 36. Fritz, G.N., Bermúdez, H., and Seawright, J.A., Genetic Differentiation and Diagnostic Loci of Anopheles nuñeztovari, An. trinkae, and An. rangeli (Diptera: Culicidae), J. Med. Entomol., 1995, vol. 32, pp. 663–672. 37. Kassem, H.A., Fryauff, D.J., Shetata, M.G., and Sawaf, B.M., Enzyme Polymorphism and Genetic Variability of One Colonized and Several Field Populations of Phlebotomus papatasi (Diptera: Psychodidae), J. Med. Entomol., 1993, vol. 30, pp. 407–413. 38. Gimnig, J.E., Reisen, W.K., Eldridge, B.F., et al., Temporal and Spatial Genetic Variation within and among Populations of the Mosquito Culex tarsalis (Diptera: Culicidae) from California, J. Med. Entomol., 1999, vol. 36, pp. 23–29. 39. Gaillard, T., Tibayrenc, M., Le Pont, F., et al., Diagnosis by Isozyme Methods of two Ciyptic Species, Psychodopygus carrerai and P. Yucumensis (Diptera: Psychodidae), J. Med. Entomol., 1986, vol. 23, pp. 489–492. 40. Waring, G.L., Abrahamson, W.G., and Howard, D.J., Genetic Differentiation among Host-Associated Popula-
RUSSIAN JOURNAL OF GENETICS
Vol. 42
No. 7
2006
GENETIC STRUCTURE OF THE GENERA PSOROPHORA (DIPTERA: CULICIDAE)
41.
42.
43.
44.
45.
46.
47.
48.
49.
50.
51.
52.
tions of the gallmaker Eurosta solidaginis (Diptera: Tephritidae), Evolution, 1990, vol. 44, pp. 1648–1655. Cárdenas, E., Munstermann, L.E., Martinez, O., et al., Genetic Variability among Populations of Lutzomyia (Psathyromyia) shannoni (Dyar 1929) (Diptera: Psychodidae: Phlebotominae) in Columbia, Mem. Inst. Oswaldo Cruz, 2001, vol. 96, pp. 189–196. Freitas-Sibajev, M.G.R., Conn, J., and Mitchell, S.E., Mitochondrial DNA and Morphological Analyses of Anopheles darlingi (Diptera: Culicidae) Populations from Brazil, Mosq. Syst., 1995, vol. 27, pp. 78–99. Sperling, F.A.H., and Harrison, R.G., Mitochondrial Variation within and between Species of the Papilio machaon Group of Swallowtail Butterflies, Evolution, 1994, vol. 48, pp. 408–422. Baba-Aissa, F., Solignac, M., Deneebuiy, N., and David, J.R., Mitochondrial DNA Variability in Drosophila simulans: Quasi Absence of Polymorphism within Each of the Three Cytoplasmic Races, Heredity, 1988, vol. 61, pp. 419–426. Lehmann, T., Hawley, W.A., Grebert, H., and Collins, F.H., The Effective Population Size of Anopheles gambiae in Kenya: Implications for Population Structure, Mol. Biol. Evol., 1998, vol. 15, pp. 246–276. Rongnoparut, P., Yaicharoen, S., Sirichoptakorn, N., et al., Microsatellite Polymorphism in Anopheles maculates, a Malaria Vector in Thailand, Amer. J. Trop. Med. Hyg., 1996, vol. 55, pp. 589–594. Alvarez, D., Noor, M., and Ruiz-Garcia, M., Comparative Genetic Structure between Tropical Colombian and North-American Drosophila pseudoobscura Populations, Biotropica, 2002, vol. 34, pp. 81–92. Ruiz-Garcia, M., Molecular Population Genetic Analysis of the Spectacled Bear (Tremarctos ornatus) in the Northern Andean Area, Hereditas, 2003, vol. 138, pp. 81–93. Ruiz-Garcia, M., The Use of Several Microsatellite Loci Applied to Eight Neotropical Primates Revealed a Strong Recent Bottleneck Event in the Woolly Monkey (Lagothrix lagotricha) in Colombia, Primate Report, 2005, vol. 71, pp. 27–55. Ruiz-Garcia, M., Orozco-TerWengel, P., Castellanos, A., and Arias, L., Microsatellite Analysis of the Spectacled Bear (Tremarctos ornatus) Across its Range Distribution, Genes and Genetic Systems, 2005, vol. 80, pp. 57–69. Ruiz-Garcia, M., Payan, C.E., Murillo, A., Alvarez, D., DNA Microsatellite Characterization of the Jaguar (Panthera onca) in Colombia, Genes and Genetics Systems, 2005 (in press). Ruiz-Garcia, M., Corrales, C., Payan, C.E., and Castellanos, A., Hierarchical Genetic Structure of Leopardus pardalis in Colombia, Ecuador, Perú, Bolivia, and Brazil: Molecular Gene Diversity and Geographical Patterns, submitted for publication in Mol. Ecol., 2005.
RUSSIAN JOURNAL OF GENETICS
Vol. 42
No. 7
765
53. Paupy, C., Vazeille-Falcoz, M., Mousson, L., et al., Aedes aegypti in Tahiti and Moorea (French Polynesia): Isoenzyme Differentiation in the Mosquito Population According to Human Population Density, Amer. J. Med. Hyg., 2000, vol. 62, pp. 217–224. 54. Whitlock, M.C. and McCauley, D.E., Some PopulationGenetic Consequences of Colony Formation and Extinction: Genetic Correlations within Founding Groups, Evolution, 1990, vol. 44, pp. 1717–1724. 55. Mikaela, M.E. and Richardson, R.H., The Detection of Sympatric Sibling Species Using Genetic Correlation Analysis. I. Two Loci, Two Gamodemes, Genetics, 1997, vol. 86, pp. 665–678. 56. Snyder, T.P., and Linton, M.C., Population Structure in Black Flies: Allozymic and Morphological Estimates for Prosimulium mixtum and P. fuscum (Diptera: Simuliidae), Evolution, 1984, vol. 38, pp. 942–956. 57. Coosemans, M., Smits, A., and Roelants, P., Intraspecific Isoenzyme Polymorphism of Anopholes gambiae in Relation to Environment, Behavior, and Malaria Transmission in Southwestern Burkina Faso, Amer. J. Trop. Med. Hyg., 1998, vol. 58, pp. 70–74. 58. Conn, J., Cockburn, A.F., and Mitchell, S.E., Population Differentiation of the Malaria Vector Anopheles aquasalis using Mitochondrial DNA, J. Hered., 1993, vol. 84, pp. 248–253. 59. Nevo, E., Genetic Variation in Natural Populations: Patterns and Theory, Theor. Pop. Biol., 1978, vol. 13, pp. 121–177. 60. Rice, M.C. and O’Brien, S.J., Genetic Variance of Laboratory Outbred Swiss Mice, Nature, 1980, vol. 283, pp. 157–161. 61. Ahmad, M., Blumenberg, B., and Chaudhary, M.F., Mutant Allele Frequencies and Genetic Distance in Cat Populations of Pakistan and Asia, J. Hered., 1980, vol. 71, pp. 323–330. 62. Ruiz-Garcia, M., Genetic Profiles from Coat Genes of Natural Balearic Cat Populations: An Eastern Mediterranean and North African Origin, Genet. Sel. Evol., 1994, vol. 26, pp. 39–64. 63. Ayala, F.J., Genetic Differentiation during the Speciation Process, Evol. Biol., 1975, vol. 8, pp. 1–78. 64. Lehmann, T., Hawley, W.A., Kamau, L., et al., Genetic Differentiation of Anopheles gambiae Populations from East and West Africa: Comparison of Microsatellite and Allozyme Loci, Heredity, 1996, vol. 77, pp. 192–200. 65. Hernández, C., Reyes, E., Rodriguez, J., et al., Comparación citogenética de Psorophora confinnis (Diptera: Culicidae) en cepas representativas de dos poblaciones colombianas, Biomédica, 2000, vol. 20, pp. 218–227. 66. Rothfels, K.H., Cytological Approaches to the Study of Black Fly Systematics and Evolution, in Uses of Genetics and Cytology in Insect Systematics and Evolution, Stock, M., Ed., Univ. Idaho Press, 1981, pp. 67–83.
2006