MORPHOLOGY, SYSTEMATICS, EVOLUTION
Morphometric and Molecular Analyses of the Sand Fly Species Lutzomyia shannoni (Diptera: Psychodidae: Phlebotominae) Collected From Seven Different Geographical Areas in the Southeastern United States DAVID A. FLORIN,1,2 STEPHEN J. DAVIES,1 CARA OLSEN,1 PHILLIP LAWYER,3 ROBERT LIPNICK,4 GEORGE SCHULTZ,1 EDGAR ROWTON,5 RICHARD WILKERSON,5 AND LISA KEEP1
J. Med. Entomol. 48(2): 154Ð166 (2011); DOI: 10.1603/ME10199
ABSTRACT A morphometric and molecular study of adult male and female Lutzomyia shannoni (Dyar 1929) collected at seven different locations within the southeastern United States was conducted to assess the degree of divergence between the grouped specimens from each location. The collection locations were as follows: Fort Bragg, NC; Fort Campbell, KY; Fort Rucker, AL; Ossabaw Island, GA; Patuxent National Wildlife Research Refuge, MD; Suwannee National Wildlife Refuge, FL; and Baton Rouge, LA. Forty males and forty females from each location were analyzed morphometrically from 54 and 49 character measurements, respectively. In addition, the molecular markers consisting of the partial cytochrome c oxidase subunit I (from 105 sand ßies: 15 specimens/collection site) and the partial internal transcribed spacer 2 (from 42 sand ßies: six specimens/collection site) were compared. Multivariate analyses indicate that the low degree of variation between the grouped specimens from each collection site prevents the separation of any collection site into an entity that could be interpreted as a distinct population. The molecular analyses were in concordance with the morphometric study as no collection location grouped into a separate population based on the two partial markers. The grouped specimens from each collection site appear to be within the normal variance of the species, indicating a single population in the southeast United States. It is recommended that additional character analyses of L. shannoni based on more molecular markers, behavioral, ecological, and physiological characteristics, be conducted before ruling out the possibility of populations or a cryptic species complex within the southeastern United States. KEY WORDS Lutzomyia shannoni, canonical discriminant analysis, principal component analysis, internal transcribed spacer 2, cytochrome c oxidase subunit I
Lutzomyia (Psathyromyia) shannoni (Dyar) is a wideranging species of phlebotomine sand ßy that has a The views expressed in this article are those of the author and do not necessarily reßect the ofÞcial policy or position of the Department of the Navy, Department of Defense, nor the United States Government. This work was prepared as part of ofÞcial military duties of the lead author. Title 17 U.S.C. ¤105 provides that “Copyright protection under this title is not available for any work of the United States Government.” Title 17 U.S.C. ¤101 deÞnes a United States Government work as a work prepared by a military service member or employee of the United States Government as part of that personÕs ofÞcial duties. 1 Uniformed Services University of the Health Sciences, Department of Preventive Medicine and Biometrics, 4301 Jones Bridge Road, Bethesda, MD 20814-4799. 2 Corresponding author, e-mail: david.ß
[email protected]. 3 Laboratory of Parasitic Diseases, National Institute of Allergy and Infectious Diseases, Bethesda, MD 20892. 4 Armed Forces Health Surveillance Center, 2900 Linden Lane, Suite 100, Silver Spring, MD 20910. 5 Division of Entomology, Walter Reed Army Institute of Research, 503 Grant Avenue, Silver Spring, MD 20910-7500.
distribution from the state of New Jersey in the United States south through Central America to northern Argentina (Young and Perkins 1984, Young and Duncan 1994, Price et al. [in press]). Yet, within this extensive range there are sizeable gaps and discontinuities, such as the noted absence of the species from large areas of Texas and northern Mexico attributed to a void of the species preferred hardwood forests in those regions (Young and Perkins 1984). The possible geographic separation of L. shannoni into populations would, in theory, favor allopatric speciation or divergence as manifested in a cryptic species complex. Sand ßies in general possess attributes that should facilitate population isolation, as adults do not actively disperse appreciable distances (Alexander 1987) and have limited vertical activity (Brinson et al. 1992), thereby reducing passive dispersions by wind. L. shannoni may be especially susceptible to population isolation, as the species has been closely associated with hardwood habitats that offer suitable tree hole cavities (Comer
March 2011
FLORIN ET AL.: ANALYSES OF Lutzomyia shannoni IN THE U.S.
and Corn 1991, Comer et al. 1993), and as such may now be experiencing severely fragmented habitat zones with reduced gene ßow between island populations. In South America, the genus Lutzomyia is suspected of containing multiple cryptic species (Young and Duncan 1994, Dujardin et al. 2005, Pinto et al. 2010), complicating the production of a deÞnitive key. Lutzomyia whitmani (Antunes and Coutinho) has been proposed to be a cryptic species complex within a relatively small geographic in Brazil (Rangel et al. 1996, Margonari et al. 2004). The current ambiguity in the taxonomic status of Lutzomyia longipalpis (Lutz and Neiva) and the splintering of this species into a proposed cryptic complex may be a portent of things to come for L. shannoni, as both sand ßies possess an extensive, but patchy distribution and a limited ßight range for dispersion. In particular, the degree of morphological differences among the species in the subgenus Psathyromyia is quite subtle. Young and Duncan (1994) followed previous reports of placing Lutzomyia pifanoi (Ortiz) as a junior synonym to L. shannoni, whereas Lutzomyia microcephalus (Barretto and Duret) is listed as a conspeciÞc to L. shannoni. Two other species, Lutzomyia abonnenci (Floch and Chassignet) and Lutzomyia pestanai (Barretto and Coutinho), cannot be differentiated morphologically from each other or from L. shannoni using the female keys. Young and Perkins (1984) cited Rozeboom (1944) to postulate the morphological homogeneity of L. shannoni when compared between the United States and the neotropics. Rozeboom (1944) reported the collection of four male and Þve female Phlebotomus limai (Fonesca), a former description of L. shannoni, from a location near Florence, AL, and then compared these specimens with an unmentioned number of the purported species from Brazil. Measurements of antennae, wing, and spermathecae (in female) characters were compared, yet no statistical compilations were conducted. The small sample size, limited number of characters examined, and absence of statistical analysis challenge the conclusion of morphological homogeneity within the species. There appear to be no documented studies examining morphometric variation of L. shannoni specimens collected from within the United States, and one gains the impression that L. shannoni in Central and South America has generally been passed over in entomology research for the more competent Leishmania-vector species such as L. longipalpis or L. whitmani. Currently, there is limited information available on the genetic variability of L. shannoni. Collections from within Colombia suggest isolated populations based on polyacrylamide gel electrophoresis of isozyme loci (Cardenas et al. 2001, Mukhopadhyay et al. 2001). Whereas the cytochrome c oxidase subunit I (COI) gene has been used in genetic variability studies of other sand ßy species such as L. longipalpis (Arrivillaga et al. 2002, 2003), there is a general void in the literature using this molecular marker on L. shannoni. Variation in the internal transcribed spacer 2 (ITS2) has augmented morphological studies in the clariÞca-
155
tion of many species of sand ßy phylogenies (Di Muccio et al. 2000; Depaquit et al. 2000, 2002a, 2002b, 2004), yet very little has been produced for phylogeographical studies of L. shannoni since Miller et al. (1997) provided the full 235-bp sequence. The taxonomic status of any organism should be derived from as many different kinds of characters as possible (Mayr and Ashlock 1991). Studies now incorporating both nuclear and mitochondrial genes provide complementary data for resolving phylogenetics as the two types of data can be considered independent or unlinked (Caterino et al. 2000, Arias and Sheppard 2005, Zhang et al. 2005, Larkin et al. 2006, Kiyoshi and Sota 2006, Patsoula et al. 2006). In the same manner, combining morphological and molecular character information can result in complementary analyses that can produce a more robust systematics study. The two-pronged molecular and morphological approach maximizes the information available to answer questions pertaining to systematics, each “prong” serving as a “proof” of the other method when concordance is reached (Baker et al. 1998, Dujardin et al. 1999a, Azevedo et al. 2000, Torgerson et al. 2003, Malhotra and Thorpe 2004, Paquin and Hedin 2004, Knaden et al. 2005). As L. shannoni becomes further implicated as a vector of human and veterinary importance (Miles et al. 1983, Christensen and de Vasquez 1982, Lawyer 1984, Lawyer and Young 1987, Rowton et al. 1991, Comer et al. 1991), it is essential to know whether one population exists throughout the expansive range or if divergence into separate populations, or even a cryptic species complex, has occurred. Eldridge (2004) pointed out that vector incrimination must take place on the population level because there can be considerable intraspeciÞc variation among arthropods that ultimately affects the vector competencies. We investigated the degree of divergence between grouped specimens of L. shannoni collected from disparate locations within the southeastern region of the United States by comparing morphological characters and also by sequence comparison of two partial molecular markers. To our knowledge, this is the Þrst study that has examined the phylogeography of L. shannoni within the United States. Materials and Methods Collection Sites. Sand ßies were collected in dry ice-baited New Standard Miniature Light Trap Models 1012 (John W. Hock Company, Gainesville, FL) set just before dusk and allowed to run continuously until retrieved the following morning. Field collections were made at the following seven locations in the southeast United States (Fig. 1). Fort Bragg, NC. All specimens were collected from 1 to 3 September 2005 at the 161,000-acre Fort Bragg Army installation located near Fayetteville, NC. A total of 143 sand ßies was successfully processed, of which 129 (54 males and 75 females) were identiÞed as L. shannoni and 14 identiÞed as Lutzomyia vexator (Coquillett). The collection sites were mostly situated
156
JOURNAL OF MEDICAL ENTOMOLOGY
Vol. 48, no. 2
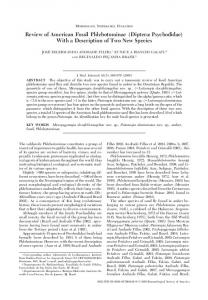
Fig. 1. Location of collecting sites within the southeastern United States.
along Þre-break roads that paralleled military training areas, and as such were heavily modiÞed by human use and disturbance. Selective loggings, controlled burns, and replantings of the pine tree cover have been standard practice for well over 20 yr on much of the installationÕs training grounds. This terrain is ßat and sandy, with extensive stands of pine and sparse understory. Fort Campbell, KY. All specimens were collected from 6 to 8 September 2005 at the 114,000-acre Fort Campbell, Army installation that is split nearly equally between the states of Kentucky and Tennessee. A total of 155 sand ßies was successfully processed, of which 132 (79 males and 53 females) were identiÞed as L. shannoni and 23 identiÞed as L. vexator. Collection sites were characterized by hilly terrain and deciduous tree cover interspersed with grassy meadows. Fort Rucker, AL. All collections were made on the 58,000-acre Fort Rucker Army installation, which is dominated by longleaf pine-scrub oak-wire grass ecosystems. A total of 127 sand ßies was successfully processed, of which 122 (55 males and 67 females) were identiÞed as L. shannoni and Þve identiÞed as L. vexator. Collections were conducted during two separate periods: 24 Ð25 May and 10 Ð12 September 2005, with all but 21 specimens collected on the latter trip.
Suwannee National Wildlife Refuge (NWR) and San Felasco Hammock State Preserve, FL. These two locations are only separated by ⬇40 miles and therefore are grouped together as one collection location for this study. Collections at the Suwannee NWR during two separate trips, 27Ð29 May and 13Ð16 September 2005, resulted in a total of 77 sand ßies successfully processed: 71 (four males and 67 females) were identiÞed as L. shannoni, and six identiÞed as L. vexator. Collections at San Felasco Hammock State Preserve occurred on various dates in the spring of 2007: 25 April, 10 May, 23 May, and 6 June, with 50 male L. shannoni specimens provided to this study. Salt marshes, tidal ßats, bottomland hardwood swamps, and pine forests are dominant features of these wildlife refuges. Ossabaw Island, GA. All collections took place on the 126,000-acre coastal barrier island located approximately 20 miles south of Savannah. A total of 110 (50 males and 60 females) L. shannoni was processed; no other species of sand ßy was collected. The uplands are characterized by deciduous oak and second growth forest interspersed by creeks, rivers, and tidal marsh. A single collecting trip was conducted on 19Ð21 September 2005. Patuxent National Wildlife Research Refuge (NWRR), MD. A total of 99 (41 males and 58 females) sand ßies was processed from this 12,750-acre wildlife
March 2011
FLORIN ET AL.: ANALYSES OF Lutzomyia shannoni IN THE U.S.
refuge located off the Patuxent River between Baltimore, MD, and Washington, D.C. All collected sand ßies were identiÞed as L. shannoni. The habitat can be characterized as forested with patches of grassland broken up by numerous wetland impoundments. Consistent collections occurred at this site on a weekly basis from 7 June to 6 November 2005 and from 31 March to 15 June 2006. Baton Rouge and Greenwood State Park, LA. Baton Rouge proper and the Greenwood State Park are separated by ⬇10 miles and therefore are grouped together as one collection location for this study. Collections were conducted primarily at the latter location at various times during May 2005 to May 2008. L. shannoni accounted for ⬎95% of the sand ßies collected, with L. vexator comprising the remainder. Greenwood State Park contained numerous freshwater Þshing ponds bordered by deciduous thickets with saw palmetto/brier understory. The Baton Rouge proper sites were an undeveloped lot in a commercial sector and a wetland thicket adjacent to a high school. All three sites were small in size compared with the other collection locations, and all were heavily impacted by commercial development and nearby residential activities. The above sites were selected to obtain distant collection points throughout the southeastern United States and to sample in different ecosystems, as this would presumably increase the possibility of detecting any fracturing of the species into individual populations (Solbrig and Solbrig 1979, Mayr 2001). For each site, Global Positioning System coordinates were documented on the light trap locations. Preparation and Character Measurements of Sand Fly Specimens. After Þeld collection, all specimens were preserved in 100% ethanol. In the laboratory, the sand ßies were prepared for slide mounting by placing each specimen in a small petri dish ßooded with 100% ethanol. Four structures were dissected from the body, as follows: head, terminal six segments of the abdomen, one hind leg, and one wing. The remainder of the specimen was placed in an individual cryogenic vial containing 100% ethanol, assigned a designated accession number that matched the number assigned to the dissected parts, and then stored at ⫺80⬚C for future use in the molecular analysis. The dissected structures were cleared for a period of 48 h at room temperature in specimen clearing ßuid (6373A, BioQuip Products, Rancho Dominguez, CA). After clearing, the four structures were centrally mounted on a standard glass slide with mounting medium (6371 PVA, BioQuip Products). An 18-mm-diameter, No. 1 thickness, microscope glass coverslip was placed over the mountings, and the slide was then placed in a drying oven set at 45⬚C for 5 d. From the mounted structures of the abdomen (genitalia) and head, the sand ßies were identiÞed to sex and species using the taxonomic keys of Young and Perkins (1984). Morphological Analysis. A total of 560 L. shannoni specimens (280 males and 280 females, equating to 40 specimens of each sex from each of the seven collection sites) was used in the statistical analyses of the
157
morphological part of this study. The criteria for choosing the specimens to be used were based on completeness and integrity of the dissected, slidemounted features. As in any study using insects collected from light traps, a certain amount of damage to the delicate, external features was inevitable. The target collection goal of 40 males and 40 females per site was the minimum; for most of the sites, well over 130 sand ßies were actually processed, and then 40 males and 40 females were selected on the basis of completeness and visibility of the characters to be measured. This process may have introduced a selection bias into the study, as certain specimens that were excluded may have had attributes such as small size that predisposed them to poor visibility on mounted slides or, conversely, larger-sized specimens may have been more prone to damage by the intake fan of the light trap. However, this potential bias was viewed to be of a relatively minor nature, as only those specimens that were severely damaged (e.g., incomplete head or fragmented abdomen) were excluded. No attempt was made to exclude specimens with secondary damage to the antennae, palps, hind legs, or wings, as long as a complete set of four structures could be obtained for the slide mount. The morphological characters used by Dias et al. (1999) in the morphometric study of L. whitmani and by Azevedo et al. (2000) in the study of L. longipalpis were the foundation for the characters chosen in this study. In addition, correlation to the characters used for identiÞcation to genera, subgenera, and species by Young and Perkins (1984) and Young and Duncan (1994) provided a conÞrmation of taxonomic importance. Table 1 lists the morphological characters used in this study and a description of how the measurements were derived. All morphological characters examined in both sexes were external features, with the exceptions of spermatheca length, width, and ratio measured in the females. The morphological characters were measured by using a micrometer inserted in one of the two 10⫻ ocular eyepiece lens of a calibrated compound microscope (Series 150, American Optical, Southbridge, MA) with measurements recorded from the ⫻4, ⫻10, and ⫻45 objectives, depending upon the size of the character. The micrometer measurement data were converted into real measurements of micron units using the calibration values of the ocular micrometer in relation to each objective lens, as outlined in Ash and Orihel (1997). The same researcher measured and recorded all data throughout the study. Accuracy of the data was conÞrmed by comparing a series of raw measurements with measurements obtained from a different observer, with the correlation result of 99.95% obtained between the two sets of measurements. If a character was found to be absent or so severely damaged that the researcher did not believe a viable measurement could be made from the specimen, then no data were recorded for that item. Any character that exceeded ⬎10% of cases with no entries was excluded from the study; the Þnal number of character measurements assessed was 54 for the males and 49 for the females. Included in these totals
158
JOURNAL OF MEDICAL ENTOMOLOGY
Vol. 48, no. 2
Table 1. List of morphological characters, sex for which character was used, and description of character measurements conducted on L. shannoni Character
Sex for which character used
Description of character measurement
Head length Clypeus Interocular Labrum length Labrum width Labrum ratio Palpal segment I length Palpal segment I width Palpal segment I ratio Palpal segment II length Palpal segment II width Palpal segment II ratio Palpal segment III length Palpal segment III width Palpal segment III ratio Palpal segment IV length Palpal segment IV width Palpal segment IV ratio Palpal segment V length Palpal segment V width Palpal segment V ratio Flagellomere I length Flagellomere I width Flagellomere I ratio Flagellomere II length Flagellomere II width Flagellomere II ratio Flagellomere III length Flagellomere III width Flagellomere III ratio Flagellomere IV length Flagellomere IV width Flagellomere IV ratio Flagellomere V length Flagellomere V width Flagellomere V ratio Flagellomere VI length Flagellomere VI width Flagellomere VI ratio Flagellomere VII length Flagellomere VII width Flagellomere VII ratio Flagellomere VIII length Flagellomere VIII width Flagellomere VIII ratio Flagellomere IX length Flagellomere IX width Flagellomere IX ratio Flagellomere X length Flagellomere X width Flagellomere X ratio R-5 length Wing width Alpha length Delta length Beta length Gamma length Femur length Tibia length Cercus length Spermathecae length Spermathecae width Spermathecae ratio Gonostylus length Gonostylus width Gonostylus ratio Gonocoxite length Gonocoxite width Gonocoxite ratio Lateral lobe length Lateral lobe width Lateral lobe ratio
Both Both Both Both Botha Botha Both Both Both Both Both Both Both Both Both Both Both Both Botha Botha Botha Both Both Both Both Both Both Both Both Both Both Both Both Both Both Both Both Both Both Both Both Both Botha Botha Botha Botha Botha Botha Botha Botha Botha Both Both Both Both Both Both Both Both 乆 only 乆 only 乆 only 乆 only 么 only 么 only 么 only 么 only 么 only 么 only 么 only 么 only 么 only
Measurement from vertex to ventral edge of clypeus Measurement from subgenal suture to edge of clypeus Smallest measurement between compound eyes Measurement from edge of clypeus to apical tip of labrum Widest measurement of labrum width Ration of length/width of labrum Measurement from basal articulation to fusion line with palp II Widest measurement of palpal I segment width Ratio of length/width of palpal I segment Measurement of palpal II segment length Widest measurement of palpal II segment width Ratio of length/width of palpal II segment Measurement of palpal III segment length Widest measurement of palpal III segment width Ratio of length/width of palpal III segment Measurement of palpal IV segment length Widest measurement of palpal IV width Ratio of length/width of palpal IV segment Measurement of palpal V segment length Widest measurement of palpal V width Ratio of length/width of palpal V segment Measurement of ßagellomere I length Widest measurement of ßagellomere I width Ratio of length/width of ßagellomere I segment Measurement of ßagellomere II length Widest measurement of ßagellomere II width Ratio of length/width of ßagellomere II segment Measurement of ßagellomere III length Widest measurement of ßagellomere III width Ratio of length/width of ßagellomere III segment Measurement of ßagellomere IV length Widest measurement of ßagellomere IV width Ratio of length/width of ßagellomere IV segment Measurement of ßagellomere V length Widest measurement of ßagellomere V width Ratio of length/width of ßagellomere V segment Measurement of ßagellomere VI length Widest measurement of ßagellomere VI width Ratio of length/width of ßagellomere VI segment Widest measurement of ßagellomere VII width Measurement of ßagellomere VII width Ratio of length/width of ßagellomere VII segment Measurement of ßagellomere VIII length Widest measurement of ßagellomere VIII width Ratio of length/width of ßagellomere VIII segment Measurement of ßagellomere IX length Widest measurement of ßagellomere IX width Ratio of length/width of ßagellomere IX segment Measurement of ßagellomere X length Widest measurement of ßagellomere X width Ratio of length/width of ßagellomere X segment Length of wing vein R5 Measurement of widest width of wing Length of wing vein R2 from its junction with R3 to the costa Length of wing vein R1 that extends beyond junction of R2 and R3 Length of wing vein R from junction of R2 and R3 to junction with R4 Length of wing vein R from origin of R5 to origin of R2 ⫹ 3 and R4 Length of femur Length of tibia Measurement of widest width of cercus Length of spermathecae Measurement of widest width of spermathecae Ratio of length/width of spermathecae Length of gonostylus Measurement of widest width of gonostylus Ratio of length/width of gonostylus Length of gonocoxite Measurement of widest width of gonocoxite Ratio of length/width of gonocoxite Length of lateral lobe Measurement of widest width of lateral lobe Ratio of length/width of lateral lobe
a
Designates characters that were excluded from the analyses due to having exceeded ⬎10% of the total number with blank values.
March 2011
FLORIN ET AL.: ANALYSES OF Lutzomyia shannoni IN THE U.S.
are a number of length/width ratio measurements conducted on certain characters. The ratios are designed to reduce the confounding of simple size differences in the sample and as a comparison in the ordination analyses. The software package SPSS 18.0 (SPSS, Chicago, IL) was used for all statistical aspects of the multivariate analyses. The characters entered for analysis were screened for a normal distribution pattern by using the following two methods: quantile-quantile plots and probability plots. The plots from each method indicated that all character measurements, including the ratios, are of a normal distribution. Boxplots of each character measurements were examined for outliers, with the majority showing none. The few outliers detected were checked for accuracy by re-examining specimens from which the measurements were derived. If the measurements were accurate, the outliers remained in the data. Test of homogeneity of variances was examined by plotting the standardized residuals against the collection location; all were found to be within an acceptable range, as the spread of the variances did not exceed 3 standard deviation units above or below the mean. Canonical discriminant analyses (CDAs) were separately conducted on the male and female data. Potential collinearity and reduced independence among the variables were avoided by not entering the width measurements (with the exception of wing width, as no total wing length measurements were conducted) or the ratios into the CDAs with the other variables (Zuur et al. 2007); ratios and width measurements were each analyzed separately. Missing values in the data from any individual ßy were replaced with the respective serial mean because ordination techniques can be sensitive to inequality of data entries (Pimentel 1992). Assessment of the model in each analysis was accomplished by examining the Wilks lambda and the Wilks lambda difference tests. Assessment of the degree of separation of grouped specimens by collection sites was made through the classiÞcation of the original data and by leave-one-out-cross-validation. A “size-free analysis” was modeled after Dujardin and Le Pont (2004) and Klingenberg (1996). For each sex, a multigroup principal component analysis (PCA) was computed from the variance-covariance matrix. The width and ratio measurements were not entered into the analysis so as to avoid collinearity and reduced independence among the variables. Missing data values from any individual sand ßy were replaced with serial means. All data entered into the PCA were log transformed to make the variances more homogenous and relations among the variables more linear (Klingenberg 1996). The PCA scores were assessed for outliers and nonlinearity by examining two-dimensional plots of the scores. Characters displaying high correlation to an orthogonal projection from the Þrst principal component axis were viewed as allometry free by construction and subsequently submitted to a CDA by simply using the PCA scores from all the principal component axes other than the Þrst.
159
DNA Purification, Amplification, and Direct Sequencing. Genomic DNA was puriÞed from individual sand ßies using QIAGEN DNeasy kit (Qiagen, Valencia, CA) as directed by the manufacturer, and stored at ⫺80⬚C until further use. AmpliÞcations of target sequences by polymerase chain reaction were accomplished using the AccuPrime TaqDNA Polymerase System (Invitrogen, Carlsbad, CA) and a DNA Engine DYAD Peltier Thermal Cycler (Bio-Rad Life Sciences, Hercules, CA). For the COI sequence, ampliÞcation was accomplished using the primers 5⬘-TTA TAA TGT AAT TGT TAC AGC C-3⬘ (forward) and 5⬘-AAA TAT AAA CTT CTG GAT GTC C-3⬘ (reverse), based on primers speciÞed in Kambhampati and Smith (1995). Thermocycling conditions for COI fragment ampliÞcation were as follows: 94⬚C for 1 min, 51⬚C for 1 min, and 68⬚C for 1 min, for 35 cycles. For the ITS2 locus, the sequence of interest was ampliÞed using the primers 5⬘-ACT GCA GGA CAC ATG AAC ATC-3⬘ (forward) and 5⬘-CCT GGT TAG TTT CTT TTC CTC C-3⬘ (reverse), which were designed using the method of McPherson and Moller (2000) from highly conserved ITS2 ßanking regions of other sand ßy species deposited in GenBank: Phlebotomus tobbi (Addler and Theodor) GenBank AF205523, Phlebotomus ariasi (Tonnoir) GenBank AF205525, Phlebotomus andrejevi (Shakirzyanova) GenBank AF218315, Phlebotomus mongolensis (Sinton) GenBank AF218320, Phlebotomus saevus (Parrot and Martin) GenBank AF218322, Phlebotomus perniciousus (Newstead) GenBank AF205526, Phlebotomus longicuspis (Nitzulescu) GenBank AF205526, Phlebotomus perfiliewi perfiliewi (Parrot) GenBank AF205527, and the complete ITS2 sequence of L. shannoni GenBank U48382, as submitted by Miller et al. (1997). Thermocycling conditions for ITS2 fragment ampliÞcation were as follows: 94⬚C for 1 min, 62⬚C for 1 min, and 68⬚C for 2 min, for Þve cycles; 94⬚C for 1 min, 58⬚C for 1 min, and 68⬚C for 2 min, for Þve cycles; 94⬚C for 1 min, 54⬚C for 1 min, and 68⬚C for 2 min, for 25 cycles. The expected sizes of the amplicons were conÞrmed by electrophoresis on 1.2% agarose gels in Tris borate ethylenediaminetetraacetic acid buffer. To conÞrm that the correct target sequences were ampliÞed, amplicons from initial trials were cloned into the pCR2.1-TOPO vector using the TOPO TA cloning system (Invitrogen) and, after propagation in Escherichia coli (TOP10) cells, the inserts were sequenced from priming sites within the vector. Thereafter, polymerase chain reaction products from individual ßies were puriÞed directly from ampliÞcation reactions using PERFORMA Spin Columns (Edge Bio Systems, Gaithersburg, MD) and subjected to direct sequencing using dye terminator methodology Big Dye Terminator v 3.1 Cycle Sequencing Kit and a 3100 Genetic Analyzer (Applied Biosystems, Foster City, CA). COI Analysis. A total of 105 L. shannoni (15 specimens from each of the seven collecting sites) was used for the COI analysis. Consensus sequences for each of the individual specimens were determined from forward and reverse sequences using the Vector NTI Advance 10.0.1 software suite (Invitrogen), man-
160
JOURNAL OF MEDICAL ENTOMOLOGY
Vol. 48, no. 2
Fig. 2. CDA of the analyzed male L. shannoni characters. (Online Þgure in color.)
ually adjusted for obvious errors and misalignments, and then aligned using the Clustal W algorithm. Nucleotide sequence alignments were subjected to the following analyses: 1) the sequence distance method neighbor joining (NJ) algorithm of Saitou and Nei (1987) as calculated by the Invitrogen Explorer NTI program; 2) NJ analysis under KimuraÕs two-parameter model by PAUP version 4.0b10 (Swofford 2002) with bootstrapping 1,000 replicates to obtain a statistical estimate of the reliability of the groupings (Hall 2001); 3) Bayseian analysis in MrBayes 3.1.2 (Ronquist and Huelsenbeck 2003) run for 10 million generations with two parallel searches using three heated and one cold Markov chain with the evolution model GTR ⫹ I ⫹ G obtained in MrModeltest 2.3 (Nylander 2004); 4) a TCS phylogenetic network estimation (Clement et al. 2000) using a statistical parsimony connection limit of 95% to determine whether the specimens formed a single mega-population or are comprised of separate taxa; and 5) a codon analysis with the Invitrogen Explorer NTI program. ITS2 Analysis. A total of 42 L. shannoni sand ßies (six specimens from each of the seven collection sites) was entered into the ITS2 analysis in addition to the GenBank U48382 sequence. Certain sequences were trimmed up to 5 bp on the 3⬘ end to have a uniform length of 229-bp comparisons (the sequence length for the full ITS2 entered in GenBank by Miller et al. [1997] is 235-bp length). After alignment, the sequences were analyzed with the sequence distance method and the maximum parsimony analysis in the PAUP program, as detailed for the COI marker.
Results Morphological Analysis. The results of the multivariate analyses show that the specimens from each of the collecting sites fall into overlapping clusters, with no deÞnitive separation discerned based upon collection site. In the male data, the stepwise statistical method (using the Mahalanobis distance and criteria of F value entry of 3.84 and removal value of 2.71) of the CDA eliminated 18 characters (from a total of 26 characters entered) of low information content until a subset of eight informative characters remained, as follows: clypeus length, palpal segment II length, ßagellomere II length, ßagellomere IV length, wing width, gamma length, femur length, and tibia length. Tests of significance for the model as a whole indicated that the model functioned: the Wilks lambda was signiÞcant for Þrst four discriminant functions, and the Wilks lambda difference tests showed classiÞcation better than chance. The canonical correlations for the Þrst and second functions in the CDA were 0.588 and 0.530, respectively. Six canonical functions were used with cumulative percentage of variance for the Þrst and second functions being 73.5%; the Þrst through the fourth functions accounted for 97.4% of the variance. Original grouped cases were correctly classiÞed 44.3% of the time by the model. Cross-validated grouped cases yielded 36.8% of cases correctly classiÞed. Fig. 2 is the CDA scatter plot of the analyzed character measurements of the male sand ßies. Log transformation of the data produced nearly the same results. The width measurements and the ratios were each entered
March 2011
FLORIN ET AL.: ANALYSES OF Lutzomyia shannoni IN THE U.S.
161
Fig. 3. CDA of the analyzed female L. shannoni characters. (Online Þgure in color.)
into separate discriminating analyses that produced reduced levels of classiÞcation compared with the other character measurements. In the female data, the stepwise statistical method (using the Mahalanobis distance and criteria of F value entry of 3.84 and removal value of 2.71) of the CDA eliminated 16 characters (from a total of 25 entered) of low information content until a subset of nine informative characters remained, as follows: femur length, head length, clypeus length, wing width, palp I length, spermatheca length, interocular, ßagellomere VII length, and palp II length. Tests of signiÞcance for the model as a whole indicated that the model functioned: the Wilks lambda was signiÞcant for the Þrst six tests of function, and the Wilks lambda difference tests showed classiÞcation better than chance. The canonical correlations for the Þrst and second functions in the CDA were 0.687 and 0.604, respectively. Six canonical functions were used with cumulative percentage of variance for the Þrst and second functions being 66.1%; the Þrst through the fourth functions accounted for 97.7% of the cumulative variance. Original grouped cases were correctly classiÞed 58.6% by the model. Cross-validated grouped cases yielded 55% of cases correctly classiÞed. Fig. 3 is the CDA scatter plot of the analyzed character measurements of the female sand ßies. As in the male data, log transformation of the female character measurements resulted in little change, and the separate discriminating analyses conducted on the width measurements and ratios produced reduced levels of classiÞcation compared with the other character measurements.
In both sexes, the characters that displayed a high correlation to the orthogonal projection to the Þrst principal component axis were found to be marginally discriminative when entered into a CDA via the independent procedure. In the male data, tests of signiÞcance for the model as a whole indicated that the model functioned and was discriminating: the Wilks lambda was signiÞcant for the Þrst four discriminant functions, and the Wilks lambda difference tests showed classiÞcation better than chance. The canonical correlations for the Þrst and second functions in the CDA were 0.652 and 0.512, respectively. Cumulative percentage of variance for the Þrst and second axes was 63.8%; six canonical axes were used, with cumulative percentage of fourth axis being 91.9%. Original grouped cases were correctly classiÞed by the model 53.2% of the time, whereas cross-validated grouped cases yielded only 38.2% of cases correctly classiÞed. In the female data, entering all the PCA scores except from the Þrst principal component axis into a CDA resulted in a slightly better discrimination by collecting site than when compared with the males. Tests of signiÞcance for the model as a whole indicated that the model functioned and was discriminating: the Wilks lambda was signiÞcant for the Þrst Þve tests of discriminant functions, and the Wilks lambda difference tests showed classiÞcation better than chance. The canonical correlations for the Þrst and second functions in the CDA were 0.689 and 0.629, respectively. Cumulative percentage of variance for the Þrst and second axes was 55.9%; six canonical axes were
162
JOURNAL OF MEDICAL ENTOMOLOGY
used, with cumulative percentage of the Þfth axis being 97.8%. Original grouped cases were correctly classiÞed by the model 66.1% of the time, whereas cross-validated grouped cases yielded 54.6% of cases correctly classiÞed. COI Analysis. The 461-bp partial sequences of the COI gene for the 105 specimens used in the analysis were deposited into GenBank and given accession numbers GU597846 ÐGU597950. The sequences were without gaps and showed a polymorphism of 11.7% (88.3% similarity) with 407 nucleotide positions constant. From 54 variable sites, there were 24 parsimony informative and 30 parsimony uninformative. No insertions or deletions were identiÞed within the aligned sequences. Sixty-eight distinct haplotypes were resolved from the total 105 aligned sequences. The percentage of identical residues among the sequences ranged from 100 to 97% for all pairwise comparisons in the total alignment. When sequences were grouped by collection site and then separately aligned within their respective group, the collection sites of Patuxent NWRR, Suwannee NWR, and Fort Bragg displayed 100 Ð97% similarity; the Fort Campbell and Ossabaw Island sites displayed 100 Ð98%; whereas Fort Rucker and Baton Rouge displayed 100 Ð99% of identical residues among the sequences for all pairwise comparisons. The KimuraÕs two-parameter genetic distance model was in concordance with the identity table, as the divergence between and within the collection sites did not exceed 3%. In the NJ analysis, bootstrap values among the sequences ranged from 50 to 81; the resulting consensus tree is displayed in Fig. 4. In the Bayseian analysis, a posterior probability of just 0.82 was obtained at the Þrst branch of the tree (data not shown) containing the sequences. The TCS phylogenetic estimation was in concordance with the Bayseian results, as a single network of interconnected sequences, regardless of collection site, was indicated. The codon analysis based on the invertebrate mitochondrial genetic code translated the COI sequences into protein sequences of 153 amino acids in length from the ⫹3 translation frame of the direct strands. These translation frames did not contain any stop codons indicating that the mitochondrial sequences were free of nuclear pseudogenes (Bensasson 2001, Song et al. 2008). In the alignment of all translated sequences, there were six positions that induced different amino acids; all other changes were silent. The six nucleotide substitutions were from six different sequences (specimens) from the following collection sites: two from Baton Rouge, one from Patuxent, one from Suwannee NWR, one from Fort Rucker, and one from Ossabaw Island. ITS2 Analysis. The 229-bp partial sequences of the ITS2 sequences ampliÞed from 42 specimens were deposited into GenBank and given accession numbers GU585696 ÐGU585737. The sequences showed a polymorphism of 3.5%. Of the eight variable sites (counting gaps as missing data), there were four parsimony informative and four parsimony uninformative. Within the aligned sequence data set, a Þgure of 94.8% similarity resulted with 217 nucleotide positions constant
Vol. 48, no. 2
accounting for gaps. Ten distinct haplotypes were resolved from the total aligned sequences. An identity table (data not shown) displaying the percentage of identical residues among the sequences ranged from 100 to 97% for all pairwise comparisons in the total alignment. When sequences were grouped by collection site and then separately aligned within their respective group, the collection sites of Patuxent NWRR, Suwannee NWR, Fort Campbell, Ossabaw Island, and Fort Rucker displayed 100 Ð99% of identical residues among the sequences for all ungapped positions between the pairwise comparisons, whereas the sites of Baton Rouge and Fort Bragg displayed 100 Ð98%. The maximum parsimony analysis of the ITS2 data was in concordance, as no collection site branched out separately from the collection total. Bootstrap values, as derived in PAUP from 1,000 bootstrap replications with 50% majority rule consensus, were low, as the values for the tree branches ranged from 51 to 62. Sequence diversity of the ITS2 between collection sites as determined by the distance matrix program KimuraÕs two-parameter genetic distance model ranged from 0 to 2.7%, with all but 10 sequences being identical. The 10 sequences that displayed nonzero genetic distance values were from Fort Rucker (4), Patuxent NWRR (3), Baton Rouge (2), and Fort Bragg (1). Sequence diversities within the collection sites were the following: Fort Bragg (0 Ð1.8%), Fort Campbell (0%), Fort Rucker (0 Ð1.8%), Suwannee NWR (0%), Ossabaw Island (0%), Patuxent NWRR (0 Ð 0.4%), and Baton Rouge (0 Ð1.8%). Discussion Our data from the examined molecular markers and morphological characters support the position that L. shannoni inhabiting the United States is of one species and possibly one population. In both the morphological and molecular analyses, the variation between the seven collection sites nearly equaled the variation from within the collection sites. The minor amount of variation between the collection sites was not enough to enable one to discriminate the collection sites when analyzed together. This indicates that the specimens from each collection site are within the normal variance of the species, as no diagnostic or informative distributions could be discerned from either the morphological or the molecular analysis. The morphological analysis produced groupings that overlapped extensively for both the male and female data. The CDAs of the character measurements indicate that there is some degree of divergence, as the model was able to correctly classify 44.3% of the males and 58.6% of the females from the respective in-group data pools, although neither sex obtained ⬎60% of cases correctly classiÞed in crossvalidation. These classiÞcation Þgures diminish further when one realizes that by chance alone there is a one in seven (14%) prior probability of placing an individual ßy into the proper collection site among the total seven sites. Distinct and sympatric morphotypes
March 2011
FLORIN ET AL.: ANALYSES OF Lutzomyia shannoni IN THE U.S.
163
Fig. 4. Consensus tree of L. shannoni partial COI from NJ analysis in the PAUP 4.0b10 program with bootstrapping of 1,000 replicates. FJ437285 and FJ437286 are GenBank sequences of the COI fragments from Lutzomyia walkeri that were used as outgroups. The two-letter preÞx of each sample designates the collection site, as follows: BG ⫽ Fort Bragg, BR ⫽ Baton Rouge, FC ⫽ Fort Campbell, FR ⫽ Fort Rucker, OS ⫽ Ossabaw Island, SU ⫽ Suwannee NWR, PX ⫽ Patuxent NWRR.
could not be discerned from either the male or the female data based upon collection site location. Groupings that cannot be separated completely in a CDA have to be viewed as morphologically inseparable at least on the basis of the characters examined (Claridge and Gillham 1992). Clearly, the grouped sand ßies in this study do not separate out into well-
deÞned and separate entities as shown in other studies using CDA or canonical variate analysis to indicate species divergence: Dujardin et al. (1999b, 2004, 2005) and Cazorla and Acosta (2003). The size-free analysis using the principal component scores did not enhance separation. The subsequent decrease in variation by removal of the Þrst
164
JOURNAL OF MEDICAL ENTOMOLOGY
principal component axes in the PCAs of each collecting site did not produce fully separated groupings in the subsequent CDAs. If there is size confounding, it would appear to be minor, as the CDAs from the PCA scores with the Þrst axis removed were quite similar to the initial CDAs. The small degree of variation because of size that exists in the data may be attributed to collecting at different times of the year among the collection sites. Sand ßies were collected during the spring at Fort Rucker, Suwannee NWR, and Patuxent NWRR; all other sand ßies were collected during the late summer/early fall season. An inverse relationship has been reported for the effects of temperature on adult size in mosquitoes (Clements 2000, Tun-lin et al. 2000). If this relationship holds true for sand ßies, then there is the possibility that larger sand ßies of Fort Rucker, Suwannee NWR, and Patuxent NWRR were compared with the smaller ßies of Fort Bragg, Fort Campbell, and Ossabaw Island. Sand ßies collected in the spring could have been larger because of larval development in the cooler months of the preceding fall before diapause versus the sand ßies collected in the fall when larval development would have occurred during the warmer summer months. Regardless, the size-confounding issue must be viewed as minor because the PCAs and the CDAs of the widths and ratios were not informative. The molecular analysis produced COI and ITS2 partial sequences that fell short of standard thresholds for separate species or even populations (Hebert 2003, Arrivillaga et al. 2003, Kuwahara et al. 2009). More importantly, the intra- and intervariations of the sand ßies based on collection site were nearly identical. Whereas unique haplotypes were produced, there was no grouping of these haplotypes to any of the various collection sites. The codon analysis demonstrated the same, as the sequences of the COIs that actually resulted in conformational changes to the mitochondrion proteins showed no association by location of nucleotide substitution or collection site. L. shannoni has been characterized as being generally associated with mature forests (Comer et al. 1993). If this holds true, then the fragmentation of the old growth hardwood habitat throughout the southeastern United States would presumably decrease the genetic variability of L. shannoni because of genetic drift in isolated populations. However, in the allozyme study of Mukhopadhyay et al. (2001) that examined L. shannoni in Colombia, no signiÞcant genetic variability was detected between collection sites delineated by discontinuous forest habitat, although the authors did Þnd genetically distinct populations where the Andean mountain chains separated collection sites. L. shannoni is perhaps a more ßexible species in terms of habitat requirements than formerly thought, as we found the collection habitats in this study to be actually quite diverse. Sand ßies were collected in saw palmetto thickets of Florida to oak/hickory forests in Kentucky. L. shannoni was even collected in abandoned lots within the severely human-disturbed, urban environment of Baton Rouge, LA. Our results are in partial agreement with Mukhopadhyay et al. (2001)
Vol. 48, no. 2
in that the discontinuous forest habitat does not appear to be an important population-isolating mechanism for this species. Yet, we also found other natural barriers, such as the open water surrounding Ossabaw Island and the Appalachian mountain chain separating Fort Campbell from the other sites, to be inconsequential in terms of producing genetically distinct populations. Although the results of this study indicate that there is homogeneity of L. shannoni between the geographic areas, much future work needs to be done before such a conclusion can be deÞnitively stated. Laboratory crossing of ßies from distant locations with the production of fertile offspring would provide partial conformance to the biological species concept. Other morphological characters and molecular markers, including microsatellite DNA, should be examined for potentially signiÞcant variation. Life stages other than the adult might have morphological features with discriminative properties. Given how little published material there is on this species, the door is wide open to examine a range of characters from the physiological, behavioral, or ecological realms. It is also important to keep in mind that the distribution of this species spans two hemispheres and that comparison of these United States specimens with specimens from distant areas within the total range, i.e., Central America to Argentina, may show large degrees of variation. Acknowledgments We thank T. Mascari of Louisana State University and P. Obenauer of the United States Navy for providing sand ßies from Baton Rouge, LA, and San Felasco Hammock State Preserve, FL, respectively. We also acknowledge F. Ruiz, Walter Reed Army Institute of Research, and Mike Flora, Uniformed Services University of the Health Sciences, for technical assistance. This work was supported by Uniformed Services University of the Health Sciences Intramural Grant R087WB: Risk for domestic transmission of leishmaniasis acquired by United States service members in Iraq/Afghanistan.
References Cited Alexander, J. B. 1987. Dispersal of phlebotomine sand ßies (Diptera: Psychodidae) in a Colombian coffee plantation. J. Med. Entomol. 24: 552Ð558. Arrivillaga, J. C., D. E. Norris, M. D. Feliciangeli, and G. C. Lanzaro. 2002. Phylogeography of the neotropical sand ßy Lutzomyia longipalpis inferred from mitochondrial DNA sequences. Infect. Genet. Evol. 2: 83Ð95. Arrivillaga, J., J. Mutebi, H. Pinango, D. Norris, B. Alexander, M. Felicangeli, and G. Lanzaro. 2003. The taxonomic status of genetically divergent populations of Lutzomyia longipalpis (Diptera: Psychodidae) based on the distribution of mitochondrial and isozyme variation. J. Med. Entomol. 40: 615Ð 627. Arias, M. C., and W. S. Sheppard. 2005. Phylogenetic relationships of honey bees (Hymenoptera: Apinae: Apini) inferred from nuclear and mitochondrial DNA sequence data. Mol. Phylogenet. Evol. 37: 25Ð35. Ash, L., and T. Orihel. 1997. Atlas of Human Parasitology, 4th ed. American Society of Clinical Pathologists, Chicago, IL.
March 2011
FLORIN ET AL.: ANALYSES OF Lutzomyia shannoni IN THE U.S.
Azevedo, A.C.R., F. A. Monteiro, P. H. Cabello, N. A. de Souza, M. G. Rosa-Freitas, and E. F. Rangel. 2000. Studies on populations of Lutzomyia longipalpis (Lutz & Neiva, 1912) (Diptera: Psychodidae: Phlebotominae) in Brazil. Mem. Inst. Oswaldo Cruz 95: 305Ð322. Baker, R. H., X. Yu, and R. DeSalle. 1998. Assessing the relative contribution of molecular and morphological characters in simultaneous analysis trees. Mol. Phylogenet. Evol. 9: 427Ð 436. Bensasson, D., D. Zhang, D. L. Hartl, and G. M. Hewitt. 2001. Mitochondrial pseudogenes: evolutionÕs misplaced witnesses. Trends Ecol. Evol. 16: 314 Ð321. Brinson, F. J., D. V. Hagan, J. A. Comer, and D. A. Strohlein. 1992. Seasonal abundance of Lutzomyia shannoni on Ossabaw Island, Georgia. J. Med. Entomol. 29: 178 Ð182. Cardenas, E., L. E. Munstermann, O. Martinez, D. Corredor, and C. Ferro. 2001. Genetic variability among populations of Lutzomyia (Psathyromyia) shannoni (Dyar 1929) (Diptera: Psychodidae: Phlebotominae) in Colombia. Mem. Inst. Oswaldo Cruz 96: 189 Ð196. Caterino, M. S., S. Cho, and F. Sperling. 2000. The current state of insect molecular systematics: a thriving tower of Babel. Annu. Rev. Entomol. 45: 1Ð54. Cazorla, D., And M. Acosta. 2003. Multivariate morphometric discrimination among three species of Lutzomyia subgenus Micropygomyia (Diptera: Psychodidae). J. Med. Entomol. 40: 750 Ð754. Christensen, H. A., and A. M. de Vasquez. 1982. The treebuttress biotope: a pathobiocenose of Leishmania braziliensis. Am. J. Trop. Med. Hyg. 31: 243Ð251. Claridge, M. F., and M. C. Gillham. 1992. Variation in populations of leafhoppers and planthoppers (Auchenorrhyncha): biotypes and biological species, pp. 241Ð259. In J. T. Sorensen and R. Foottit (eds.), Ordination in the Study of Morphology, Evolution and Systematics of Insects: Applications and Quantitative Genetic Rationals. Elsevier Publishers B.V., New York, NY. Clement, M., D. Posada, and K. Crandall. 2000. TCS: a computer program to estimate gene genealogies. Mol. Ecol. 9: 1657Ð1660. Clements, A. N. 2000. The Biology of Mosquitoes, vol. 1. CABI Publishing, Oxon, United Kingdom. Comer, J. A., and J. L. Corn. 1991. Funnel trap for the capture of Phlebotomine sand ßies (Diptera: Pschodidae) from tree holes. J. Med. Entomol. 28: 289 Ð292. Comer, J. A., D. E. Stallknecht, J. L. Corn, and V. F. Nettles. 1991. Lutzomyia shannoni (Diptera: Psychodidae): a biological vector of the New Jersey serotype of vesicular stomatitis virus on Ossabaw Island, Georgia. Parassitologia 33(Suppl. 1): 151Ð158. Comer, J. A., D. M. Kavanaugh, D. E. Stallnecht, G. O. Ware, J. L. Corn, and V. F. Nettles. 1993. Effect of forest type on the distribution of Lutzomyia shannoni (Diptera: Psychodidae) and vesicular stomatitis virus on Ossabaw Island, Georgia. J. Med. Entomol. 30: 555Ð560. Depaquit, J., H. Ferte, N. Leger, R. Killick-Kendrick, J. Rioux, M. Killick-Kendrick, H. Hanafi, and S. Gobert. 2000. Molecular systematics of the Phlebotomine sandßies of the subgenus Paraphlebotomus (Diptera, Psychodidae, Phlebotomus) based on ITS2 rDNA sequences: hypotheses of dispersion and speciation. Insect Mol. Biol. 9: 293Ð 230. Depaquit, J., F. Hubert, N. Leger, F. Lefranc, C. Alves-Pires, H. Hanafi, M. Maroli, F. Moriallas-Marquez, J. Rioux, M. Svobodova, and P. Volf. 2002a. ITS 2 sequences heterogeneity in Phlebotomus sergenti and Phlebotomus similis (Diptera, Pscychodidae): possible consequences in their
165
ability to transmit Leishmania tropica. Int. J. Parasitol. 32: 1123Ð1131. Depaquit, J., N. Leger, and V. Robert. 2002b. First record of Phlebotomus from Madagascar (Diptera: Psychodidae): description of Phlebotomus (Anaphlebotomus) fertei n. sp. and Phlebotomus (Anaphlebotomus) huberti n. sp. Parasite 9: 325Ð331. Depaquit, J., N. Leger, and V. Robert. 2004. Phlebotomus from Madagascar (Diptera: Psycholdidae). III. Description of Phlebotomus (Anaphlebotomus) fontenillei n. sp. Parasite 11: 261Ð265. Dias, E. S., R. A. Barata, C. L. Fortes-Dias, R. P. Brazil, J. C. Miranda, S. Barandao Filho, and P. M. Linardi. 1999. Morphometric and phonetic studies of Þve geographical populations of Lutzomyia whitmani (Diptera: Psychodidae) in Brazil. J. Med. Entomol. 36: 846 Ð 850. Di Muccio, T., M. Marinucci, L. Frusteri, M. Maroli, B. Pesson, and M. Gramiccia. 2000. Phylogenetic analysis of Phlebotomus species belonging to the subgenus Larroussius (Diptera, Psychodidae) by ITS2 rDNA sequences. Insect Biochem. Mol. Biol. 30: 387Ð393. Dujardin, J., and F. Le Pont. 2004. Geographic variation of metric properties within the neotropical sandßies. Infect. Genet. Evol. 4: 353Ð359. Dujardin, J. P., F. Le Pont, and E. Martinez. 1999a. Quantitative phentics and taxonomy of some phlebotomine taxa. Mem. Inst. Oswaldo Cruz 94: 735Ð741. Dujardin, J., F. Le Pont, and E. A. Brachi Galacti. 1999b. Cryptic speciation suspected by morphometry within Lutzomyia runoides. Life Sci. 322: 375Ð382. Dujardin, J. P., F. Le Pont, and E. Martinez. 2004. Is Lutzomyia serrana (Diptera, Psychodidae, Phlebotominae) present in Ecuador? Parasite 1: 211Ð217. Dujardin, J., F. Le Pont, A. Matias, and J. X. De la Riva. 2005. Morphometric evidence of speciation within Bolivian Lutzomyia aragaoi (Diptera: Psychodidae). Infect. Genet. Evol. 5: 362Ð365. Eldridge, B. E. 2004. The epidemiology of arthropodborne diseases, pp. 165Ð186. In B. F. Eldridge and J. D. Edman (eds.), Medical Entomology. Kluwer Academic Publishers, Norwell, MA. Hall, B. G. 2001. Phylogenetic Trees Made Easy: A How-To Manual for Molecular Biologists. Sinauer, Sunderland, MA. Hebert, P.D.N., A. Cywinska, S. L. Ball, and J. R. deWaard. 2003. Biological identiÞcations through DNA barcodes. Proc. R. Soc. Lond. 270: 313Ð321. Kambhampati, S., and P. T. Smith. 1995. PCR primers for the ampliÞcation of four insect mitochondrial gene fragments. Insect Mol. Biol. 4: 233Ð236. Kiyoshi, T., and T. Sota. 2006. Differentiation of the dragonßy genus Davidius (Odonata: Gomphidae) in Japan inferred from mitochondrial and nuclear gene genealogies. Zool. Sci. 23: 1Ð 8. Klingenberg, C. P. 1996. Multivariate allometry, pp. 23Ð 49. In L. F. Marcus, M. Corti, A. Loy, G.J.P. Naylor, and D. Slice (eds.), Advances in Morphometrics. Proceedings of the 1993 NATO-ASI on Morphometrics, NATO ASI, Ser. A, Life Sciences, 18 Ð30 July 1993, Tuscany, Italy. Plenum Publishers, New York, NY. Knaden, M., A. Tinaut, X. Cerda, S. Wehner, and R. Wehner. 2005. Phylogeny of three parapatric species of desert ants, Cataglyphis bicolor, C. viatica, and C. savignyi: a comparison of mitochondrial DNA, nuclear DNA, and morphological data. Zoology 108: 169 Ð177. Kuwahara, K., K. Hirotomo, E. A. Gomez, U. Hiroshi, T. Mimorid, Y. Yamamotoc, M. Calvopinae, A. G. Ca´ ceres, H. Iwata, and Y. Hashiguchi. 2009. Genetic diversity of
166
JOURNAL OF MEDICAL ENTOMOLOGY
ribosomal RNA internal transcribed spacer sequences in Lutzomyia species from areas endemic for New World cutaneous leishmaniasis. Acta Trop. 112: 131Ð136. Larkin, L. L., J. L. Neff, and B. B. Simpson. 2006. Phylogeny of the Callandrena subgenus of Andrena (Hymenoptera: Andrenidae) based on mitochondrial and nuclear DNA data: polyphyly and convergent evolution. Mol. Phylogenet. Evol. 38: 330 Ð343. Lawyer, P. G. 1984. Biology and colonization of the sand ßy Lutzomyia diabolica (Hall) (Diptera: Psychodidae) with notes on its potential relationship to human cutaneous leishmaniasis in Texas, U.S.A. Ph.D. dissertation, University of Florida, Gainesville. Lawyer, P. G., and D. Young. 1987. Experimental transmission of Leishmania mexicana to hamsters by bites of Phlebotomine sand ßies (Diptera: Psychodidae) from the United States. J. Med. Entomol. 24: 458 Ð 462. Malhotra, A., and R. S. Thorpe. 2004. Maximizing information in systematic revisions: a combined molecular and morphological analysis of a cryptic green pitviper complex (Trimeresurus stejnegeri). Biol. J. Linn. Soc. Lond. 82: 219 Ð235. Margonari, C. S., C. L. Fortes-Dias, and E. S. Dias. 2004. Genetic variability in geographical populations of Lutzomyia whitmani elucidated by RAPD-PCR. J. Med. Entomol. 41: 187Ð192. Mayr, E. 2001. What Evolution Is. Basic Books, member of Perseus Book Group, New York, NY. Mayr, E., and P. Ashlock. 1991. Principles of Systematic Zoology, 2nd ed. McGraw-Hill, New York, NY. McPherson, M. J., and S. G. Moller. 2000. PCR. BIOS ScientiÞc Publishers Limited, Oxford, United Kingdom. Miles, M. A., J. R. Arias, S. A. Valente, R. D. Naiff, A. A. de Souza, M. M. Povoa, J. A. Lima, and R. A. Cedillos. 1983. Vertebrate hosts and vectors of Trypanosoma rangeli in the Amazon Basin of Brazil. Am. J. Trop. Med. Hyg. 32: 1251Ð1259. Miller, B. R., M. Crabtree, and H. Savage. 1997. Phylogenetic relationships of the Culicomorpha inferred from 18S and 5.8S ribosomal DNA sequences (Diptera: Nematocera). Insect Mol. Biol. 6: 105Ð114. Mukhopadhyay, J., K. Ghosh, C. Ferro, and L. Munstermann. 2001. Distribution of phlebotomine sand ßy genotypes (Lutzomyia shannoni Diptera: Psychodidae) across a highly heterogeneous landscape. J. Med. Entomol. 38: 260 Ð267. Nylander, J.A.A. 2004. MrModeltest v2. Program distributed by the author. Evolutionary Biology Centre, Uppsala University, Uppsala, Sweden. Paquin, P., and M. Hedin. 2004. The power and perils of Ômolecular taxonomyÕ: a case study of eyeless and endangered Cicurina (Araneae: Dictynidae) from Texas caves. Mol. Ecol. 13: 3239 Ð3255. Patsoula, E., A. Samainidou-Voyadjoglou, G. Spanakos, J. Kremastinou, G. Nasioulas, and N. Vakalis. 2006. Molecular and morphological characterization of Aedes albopictus in Northwestern Greece and differentiation from Aedes cretinus and Aedes aegypti. J. Med. Entomol. 43: 40 Ð54. Pimentel, R. A. 1992. An introduction to ordination, principal components analysis and discriminant analysis, pp. 11Ð28. In J. T. Sorensen and R. Foottit (eds.), Ordination in the Study of Morphology, Evolution and Systematics of Insects: Applications and Quantitative Genetic Rationals. Elsevier Publishers, New York, NY.
Vol. 48, no. 2
Pinto, I. S., J. D. Andrade Filho, C. B. Santos, A. Falqueto, and Y.L.R. Leite. 2010. Phylogenetic relationships among species of Lutzomyia, subgenus Lutzomyia (Diptera: Psychodidae). J. Med. Entomol. 47: 16 Ð21. Price, D. C., D. E. Gunther, and R. Gaugler. 2011. First collection records of Phlebotomine sand ßies (Diptera: Psychodidae) from New Jersey. J. Med. Entomol. (in press). Rangel, E. F., R. Lainson, A. A. Souza, P. Ready, and A. C. Azevedo. 1996. Variation between geographical populations of Lutzomyia (Nysssomyia) whitmani (Antunes & Coutinho, 1939) sensu lato (Diptera: Psychodidae: Phlebotominae) in Brazil. Mem. Inst. Oswaldo Cruz 91: 43Ð50. Ronquist, F., and J. P. Huelsenbeck. 2003. MrBayes3: Bayesian phylogenetic inference under mixed models. Bioinformatics 19: 1572Ð1574. Rowton, E., M. de Mata, N. Rizzo, T. Navin, and C. Porter. 1991. Vectors of Leishmania braziliensis in the Peten, Guatemala. Parassitologia 33: 501Ð504. Rozeboom, L. E. 1944. Phlebotomus limai Fonseca in the United States (Diptera: Psychodidae). J. Parasitol. 30: 274 Ð275. Saitou, N., and M. Nei. 1987. The neighbor-joining method: a new method for reconstructing guide trees. Mol. Biol. Evol. 4: 406 Ð 425. Solbrig, O. T. and D. J. Solbrig. 1979. Introduction to Population Biology and Evolution. Addison-Wesley Publishing Company, Reading, MA. Song, H., J. E. Buhay, M. F. Whiting, and K. A. Crandal. 2008. Many species in one: DNA barcoding overestimates the number of species when nuclear mitochondrial pseudogenes are coampliÞed. Proc. Natl. Acad. Sci. USA 105: 13486 Ð13491. Swofford, D. L. 2002. PAUP phylogenetic analysis using parsimony (and other methods), version 4.0b10. Sinauer, Sunderland, MA. Torgerson, D. G., M. Lampo, Y. Velazquez, and P.T.K. Woo. 2003. Genetic relationships among some species groups within the genus Lutzomyia (Diptera: Psychodidae). Am. J. Trop. Med. Hyg. 69: 484 Ð 493. Tun-lin, W., T. R. Burkot, and B. H. Kay. 2000. Effects of temperature and larval diet on development rates and survival of the dengue vector Aedes aegypti in north Queensland, Australia. Med. Vet. Entomol. 14: 31Ð37. Young, D. G., and M. A. Duncan. 1994. Guide to the identiÞcation and geographic distribution of Lutzomyia sand ßies in Mexico, the West Indies, Central and South America (Diptera: Psychodidae). Associated Publishers-American Entomological Institute, Gainesville, FL. Young, D. G., and P. V. Perkins. 1984. Phlebotomine sand ßies of North America (Diptera: Psychodidae). Mosq. News, J. Am. Mosq. Control Assoc. 44: 263Ð304. Zhang, A. B., K. Kubota, Y. Takami, J. L. Kim, J. K. Kim, and T. Sota. 2005. Species status and phylogeography of two closely related Coptolabrus species (Coleoptera: Carabidae) in South Korea inferred from mitochondrial and nuclear gene sequences. Mol. Ecol. 14: 3823Ð3841. Zuur, A. F., E. N. Ieno, and G. M. Smith. 2007. Introduction to Discriminant Analysis, pp. 245Ð255, Ch. 14. In Analysing Ecological Data. Springer Science ⫹ Business Media, LLC, New York, NY. Received 20 August 2010; accepted 10 November 2010.