Directional Spread of Septoria Leaf Spot in Tomato Rows S. K. Parker, F. W. Nutter, Jr., and M. L. Gleason, Department of Plant Pathology, Iowa State University, Ames 50011 ABSTRACT Parker, S. K., Nutter, F. W., Jr., and Gleason, M. L. 1997. Directional spread of Septoria leaf spot in tomato rows. Plant Dis. 81:272-276. Disease severity of Septoria leaf spot in rows of fresh-market tomato plants that were not staked was assessed in 1992 and 1993 following inoculation of the center plant in each row. Both temporal disease increase and spatial disease gradients were best described by the logistic model. Apparent infection rates for Septoria leaf spot epidemics averaged 0.282 day-1 (SE = 0.015, r2 = 0.96, P < 0.0001) in 1992 and 0.260 day-1 (SE = 0.011, r2 = 0.96, P < 0.0001) in 1993. Apparent infection rates remained relatively constant at increasing distances from initial foci. Estimated values for disease gradient slopes 3 to 5 weeks after inoculation ranged from –0.26 to –1.05 m-1. Velocities of disease spread ranged from 0.3 to 1.3 m/day. Results of analysis of disease severity data for these 2 years suggest that Septoria leaf spot epidemics can develop at rapid rates, but steep disease gradients limit the velocity of spread. Additional keywords: Septoria lycopersici
Septoria leaf spot of tomatoes, caused by Septoria lycopersici Speg., is an important part of the fungal disease complex affecting tomato production in the midwestern and northeastern United States and southeastern Canada. Traditionally, commercial growers in these regions controlled the predominant fungal diseases (early blight, caused by Alternaria solani Sorauer; anthracnose, caused by Colletotrichum coccodes (Wallr.) S.J. Hughes; and Septoria leaf spot) by applying fungicides every 7 to 14 days throughout the growing season. In the last few years, many commercial growers in these regions have begun to use weather-based models, based on epidemiological data for early blight, to schedule fungicide sprays to control all three diseases (8). To date, control of Septoria leaf spot achieved using existing models has been satisfactory (8), but there is little data to demonstrate how existing models describe the epidemiology of this particular disease and whether or not the models might be improved to reduce damage caused by Septoria leaf spot. In view of increasing fungicide costs, increasing regulation of all pesticides, and intensifying economic pressures to maximize the
efficiency of crop production, a better understanding of Septoria leaf spot epidemiology is needed. Additional information is needed to determine the level of risk Septoria leaf spot presents to growers, how environmental factors contribute to epidemic development, and when fungicide applications will be most effective. The roles of environmental factors limiting or favoring Septoria leaf spot epidemics are not well understood. Ferrandino and Elmer reported temporal disease increase rates for Septoria leaf spot epidemics in plots of fresh-market tomatoes (5); however, data from additional years and geographical locations are needed to obtain a better understanding of the risk of Septoria leaf spot damage under various cultural and environmental conditions. Parker et al. (15) demonstrated the importance of rain events for the dissemination of S. lycopersici spores to new infection sites, but the contribution of multiple rain events to epidemic development has not been studied. In this study, Septoria leaf spot epidemics were monitored in 1992 and 1993 with the objectives of describing temporal and spatial disease progress along rows and further examining the relationship between disease increase and rainfall events.
Corresponding author: S. K. Parker E-mail:
[email protected]
MATERIALS AND METHODS Field plots. Field experiments were conducted at the Iowa State University Horticulture Farm near Gilbert, Iowa, on land not previously planted to tomatoes. In 1992, three 6.1 × 18.3 m blocks were established in a 50 × 25 m site. In 1993, plots of the same size were located 100 m south of the 1992 location. Strips (12.2 m) of unmowed grass were maintained between plots as dispersal barriers. Five-week-old
Journal Paper No. J-16623 of the Iowa Agriculture and Home Economics Experiment Station, Ames, Iowa. Project No. 3206, supported by Hatch Act and State of Iowa funds. Accepted for publication 20 November 1996.
Publication no. D-1997-0109-06R © 1997 The American Phytopathological Society
272
Plant Disease / Vol. 81 No. 3
determinate, fresh-market seedlings (cv. New Yorker) were transplanted into the field on 20 May in 1992 and on 26 May in 1993. Each replicate block (oriented east– west) contained a single 15-m row of 25 plants placed 60 cm apart; plants were not staked. Rows were side-dressed with 46-00 urea (465 g per row) at 3 and 4 weeks after transplanting in 1993 and 1992, respectively. Herbicide (trifluralin, 0.33 liters/ha) and 13-13-13 fertilizer (446 kg/ha) were applied before transplanting. Insects were controlled with esfenvalerate (Asana 0.66 EC, E. I. DuPont de Nemours and Company, Wilmington, DE) applied at a rate of 0.16 kg a.i./ha every 7 to 14 days beginning 2 weeks after transplanting. Relative humidity, rainfall, average wind speed, wetness duration, and air temperature were recorded at hourly intervals with a CR-10 datalogger (Campbell Scientific, Inc., Logan, UT) located 0.5 km from the site. Inoculum. S. lycopersici was isolated in 1991 from a garden plant located in Nevada, Iowa. The isolate was stored on potato-dextrose agar slants at 5°C and reisolated from greenhouse plants each year. For inoculum production, cirrhal masses were transferred from slants to 10-cm-diameter petri dishes containing tomato leaf extract agar (C. Block, USDA Plant Introduction Station, Ames, IA, personal communication). Spore masses were placed in 2 to 3 drops of sterile water and spread over the agar surface. After 3 weeks, plates containing sporulating colonies were flooded with 15 ml of sterile water containing Tween 20 (1 drop/100 ml) for 10 min, then rubbed with a bent glass rod. The spore suspension was filtered through two Kimwipes (Kimberly-Clark Corp., Roswell, GA), and inoculum concentration was determined using a hemacytometer. Inoculum used in 1992 contained 1.0 × 10⁶ spores per ml. In 1993, inoculum contained 2.1 × 10⁵ spores per ml because fewer spores were obtained from cultures. Field inoculations were performed on 2 July in both years; temperatures were relatively cool (maximum temperatures were 22°C in 1992 and 28°C in 1993), so inoculations were performed midday. A hand-trigger spray bottle was used to apply spore suspension to the point of runoff (approximately 60 ml per plant) on the center plant in each row. During the procedure, plants to be inoculated were surrounded by cardboard shields to minimize spray drift to adjacent plants. Disease assessment and data analysis. Disease severity was assessed at 60-cm
intervals within each plot by estimating the proportion of defoliation (leaves either abscised or completely necrotic) per plant. Between 2 July and 18 August, disease severity was assessed five times in 1992 and seven times in 1993. Variation in percent defoliation values for intervals within rows was examined for differences among plots, distances from the inoculated focus, and assessment dates using PROC GLM (17). A split-plot design was used for the study, with distances (60-cm row segments) as main plot treatments and assessment dates (a repeated measure) as subplot treatments. Because spore dispersal patterns reflected differences in rainfall events (15), defoliation data for each year were analyzed separately. The linear effects of distance from foci (spatial gradients) and date of assessment (temporal gradients) were considered significant when F values for regression models yielded values for P ≤ 0.05. Gradients were quantified by fitting linear regression equations to logistically transformed data. Differences in disease development patterns to the east and west of initial foci were examined using orthogonal comparisons. Preliminary analyses showed that temporal progress was best described by transforming mean defoliation values (y) to logits {ln[y/(1 – y)]} to achieve linearity. Apparent infection rates (r) (19) at 60-cm distance intervals within rows were calculated by regressing logit(y) against time (days) for each distance interval (1,13). Analysis of variance was used to examine trends in apparent infection rates associated with direction and distance from foci (1,3). Data for distance intervals within rows were pooled prior to conducting regression analysis to obtain average apparent infection rates for individual plots and for east and west directions. Disease gradients for each assessment date were summarized by linear regression equations in accordance with the exponential, inverse power law, Berger and Luke, and Minogue and Fry models (3). Because visual inspection of disease progress data revealed differences associated with wind direction, data for east and west directions in each plot were analyzed separately. Observations of disease severity (y) ≤ 0.01 or ≥ 0.99 were undefined following transformation and therefore omitted from analyses (14). Model goodness-of-fit was determined from F statistics, r2 values, and examination of plots of residuals (3). The best-fit model was used to identify dates with similar gradient slopes, and the gradient parameter g was estimated from pooled data for these dates. Because time and space are required for a disease gradient to develop, observations made early in the course of an epidemic were disregarded (14), as were observations made at later stages, when defoliation exceeded 99% over much of the plots.
The velocity of spread (v) was estimated as change in s50 (the distance at which y = 50%) divided by change in time (t). Values for s50 were obtained from logistic equations for disease gradients. Velocities were calculated separately for disease spread east and west of initial foci. Estimated
velocities were compared with values obtained by solving the equation g = r/v using pooled estimates of g and r (1,13). Relationships between disease progress and cumulative rain activity (expressed as the number of hours with rainfall, number of days with rainfall, and rainfall amount)
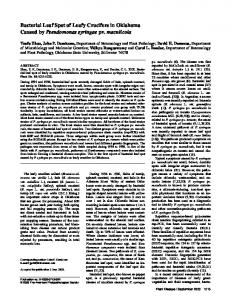
Fig. 1. Defoliation of tomato plants due to Septoria leaf spot in (A) 1992 and (B) 1993. The percentage of abscised or necrotic leaves was assessed over 60-cm intervals along 15-m rows following spray-inoculation of the center plant on 2 July. Disease severity values at each distance from the center are means for three plots.
Table 1. Analysis of variation in the proportion of defoliation due to Septoria leaf spot at 60-cm intervals along linear plantings of tomatoes (cv. New Yorker) in 1992 and 1993 1992 Sourcea,b Block Distance from focus Linear Lack of fit Date Linear Lack of fit Date × distance from focus Linear Lack of fit
F 7.87 16.07 175.82 0.93 347.63 1,355 35.37 4.15 55.63 18.69
1993 Prob > F
F
Prob > F
0.0012 0.0001 0.0001 0.5153 0.0001 0.0001 0.0001 0.0001 0.0001 0.0001
1.41 15.24 141.63 41.28 1145.14 6,690 175.95 6.16 184.50 152.93
0.2543 0.0001 0.0001 0.0001 0.0001 0.0001 0.0001 0.0001 0.0001 0.0001
a
Defoliation was assessed in three replicate plots, each containing 25 plants spaced 60 cm apart in a single 15-m row. b Experiments were analyzed as split-plot designs with positions within rows as main plots and assessment dates as subplots. Plant Disease / March 1997
273
during the assessment period were examined by using correlation and regression analyses. Because of severe disease development, yields in all plots were extremely poor and were not compared. RESULTS Disease progress. In both years, numerous lesions caused by S. lycopersici were present on spray-inoculated plants (initial foci) 1 week after inoculation. At 2 weeks, lesions were evident on tomato plants adjacent to the inoculated plants. In 1992 and 1993, plots were nearly 100% defoliated within 6 weeks after inoculation (Fig. 1). Water-soaking caused by driving rain and
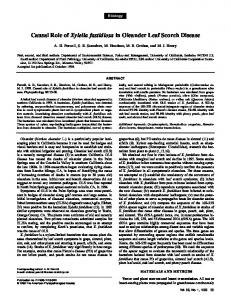
early blight lesions were noted in June 1993, but early blight severity on individual plants was generally less than 10% of total leaf area of affected plants and did not seem to contribute to defoliation. Analysis of variance identified a significant interaction between distance from foci and time, indicating that levels of disease depended upon both the distance from the inoculum source and the date on which disease was assessed (Table 1). Temporal disease progress was best described by the logistic growth model (3). Overall apparent infection rates in the three plots averaged 0.282 (SE = 0.015, r2 = 0.96, P < 0.0001) in 1992 and 0.260 (SE = 0.011, r2 = 0.96, P < 0.0001) in 1993. Apparent infection rates for 60-cm intervals within rows ranged from 0.16 to 0.42 day-1, with considerable random variation; no trend was associated with distance (data not shown). Disease developed more rapidly in the eastern half of each plot (downwind from the focus) than in the western half (Fig. 1). Orthogonal comparisons identified significant differences in overall mean defoliation, change in defoliation through time, and change in defoliation with distance (Prob > F = 0.0001) for plants east and west of initial foci. These differences were noted in both years. A second disease focus appeared on the eastern end of one block in 1993, resulting in 30% defoliation of the easternmost plant in this row as early as 13 July. Data from this end of the plot were omitted from analysis. Spatial gradients. Of the five gradient models examined, the logistic model (13) best fit the regression of disease severity on distance. Gradient slopes for individual dates during the two epidemics ranged from –0.17 to –1.14 (data not shown). Gradient slopes were relatively stable during the period 3 to 5 weeks after inoculation (Fig. 2). Estimates of g, pooled for dates 3 to 5 weeks after inoculation, are presented in Table 2. Estimates of velocity of spread in individual plots ranged from 0.3 to 6.0 m/day, with most values within 0.3 to 0.5 m/day. Regression analysis of ∆s50/∆t for pooled data yielded velocities similar in magnitude to estimates obtained from solutions for g = r/v (Table 2).
Temperature and rainfall data for 1992 and 1993 are presented in Figure 3. Mean defoliation on each observation date, transformed to logits, was linearly related to the number of days after inoculation and to the cumulative amount of rainfall (Table 3). Cumulative rain activity, expressed as hours with rainfall (not examined in 1993), days with rainfall, and amount (cm) of rainfall were all positively correlated to time (r = 0.95 to 0.99) in both years. DISCUSSION The high apparent infection rates in our tomato plantings show the explosive potential of Septoria leaf spot epidemics during wet growing seasons. In this study, apparent infection rates for Septoria leaf spot ranged from 0.22 to 0.33 day-1, slightly below the 0.247 to 0.435 day-1 range reported for potato late blight epidemics (3). Ferrandino and Elmer (5) reported a lower range of apparent infection rates (0.06 to 0.28 day-1) for Septoria leaf spot epidemics in row plantings in 1988 and 1989. In comparison, apparent infection rates for tomato early blight epidemics, based on percent disease, were reported to be 0.074 to 0.136 day-1 (12,16). This range is less than half the average apparent infection rate calculated for Septoria leaf spot disease development in the present study and thus represents a lower potential risk relative to Septoria leaf spot. Ferrandino and Elmer reported that an inverse power law best described the lesion density gradients of Septoria leaf spot within rows of trap plants (6,7); however, we found that the logistic model best fit defoliation gradients in the present study. The difference in model selection may be due to the use of a different measure of disease severity (Ferrandino and Elmer measured number of lesions, whereas we calculated percentage of defoliation), the distance over which observations were made, environment, and cultivar. Alderman et al. (1) advocated the use of defoliation data for identifying gradients at later stages of epidemics, whereas lesion data is more appropriate for studying primary gradients. We chose to monitor defoliation because it is related directly to yield loss (5,11).
Table 2. Estimated values of the apparent infection rate (r), gradient parameter (g), and velocity of spread (v) for Septoria leaf spot epidemics in linear tomato plantings in 1992 and 1993
Fig. 2. Disease gradients estimated from logittransformed disease severity data for observation dates in (A, B) 1992 and (C, D) 1993 with similar gradient slopes. Gradients (A, C) east and (B, D) west of initial foci were analyzed separately. Gradient parameters for 23 July to 4 August (1992) and 27 July to 1 August (1993) were averaged and used to estimate velocities of spread for Septoria leaf spot epidemics. Plots were inoculated on 2 July in both years. 274
Plant Disease / Vol. 81 No. 3
Year
Direction from focusa
r (day-1)b
g (m-1)c
v (m/day)d
1992
East West East West
0.22 0.28 0.28 0.33
0.70 0.65 0.26 1.053
0.40 0.53 1.32 0.39
1993 a
Disease progress data for directions east and west of initial foci were analyzed separately. Calculated as the slope of the regression of disease severity (logits) on time in three plots, and averaged over distances 180 to 720 cm from initial disease foci. c Change in disease severity (logits) with distance, pooled over three rating dates (22, 34, and 37 days past inoculation in 1992; 26, 31, and 36 days past inoculation in 1993). d Calculated as the slope of the regression of the distance at which y = 50% (s ) on the number of 50 days after inoculation. b
Gradient slopes were steep during stable periods for epidemics in 1992 and 1993. The rapid decline in disease severity with distance from the focus is influenced by the selection of defoliation as the measure of disease severity; one might expect to see more shallow gradients associated with measures of lesion density or incidence, which may exhibit a density distribution with a longer tail. Also, the values for g probably reflect the localized spore distribution pattern that would be expected for a splash-dispersed pathogen such as S. lycopersici (15). Lesion density gradients measured on trap plants suggest that dispersal of this pathogen is influenced greatly by the mechanics of splash dispersal, although wind conditions influence the shape of disease gradients (7,15). The velocity of spread is inversely proportional to the steepness of the disease gradient (13); consequently, although we observed extremely fast rates of disease progress, values for the velocity of spread were moderate (0.3 to 0.5 m/day). These values were similar to those recorded for another splash-dispersed pathogen, S. nodorum (0.3 m/day) (10). Velocities of spread reported for two diseases with airdispersed propagules range in value from 0.03 to 0.06 m/day for defoliation of peanut due to late leaf spot (causal agent, Cercosporidium personatum (Berk. & Curt.) Deighton) (1) to 3 to 4 m/day for spread of late blight in potato plots (14). We estimated velocity of spread to demonstrate the integration of spatial and temporal analyses of Septoria leaf spot epidemics and for descriptive purposes. Minogue and Fry demonstrated that the integration of spatial and temporal analyses provides additional information on the consequences of employing disease management strategies (e.g., fungicide application and disease resistance) (14). Estimates of velocity of spread, considered along with yield data and estimates of disease severity (e.g., area under the disease progress curve) (3) may prove useful for evaluating the effectiveness of disease management strategies in future studies. As a descriptive tool, velocity of spread provides additional information about Septoria leaf spot of tomatoes, a disease that is described infrequently during this era of regular fungicide use. Reports for other pathosystems give disease velocities ranging from 0.2 to 4.0 m/day (7). Although direct comparison of parameter estimates for the epidemics in our study and those reported for other pathosystems is not possible, the information obtained in the current study, when considered with information obtained for other epidemics, is useful for visualizing the progress of the 1992 and 1993 epidemics. Directional differences in disease development suggest that wind-driven rain, as well as rain splash (15), influenced the dispersal of secondary inoculum. This concurs with the conclusions reached by
Ferrandino and Elmer, who observed Septoria leaf spot lesions on trap plants placed up to 100 m from an inoculum source (7). Our weather equipment recorded mean hourly wind speed but did not directly monitor wind direction and maximum wind speed during gusts. Personal observations of weather conditions support the idea that prevailing winds from the west probably contributed to faster disease progress to the east of initial foci. Parker et al. (15) demonstrated that significant increases in the number of new Septoria leaf spot lesions were associated
with splash dispersal during rainfall events. The relationship between rainfall (expressed as days with rain or rainfall events exceeding a minimum amount) and disease severity has been used to develop several models predicting the severity of wheat diseases caused by Septoria spp. (4,9,18). The frequency of rain events in 1992 and 1993 made it difficult to assess the contribution of individual rain events to disease increase by measuring defoliation. However, the importance of rainfall for the development of Septoria leaf spot epidemics is supported by the linear relationship
Fig. 3. Daily minimum ( ⋅ ) and maximum (⋅⋅⋅⋅⋅⋅) temperatures and daily rainfall (vertical lines) at the Iowa State University Horticulture Farm in 1992 and 1993. In 1992, a total of 25.45 cm of rain fell on 23 dates from 2 July to 14 August. In 1993, total precipitation of 58.29 cm fell on 33 dates from 2 July to 18 August. Table 3. Parameter estimates and standard errors (SE) for linear equationsa describing relationships between mean defoliation in plots and epidemic duration (days past inoculation), cumulative rainfall, cumulative rain days, and cumulative hours with rainfallb Year
Independent variable
1992
Cumulative rainfall (cm) Cumulative days with rain Cumulative h with rain c Days past inoculation Cumulative rainfall (cm) Cumulative days with rain Days past inoculation
1993
b0 ± SE
b1 ± SE
r2
Prob > F
–8.9 ± 0.5 –8.8 ± 0.5 –8.5 ± 0.6 –8.5 ± 0.5 –9.9 ± 0.6 –8.4 ± 0.3 –8.9 ± 0.3
0.499 ± 0.024 0.535 ± 0.029 0.146 ± 0.009 0.282 ± 0.015 0.226 ± 0.015 0.383 ± 0.015 0.260 ± 0.011
0.96 0.95 0.94 0.96 0.91 0.97 0.96
0.0001 0.0001 0.0001 0.0001 0.0001 0.0001 0.0001
a
Linear relationships were best approximated by applying the logistic transformation to defoliation data, as determined from r2 values and examination of plots of residuals. b Rainfall data were recorded hourly at stations located 0.5 km from the field site. c Not determined in 1993. Plant Disease / March 1997
275
between rain activity (cumulative rainfall, number of days with rain) and disease increase seen in this study. Other measures of disease intensity, such as the incidence of infected leaflets or number of lesions per leaf (15), would be more appropriate for assessing spore dissemination patterns to detect disease increase resulting from discrete rain events. This approach was used successfully for trap plant studies (7,15) and could be applied to studies in established plantings. The high apparent infection rates indicate clearly that Septoria leaf spot defoliation can proceed quickly to severe levels when weather conditions are favorable. Whether or not defoliation results in economic losses may depend on the timing of defoliation relative to time to harvest. Ferrandino and Elmer reported that yields of fresh-market tomatoes were not reduced when the level of defoliation remained below 50% in mid-August (5). Brammall (2) found that the yields of 13 fresh-market cultivars protected from early blight according to the TOM-CAST program did not differ significantly from yields in unsprayed plots; in Brammall’s study, final defoliation levels did not exceed 20%. But in all studies, inoculum was not introduced until July. We did not collect yield data because we were interested in monitoring epidemic development in the absence of fungicide protection and did not include fungicide-treated plants in our study. Given the presence of inoculum early in the season, the apparent infection rates seen in our study could result in substantial yield losses. Severe defoliation occurring in July or early August may have more severe consequences for yields of processing tomatoes, which typically mature later in the season than fresh-market cultivars. This report, the first to quantify both temporal disease increase and spatial gradients for Septoria leaf spot epidemics on tomato, provides key information regarding the nature of Septoria leaf spot epidemics. The fast infection rates ob-
276
Plant Disease / Vol. 81 No. 3
served in this study indicate that epidemics may result in yield-threatening levels of defoliation in a very short time; hence, it is important for growers to maintain adequate protection against Septoria leaf spot. Because tomato plants tolerate moderate levels of defoliation late in the season before yields are affected (2,5), disease management may be most important at earlier stages of crop development. Further research is needed on the effects of extent and timing of defoliation, however, to determine when crops are at risk from Septoria leaf spot and other defoliating diseases. Also, to validate existing and future disease-warning models, quantitative information on the effects of environmental conditions on pathogen development is needed so that protection is not compromised during periods favorable for Septoria leaf spot epidemics. Disease gradient data confirm the influence of splash dispersal mechanisms and underline the importance of rainfall events for epidemic development. Rainfall data may provide the basis for an effective disease-prediction model for Septoria leaf spot. By itself, a rainfall-based model for Septoria leaf spot could be implemented with a minimum input of time and equipment (an advantage for growers), or a Septoria leaf spot model could be added to one of the existing disease-warning models for early blight (8,12,16). Continued investigations in these areas will help phytopathologists evaluate the risks presented by a complex of diseases affecting tomato crops and target control efforts to critical periods. LITERATURE CITED 1. Alderman, S. C., Nutter, F. W., Jr., and Labrinos, J. L. 1989. Spatial and temporal analysis of spread of late leaf spot of peanut. Phytopathology 79:837-844. 2. Brammall, R. A. 1993. Effect of foliar fungicide treatment on early blight and yield of fresh market tomato in Ontario. Plant Dis. 77:484-488. 3. Campbell, C. L., and Madden, L. V. 1990. Introduction to Plant Disease Epidemiology.
John Wiley & Sons, New York. 4. Coakley, S. M., McDaniel, L. R., and Shaner, G. 1985. Model for predicting severity of Septoria tritici blotch on winter wheat. Phytopathology 75:1245-1251. 5. Ferrandino, F. J., and Elmer, W. H. 1992. Reduction in tomato yield due to Septoria leaf spot. Plant Dis. 76:208-211. 6. Ferrandino, F. J., and Elmer, W. H. 1993. Septoria leaf epidemics within linear plantings of tomatoes. (Abstr.) Phytopathology 83:243. 7. Ferrandino, F. J., and Elmer, W. H. 1996. Septoria leaf spot lesion density on trap plants exposed at varying distances from infected tomatoes. Plant Dis. 80:1059-1062. 8. Gleason, M. L., MacNab, A. A., Pitblado, R. E., Ricker, M. D., East, D. A., and Latin, R. X. 1995. Disease-warning systems for processing tomatoes in Eastern North America: Are we there yet? Plant Dis. 79:113-121. 9. Hess, D. E., and Shaner, G. 1987. Effect of moisture on Septoria tritici blotch development on wheat in the field. Phytopathology 77:220-226. 10. Jeger, M. J. 1983. Analysing epidemics in time and space. Plant Pathol. 32:5-11. 11. Jones, J. B., Jones, J. P., Stall, R. E., and Zitter, T. A., eds. 1991. Compendium of Tomato Diseases. American Phytopathological Society, St. Paul, MN. 12. Madden, L. V. 1977. FAST, a forecaster of Alternaria solani on tomato. M. S. thesis. Pennsylvania State University, University Park, PA. 13. Minogue, K. P., and Fry, W. E. 1983. Models for the spread of disease: Model description. Phytopathology 73:1168-1173. 14. Minogue, K. P., and Fry, W. E. 1983. Models for the spread of plant disease: Some experimental results. Phytopathology 73:1173-1176. 15. Parker, S. K., Gleason, M. L., and Nutter, F. W., Jr. 1995. Influence of rain events on spatial distribution of Septoria leaf spot of tomato. Plant Dis. 79:148-152. 16. Pennypacker, S. P., Madden, L. V., and MacNab, A. A. 1983. Validation of an early blight forecasting system for tomatoes. Plant Dis. 67:287-289. 17. SAS Institute. 1988. SAS User’s Guide: Statistics. Release 6.03 ed. SAS Institute, Cary, NC. 18. Tyldesley, J. B., and Thompson, N. 1980. Forecasting Septoria nodorum on winter wheat in England and Wales. Plant Pathol. 29:9-20. 19. Vanderplank, J. E. 1963. Plant Diseases: Epidemics and Control. Academic Press, New York.