rithmic correction for n = 4 was predicted by a renormalization group analysis, see. e.g., [83]. Estimates for the ...... ACM Trans. Math. Software, 22:469â483, 1996 ...
Discrete Models of Biopolymers Peter Schuster
a
a,b,∗
and Peter F. Stadlera,b
Institut f¨ ur Theoretische Chemie und Molekulare Strukturbiologie, Universit¨ at Wien W¨ ahringerstraße 17, A-1090 Wien, Austria Phone: **43-1-4277-52743, -52737 Fax: **43-1-4277-52793 E-Mail: {pks,studla}@tbi.univie.ac.at ∗ Address for correspondence b
The Santa Fe Institute 1399 Hyde Park Road, Santa Fe, NM 87501, USA Phone: (505) 984 8800 Fax: (505) 982 0565 E-Mail: {pks,stadler}@santafe.edu
Abstract Discretized models of biopolymer structures can be used not only as approximations of the actual spatial structures but also as a computationally feasible approach to the generic features of the sequence-structure relationships. We review the combinatorics of nucleic acid secondary structures as well as lattice models of proteins, and show how properties such as the existence of extended neutral networks or shape space covering can be explained on this basis.
Keywords. Biopolymers, Combinatorial Enumeration, Genotype-Phenotype Map, Lattice Proteins, Neutral Networks, Random Graph Models, RNA Secondary Structures, Shape Space Covering.
1
Discrete Models of Biopolymers
2
1. Introduction Crystallography has revealed already a great number of biopolymer structures at full atomic resolution and the productivity of structural biologists is currently increasing at a breath-taking pace. The enormous amounts of data collected in structural data banks contain a true wealth of information. They are readily used in discussions of catalytic mechanisms of enzymes and ribozymes and provide the basis for models of molecular recognition. Many other applications of structural data in biochemistry and molecular biology, however, require fewer details and thus call for coarse grained notions of structure. Too many data obscure common structural features in related biopolymers and impede comparisons which are of fundamental importance, for example, in molecular evolution. Discretized structure models are particularly interesting because they do not only meet the need for straighforward recognition of basic features but by their nature they can be enumerated and accessed by combinatorial and other rigorous mathematical techniques. In this contribution we present models of discrete protein and RNA structures and review a few prominent results derived from them. In section 2 we introduce three classes of discretized structures: (i) lattice models which retain coarse-grained information of spatial structures, (ii) contact graphs which reduce spatial information to local nearest neighbor interactions, and (iii) hypergraph models being a multidimensional extension of (ii). Answers to counting problems can often be given by combinatorics. Examples are presented in section 3: RNA secondary structure graphs and self-avoiding walks as models for protein structures. Random graph theory is used in section 4 to model the mapping of sequences into structures. The random graph model is then applied to RNA secondary structures (section 5). The last section finally provides a brief conclusion and an outlook to further developments. 2. Discretized Structure Models The fine grained description of a molecular structure is simply the list of threedimensional coordinates of each individual atom. This level of detail, however, is not suitable for all purposes. Indeed, coarse grained representations such as ribbon diagrams are oftentimes used to interpret and compare protein folds. Ribbon diagrams are obtained by retaining only the coordinates of the backbone atoms, which are still represented by 3D vectors. In this section we shall be concerned with an alternative approach, namely discretized structure models. We may distinguish two major classes: (i) combinatorial models the encode only local geometric information, and (ii) models that explicitly retain information about the global three-dimensional embedding of the structure. Contact graphs and their hypergraph generalizations fall into the first class, while lattice models (mostly of proteins) belong to the second class. In this contribution we shall restrict ourselves to the simplest cases, in which each monomer is represented by a single point or letter. 2.1. Lattice Proteins. Lattice models [1–12] provide a coarse grained view on protein structure. The structure is represented by a self-avoiding walk (SAW), i.e., a path on a lattice that does not visit the same site more than once [13]. SAWs play a major role in polymer physics, where the main interest centers around equilibrium
Discrete Models of Biopolymers
3
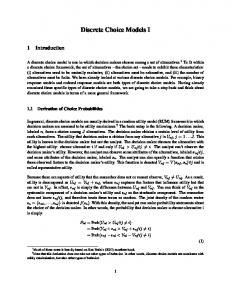
properties such as the number of configurations or the end-to-end distance of a polymer consisting of a fixed number of monomers n [14, 15]. 2.2. Contact Graphs. The three-dimensional structure of a linear biopolymer, such as RNA, DNA, or a protein can be approximated by their contact structure, i.e., by the list of all pairs of monomers that are spatial neighbors. Contact structures of polypeptides have been introduced by Ken Dill and co-workers in the context of lattice models of protein folding [16, 17]. The secondary structures of single stranded RNA and RNA form a special class of contact structures. We assume that the monomers, aminoacids and nucleotides alike, are numbered from 1 to n along the backbone. For simplicity we shall write [n] = {1, . . . , n}. The adjacency matrix of the backbone B has the entries Bi,i+1 = Bi+1,i = 1, i ∈ [n− 1]. In a more general context, polymers with cyclic or branched backbones can could be considered, see e.g. [12]. A contact structure is faithfully represented by the contact matrix C with the entries Cij = 1 if the monomers i and j are spatial neighbors without being adjacent along the backbone, and Cij = 0 otherwise. Hence Cij = 0 if |i − j| ≤ 1. Note that both B and C are symmetric matrices.We define the (contact) diagram ([n], Ω) to consists of n vertices labeled 1 to n and a set Ω of arcs that connect non-consecutive vertices. The diagram is simply a graphical representation of the contact matrix. As an example we show the conventional ribbon diagram of the protein ubiquitin together with its discretized structure represented by contact matrix and contact graph in Fig. fig:ubiquitin. A closely related class of diagrams which allow also arcs between consecutive vertices are the linked diagrams introduced by Touchard [18]. These are studied in some detail in Refs. [19–22]. The contact graph has the adjacency matrix A = B + C. The familiar drawing of RNA secondary structures are a much used example of biomolecular contact graphs. The classical definition of a secondary structure [23] requires that each base pairs with at most one other nucleotide. Thus nucleic acid secondary structures are special types of 1-diagrams. The second defining condition is that arcs do not cross. In terms of the contact matrix this means: If Cij = Ckl = 1 and i < k < j then i < l < j. Secondary structure (contact) graphs are outerplanar, i.e., they can be drawn in such a way that the backbone forms a circle and all base pairs are represented by chords that must not cross each other, see the example of phenylalanyl-tRNA in Fig. 2. An increasing number of experimental findings, as well as results from comparative sequence analysis, suggest that pseudo-knots are important structural elements in many RNA molecules [24]. Notably, functional RNAs such as RNAseP RNA [25] and ribosomal RNA [26] contain pseudo-knots. Almost all known pseudo-knotted structures, with the notable exception of the E. coli αmRNA [27], belong to the class of bi-secondary structures [28] that generalizes to notion of secondary structures to include pseudo-knots without allowing overly involved knotted structures or nested pseudo-knots. More precisely, a bi-secondary structures can be understood as superpositions of two disjoint secondary structures. Their contact graphs are still planar, but now the chords may be drawn on the inside and on the outside of the circle that represents the backbone. 2.3. Hypergraph Models. A hypergraph [29] consists of vertex set V and a set of subsets of V called hyperedges. A graph is a hence a uniform hypergraph in
4
MQ I F V K T L T G K T I T L E V E P S D T I E N V K A K I Q D K E G I P P D Q Q R L I F A G K Q L E D G R T L S D Y N I Q K E S T L H L V L R L R G G MQ I F V K T L T G K T I T L E V E P S D T I E N V K A K I Q D K E G I P P D Q Q R L I F A G K Q L E D G R T L S D Y N I Q K E S T L H L V L R L R G G
G G R L R L V L H L T S E K Q I N Y D S L T R G D E L Q K G A F I L R Q Q D P P I G E K D Q I K A K VN E I T D S P E V E L T I T K G T L T K V F I Q M
Discrete Models of Biopolymers
MQ I F V K T L T G K T I T L E V E P S D T I E N V K A K I Q D K E G I P P D Q Q R L I F A G K Q L E D G R T L S D Y N I Q K E S T L H L V L R L R G G
(a)
(b)
(c) Figure 1. The structure of the ubiquitin molecule, pdb entry 1ubq. (a) Conventional ribbon diagram, (b) contact matrix, (c) contact graph.
Discrete Models of Biopolymers
5
((((((•••((((••••••••))))•(((((•••••••)))))•••••(((((•••••••)))))•))))))••••
Figure 2. A few representations of RNA secondary structures. As example we show the structure of phenylalanyl-transfer RNA (tRNAphe ). The conventional graph representation (left upper part) is equivalent to the cyclic representation (right upper part), the mountain representation (middle part) and the parentheses representation (lower part). The contact matrix of tRNAphe is shown in Fig. 4. Each representation has a specific advantage: The conventional graph representation has been used successfully by biochemists in the interpretation of RNA reactivity, the cyclic representation allows to detect pseuknots as intersecting chords, the mountain representation is particularly useful for the detection of folding patterns in long RNA stretches, and a distance between structures can be easily defined in the parentheses representation as the the Hamming distance between the strings. We remark that graph and cyclic representation are twodimensional and thus allow to describe and detect pseudoknots, whereas mountain and parentheses representation are one-dimensional and become ambiguous in case of pseudoknots.
which all (hyper)edges have order 2. Allowing for larger sets of ‘mutually adjacent” monomers we obtain a hypergraph description of the molecular strcture. A particularly useful approach is based on Delaunay-tesselations [30].
Discrete Models of Biopolymers
6
The Delaunay tesselation is defined as the dual of the more familar Voroni cells: Given a finite set of points in A ⊆ Rn , the Voronoi cell of x ∈ A is � V(x) = y ∈ Rn |d(x, y) ≤ d(x′ , y) ∀x′ ∈ A \ {x} (1)
where d denotes the Euclidean distance in Rn . The nearest neighbor set N(x) of x ∈ A is the set of points x′ ∈ A \ {x} which are closest to x in Euclidean distance. For each point u ∈ Rn define nb(A, u) as the set of points x′ ∈ A \ {u}. A point v ∈ Rn is a Voronoi vertex (corner of the Voronoi cell) if |nb(A, v)| is maximal � over all nearest sets. The Delaunay-cell of v is the convex hull conv nb(S, v) . The complex (or triangulation) of A is therefore a partition of the convex hull conv(A) into the Delaunay cells of its Voronoi vertices. The Delaunay complex is dual to the Voronoi diagram 3.1 in the sense that there is a natural bijection between the two complexes which reverses the face inclusions. Efficient algorithms for computing Voronoi cells and Delaunay tessellations of point sets are publicly available; as a example we mention the qhull package [31]. Apart from degenerate cases, each Delaunay cell is a tetrahedron with for points of A at its corners. This procedure therefore defines 4-edges (sets of 4 “mutually adjacent” vertices) in a (protein) structures in a parameterfree way. The (2-)edges of a contact graph and 3-edges can of course be derived directly from the tesselation by considering subsets. Recently Delaunay tesselations of protein structures have been used as the basic building block for designing knowledge-based potentials for protein threading and inverse folding [30,32–34]. The secondary structure model of nucleic acids could be extended to hypergraphs in order to include e.g. base triplets, guanine quartetts or adenine platforms [35]. 3. Combinatorial Considerations 3.1. Secondary Structure Graphs. 3.1.1. Enumeration. A secondary structure on n + 1 digits may be obtained from a structure on n digits either by adding a free end at the right hand end or by inserting a base pair 1 ≡ (k + 2). In the second case the substructure enclosed by this pair is an arbitrary structure on k digits, and the remaining part of length n − k − 1 is also an arbitrary valid secondary structure. Therefore, we obtain the following recursion formula for the number Sn of secondary structures: Sn+1 = Sn +
n−1 X
Sk Sn−k−1 ,
k=m
n≥m+1
(2)
S0 = S1 = · · · = Sm+1 = 1 Equ.(2) has first been derived by Waterman [23]; m denotes the minimum number of unpaired digits in a hairpin loop. Note that our definition of Sn differs from Waterman’s for n < m; he used Sn = 0. The above recursion can be used to develop an algorithm for generating random secondary structures with a uniform distribution Prob{S} = 1/Sn
(3)
in the shape space of all secondary structures over a given chain length, see [36]. Related recursions can be obtained for restricted classes of structures, see Table 1 and [37].
Discrete Models of Biopolymers
7
Table 1. Recursions for restricted structures.
Jn+1 (b)
Hn+1 (b)
Nn+1 (b)
Zn (b) An+1 (b)
Structures with b components: Pn−1 = Jn (b) + k=m Sk Jn−k−1 (b − 1), b > 0, n ≥ m + 1 Jn (b) = 0, b > 0, n ≤ m + 1, Jn (0) = 1, n ≥ 0
Structures with b base pairs (bonds): Pn−1 Pb−1 = Hn (b) + k=m ℓ=0 Hk (ℓ)Hn−k−1 (b − ℓ − 1), b > 0, n ≥ m + 1 Hn (b) = 0, b > 0, n ≤ m + 1, Hn (0) = 1, n ≥ 0 Structures with b stacks: Pn−1 Pb = Nn (b) + k=m ℓ=0 Zk+2 (ℓ)Nn−k−1 (b − ℓ), b > 0, n ≥ m + 1 Nn (0) = 1, Nn (b) = 0, b > 0, n ≤ m + 1 where Zn (b), the number of structures with b stacks given that the 3′ and 5′ ends are paired, satisfies = Zn−2 (b) + Nn−2 (b − 1) − Zn−2 (b − 1), Z0 (b) = Z1 (b) = 0 Structures with exactly b hairpins: i Pn−1 hPb = An (b) + k=m A (ℓ)A (b − ℓ) + A (b − 1) n−k−1 n−k−1 ℓ=1 k n≥m+1 An (b) = δ0,b n≤m+1
The recursion for the number of structures with b base pairs, Hn (b), has also been considered in ref. [38]. More �recently,� Schmitt and Waterman [39] obtained the n−b−1 closed expression Hn (b) = 1b n−b for the special case m = 1. Recursions b+1 b−1 for some other types of structures, including the number Ψm,l n of structures in which all stacks have predefined minimum length l, can be found in [37]. Most of the published work on the asymptotic behavior of RNA-related counting series [23,39–44] makes use of a proposition by E.A. Bender [45, Thm 5.], which was later found to be true only under more restrictive conditions than the published ones. It follows from the counter-examples discussed in [46] and [47] that Bender’s result cannot be applied directly to the RNA problem. Starting from a simplified version of Darboux’ theorem [48], see also [49, p.205], a it is shown in [37] that the published expressions for the RNA counting series, e.g. [23], are nevertheless correct. The series Sn has been extensively studied in [23]. The asympotitics of the more is determined in [37, Thm.4.8]: general series Ψm,l n � �n −g(α) −3/2 1 m,l Ψn ∼ √ n (4) 2 π α where α is the smallest positive solution of � �2 p(x) = (1 − x)(1 − x2 + x2l ) + x2l tm (x) − 4x2l (1 − x2 + x2l ) = 0
(5)
that satisfies
−1 g(α) = 2l x
s
1 dp(x) − α dx α
6= 0.
(6)
Discrete Models of Biopolymers
8
With l = 1, the recursions tabulated in Tab. 1 give rise to the asymptotic expressions �b−1 � 1 − 2α α2 b Jn (b)/Sn ∼ (1 − α)3 1−α 1 Hn (b) ∼ n2b (b + 1)!b! (7) Cb 3b ·n Nn (b) ∼ b 2 (3b)! 4 An (b) ∼ (3+m)b n2(b−1) 2n 2 b!(b − 1)!
Here Ck denotes the Catalan numbers.
Table 2. Numerical values of 1/α. The values for the biophysically most relevant case, l = 2 and m = 3 are marked in bold.
m 1 2 3 5
Secondary l 1 2 3 2.618 1.986 1.716 2.414 1.899 1.680 2.289 1.849 1.652 2.147 1.783 1.612
Bisecondary l 1 2 3 4.42 2.49 2.00 4.03 2.43 1.94 3.81 2.35 1.89 3.44 2.22 1.74
Numerical values of 1/α, which determines the growth of Sn and Ψm,l with n sequence length n are tabulated in Tab. 2. For comparison, we also list numerical estimates for bi-secondary structures [28]. 3.1.2. Energy Functions. The standard energy model for RNA and DNA secondary structures relies on the decomposition of the structure into “loops” (see Figure 3). As shown in [50], these “loops” coincide with the unique minimal cycle basis. The most direct approach to the loop-decomposition of a secondary structure uses the following partial order on the set of bonds (base pairs): A base pair k, l is interior to the base pair i, j, if i < k < l < j. It is immediately interior if there is no base pair p, q such that i < p < k < l < q < j. For each base pair i, j the corresponding loop is defined as consisting of i, j itself, the base pairs immediately interior to i, j and all unpaired regions connecting these base pairs. The energy of an RNA secondary structure is assumed to be the sum of the energy contributions of all loops. The most recent compilation of RNA energy parameters is [51]. Current folding programs mostly rely on the parameter set discussed in [52], which extends earlier studies [53–55] by the systematic treatment of co-axial stacking. Parameters for DNA folding can be found in [56, 57]. 3.1.3. The RNA Folding Problem. The additive form of the energy model set the stage for an efficient solution of the minimum energy folding problem by means of a dynamic programming scheme similar to sequence alignment. This similarity was first realized and exploited by Waterman [23], see also [42], the first dynamic programming solution was proposed by [58], originally for the “maximum matching” problem of finding the structure with the maximum number of base pairs [59]. Zuker
Discrete Models of Biopolymers interior base pair
9
closing base pair A
G
5
U
G
5
C 3
C
A
3
C U
interior base pairs
closing base pair C
stacking pair
hairpin loop
5 3
interior base pair
closing base pair C
G 5
G
A
5
C
U
3
G
U
C A
closing base pair
G A
3
A
A
A
G
C
A
multi-loop
U
interior base pair
G
closing base pair
interior loop
bulge
Figure 3. RNA secondary structure elements. Any secondary structure can be uniquely decomposed into these types of loops.
and coworkers [60, 61] formulated the algorithm for the minimum energy problem using the now standard energy model. Since then several variations have been developed: Michael Zuker [62] devised a modified algorithm that generates a subset of suboptimal structures within a prescribed increment of the minimum energy, see also [63]. The algorithm will find any structure ψ that is optimal in the sense that there is no other structure ψ ′ with lower energy containing all base pairs that are present in ψ. John McCaskill [64] noted that the partition function over all secondary structures X Q= exp(−∆G(ψ)/kT ) (8) ψ
can be calculated by dynamic programming as well. In addition his algorithm can calculate the frequency with which each base pair occurs in the Boltzmann weighted ensemble of all possible structures, which can be conveniently represented in a “dotplot”, see Fig. 4. A related approach can be used to compute the complete density of states of an RNA sequence at predefined energy resolution [65, 66]. Another method for calculating the density of states, based on enumeration of structures, was proposed earlier [67]. However, this algorithm is restricted to subsets of structures containing no helices shorter than three and uses a simplified energy model. Most recently, a program has been designed by the Vienna group that can generate all secondary structures within some interval of the minimum energy based on dynamic programming and multiple backtracking [68, 69]. In practice, suboptimal folding can handle millions of structures, corresponding, e.g., to an energy range of, say, 12 kcal/mol at a chain length of 100 bases. Most of these algorithms are part of the Vienna RNA Package [70], which is freely available from http://www.tbi.univie.ac.at/. The assumptions that an RNA molecule folds into its thermodynamic ground state may well be wrong even for moderately long sequences [71]. Simulations of
Discrete Models of Biopolymers
10
GCGGAUUUAGCUCAGUUGGGAGAGCGCCAGACUGAAGAUCUGGAGGUCCUGUGUUCGAUCCACAGAAUUCGCACCA
ACCACGCUUAAGACACCUAGCUUGUGUCCUGGAGGUCUAGAAGUCAGACCGCGAGAGGGUUGACUCGAUUUAGGCG
GCGGAUUUAGCUCAGUUGGGAGAGCGCCAGACUGAAGAUCUGGAGGUCCUGUGUUCGAUCCACAGAAUUCGCACCA
GCGGAUUUAGCUCAGUUGGGAGAGCGCCAGACUGAAGAUCUGGAGGUCCUGUGUUCGAUCCACAGAAUUCGCACCA
Figure 4. Contact matrix and basepairing probabilities in the secondary structure of phenylalanyl-tRNA. All non-zero entries are indicated as black squares. In the lower (left) triangle we show the contact matrix. The matrix elements are 0 or 1 corresponding to empty or full squares, respectively. The upper (right) triangle contains the partition function. Here the size of the square is representative for the bas pairing probability.
the folding process itself can be used to avoid this problem. Consequently, several groups have designed kinetic folding algorithms for RNA secondary structures, mostly in an attempt to get more accurate predictions or in order to include pseudoknots, see e.g. [72–76]. Only a few papers have attempted to reconstruct folding pathways [77–79]. A more recent approach resolves the folding process to three elementary steps: base pair formation, base pair cleavage and base pair shift [80, 81]. RNA folding is simulated as a stochastic process starting from an initial state (commonly the open chain) to the minimum free energy conformation or a long-lived metastable state which is assumed to be an absorbing barrier. Sampling of sufficiently large numbers of folding trajectories yields probabilities of formation for different conformations.
Discrete Models of Biopolymers
11
In the case of functional RNAs, and provided a sufficient number of related sequences is available, the structure can be inferred from co-variations. This phylogenetic approach is beyond the scope of this review, but see e.g. [82]. 3.2. Self-Avoiding Walks. 3.2.1. Enumeration. Counting the number cN of distinct self-avoiding walks of given length N = n−1 on a prescibed lattice is a long-standing problem. At present a complete solution to this problem is unknown. It is easy to show, however, that for each lattice Λ there is a constant √ (9) µ = lim N cN < z − 1 . N →∞
where z is the connectivity of the lattice. The exact values of µ, however, are unknown even for the most simple lattices. Tight analytical bounds on µ have been obtained for a variety of lattices, see [13]. It is commonly believed that the asymptotic behavior of cN depends only on the spatial dimension d of the lattice: N for d = 2, 3 B N γ−1 √ µ N 4 log N for d = 4 cN ∼ Bµ (10) BµN for d ≥ 5
The exponent γ probably depends only on the dimension of the lattice. The logarithmic correction for n = 4 was predicted by a renormalization group analysis, see e.g., [83]. Estimates for the parameters µ, γ, and B are compiled in Table 3. Table 3. Combinatorial parameters of SAWs in 2D and 3D. Lattices in the plane: hexagonal (honey comb) HEX, square SQ, triangular TRI, and Knight’s move KM; Lattices in three dimensions: diamond (tetrahedral) TET, simple cubic SC, body centered cubic BCC, face centered cubic FCC, and a three-dimensional generalization of the Knight’s move lattice TDKM.
d 2 2 2 2 3 3 3 3 3
z 3 4 6 8 4 6 8 12 24
Lattice HEX SQ TRI KM TET SC BCC FCC TDKM
µ 1.8477 2.6382 4.1507 6.62 2.621 4.6839 6.5291 10.0364 22.66
γ B 0.345 1.28 0.34275 1.93 0.343 1.69 ∼ 0.15 ∼ 1.15 1.164 1.48 1.161 1.39 1.163 1.25 1.162 1.26 1.162 ∼ 1.14
References [84, 85] [84–88] [84–86, 89] [85, 88, 90] [85, 91–93] [83, 85, 92, 94] [85, 91] [95]
The effective number µ of conformational isomers per amino acid in a protein structure has been estimated by various authors. For instance [96] reports µ = 3.8, while µ ≈ 10 is obtained for the free chain in [97]. 3.2.2. Energy Functions. In contrast to the rather elaborate standard energy model for nucleic acids, most lattice protein models use simple contact potentials of the form X E(xi , xj )Cij (11) E(x) = i > > >
BB−0.074 > > > :�−0.054 0.123
−0.008 0.004 0.021 −0.074 −0.054 0.123 −0.317 −0.317 −0.263 0.156 −0.010
0.123 0.156 −0.010 −0.004
1 C C A
if if if
|i − j| = |i − j| = |i − j| =
3 4 5, 6, 7 (13)
if
|i − j| ≥
8
where the matrix entries correspond to the four amino acid classes 1 = {G, Y, H, S, R, N, E} 2 = {A, V}
3 = {L, I, C, M, F}
(14)
4 = {P, W, T, K, D, Q}
The parameters of such potential functions are extracted from databases of known protein structures as log-likelihood estimates or by means of the inverse Boltzmann law as described e.g. in [100–103]. 3.2.3. The Lattice Protein Folding Problem. The lattice folding problem consists of finding, for a prescribed amino acid sequence, a self-avoiding walk on a given lattice that minimizes energy. This combinatorial problem is NP hard [104–106] even for simple quadratic and cubic lattices and very simple energy functions, including the HP model. For short sequences and lattices with small effective connectivities µ all possible conformations can be evaluated. In the case of moderate sequences sometimes strongly constrained subsets of sequences, such as 27-mers that fill a 3 × 3 × 3 cube, are considered, see e.g., [107]. Heuristic algorithms such as CHCC [108] try to construct good approximations of the ground state using “compactness” as an additional critierion. Simple chain growth algorithm seem to yield fairly results on average. A series of fast algorithm with exact performance bounds have been devised by Sprin Istrail and coworkers [12, 109]. These produce solutions within a constant factor c < 1 of the maximal number of contacts.
Discrete Models of Biopolymers
13
4. Random Graph Models of Sequence-Structure Maps 4.1. The Random Graph Model. The numbers listed in Tables 2 and 3, together with the observation that the effective value of z for proteins appears to be somewhere in the range of z = 3 . . . 12, imply that sequence-structure maps are many-to-one, i.e. f −1 (s) is a large set at least for the more common structures. This observation poses the question how f −1 (s) is embedded in the space of biopolymer sequences, i.e., what can we say in general about the set of sequences folding into s. In the absence of further information, we assume that f −1 (s) is uniformly distributed in sequence space. In other words, we assume that the preimage of a structure s can be regarded as a suitable random subgraph Γ of the underlying sequence space. Here we restrict our attention to “host graphs” that are sequence spaces (Hamming graphs) Qna with a fixed alphabet of size a and fixed sequence length n. Typically, random graph models assume a fixed vertex set V into which edges are introduced [110]. The appropriate model for preimages in sequence-structure maps, however, are the subgraphs ΓX induced by randomly selected vertex sets X in the underlying sequence space [111, 112]: Definition 1. Let G(Qna ) be the set of all induced subgraphs of Qna and let 0 ≤ λ ≤ 1 be a constant. Then we set for Γ ∈ G(Qna ) n
n
µλ {Γ} = λa (1 − λ)a
−|Γ|
(15)
where |Γ| is the size, i.e., the number of vertices, of the subgraph Γ. The random � subgraph model is the probability space Ωn,λ = G(Qna ), µλ of subgraphs of Qna with the measure µλ . We shall write Γn for a random graphs drawn from Ωn,λ . The parameter λ can be interpreted as the fraction of neutral neighbors, i.e., (n − 1)aλ is the expected vertex degree of the random induced subgraph Γ. Let Q be a property of Γn . We say that Γ has property Q asymptotically almost surely (a.a.s.) if lim µ{Γn has property Q} = 1
n→∞
(16)
4.2. Predictions. A subgraph Γ′ is dense in Γ if each vertex of Γ is a vertex of Γ′ or if it has at least a an adjacent vertex in Γ′ . A (sub) graph Γ′ is connected if there is a path (of edges in Γ′ ) connecting any two vertices of Γ′ . The parameter r a−1 1 ∗ (17) λ =1− a plays a crucial role in the random subgraph model: Theorem 1. If λ > λ∗ then Γn is connected and dense in Qna a.a.s. If λ < λ∗ then Γn is neither connected nor dense in Qna a.a.s. Proof. The proof of this theorem is quite lengthy and technical [112]. Hence we only give a brief sketch here. In order to deal with denseness, one consideres the random variable Z(Γn ) counting the vertices of Qna that are neither in Γn nor have an adjacent vertex in Γn . Using the “sieve formula” [110, p.17] it is possible to derive the limit distribution of Z(Γn ) through its factorial moments. One then finds that limn→∞ E[Z(Γn )] is either 0 or ∞ depending on whether λ is larger or smaller than the threshold value λ∗ .
Discrete Models of Biopolymers
14
The proof of the connectedness part proceeds via an analysis of the sizes of the connected components. In the first step one shows that for λ > λ∗ there are a.a.s. no very small components, while below the threshold there are many of them. Furthermore, a.a.all vertices of Γn have large degrees above the threshold. The next step is to show that in this case a.a.all vertices of Qna have many adjacent vertices in Γn . Then one shows that a.a.s. every pair of vertices in Γn with a finite distance k in Qna is connected by a finite path in Γn . Finally, one shows that there are large enough subsets of vertices with mutually finite distances that can be connected by such paths. A related result in the special case of the Boolean hypercube with a different random graph model based on independently drawing edges instead of vertices with probability p can be found in [110]. A connected component Γ′ of graph Γ is a giant component if |Γ′ | > c|Γ| for some fixed constant c > 0. It is shown in [112] that Γn a.a.s. has a giant component for whenever λ > 0 is a constant. For Boolean hypercubes Ajtai et al. [113] proved in the edge-drawing model that there is a component with size g2n , g > 0, provided p = c/n and c > 1 . The component structure of Γn is discussed in some more detail in [111]: Theorem 2. There is a c > 0 such that, for λn = c ln(n)/n, the largest component X1 of Γn ⊂ Qna , for all ε > 0, satisfies a.a.s. |X1 | ≥ (1 − ε)|Γn | ,
(18)
The size of second largest component X2 is bounded by |X2 | ≤ Cn/ ln(n) where C > 0 is a constant depending only on a and c. Application of these ideas to biological speciation are discussed in [114, 115]. 4.3. Neutral Paths. Neutral walks were used to gain information about the structure of the (connected components of) neutral networks in a series of computer experiments on RNA folding landscapes [116–118]. In each step we attempt to find a neutral neighbor such that the distance from the starting point increases. Therefore neutral walks on Qna terminate at the latest after n steps. The probability a neutral walk with d steps cannot be elongated any further equals (1 − λ)α(d) where α(d) = (a − 1)(n − d) denotes the the number of “forward steps” increasing the distance to the starting point. The probability that a neutral walk of a Hamming graph terminates after exactly d steps is therefore [119]: Prob[L = d] = (1 − λ)α(d) ×
d h i Y ′ 1 − (1 − λ)α(d −1) .
(19)
d′ =1
From equ.(19) one can infer that there are long neutral paths with typical length n if λn/ ln n → ∞, while the walks are typically short (L/n → 0) for λ < ln n/n. In the intermediate regime, λ ∼ C ln n/n with C > 1, the typical neutral path length is proportional to n.
Discrete Models of Biopolymers
15
Table 4. Various strategies applied to study sequence-structure maps of RNA
Method Mathematical Random graph model theory
Advantage
Disadvantage
Analytical expressions
Limited validity of [112] model assumptions
Ref.
Exhaustive folding and enumeration
Folding algorithm Exact results Limited to short and handling of chains: large samples GC, ℓ ≤ 32 (> 109 objects) AUGC, ℓ ≤ 16
[117, 118]
Statistical evaluation
Inverse folding or Applicability Limited accuracy random walks in to longer due to statistics sequence space sequences
[116, 120]
Simulation of Chemical kinetics Evolutionary Restriction to evolutionary of replication relevance small parts of dynamics and mutation sequence space
[121–124]
5. RNA Secondary Structures and the Random Graph Model Mappings of RNA sequence space onto shape space, Qna → S n , were studied by the different approaches summarized in table 4. The random graph approach introduced in section 4.1 yields information on the generic properties of sequencestructure mappings. Here we are more concerned with the specific features of RNA mappings, in particular with the consequences of the base pairing logic. 5.1. The Product Space Model. As a consequence of the base pairing logic, not every sequence is compatible with every structure. While an arbitrary nucleotide may be located at each unpaired position of a structure φ, base pairing positions are constrained to AU, UA, GC, CG, GU, or UA. In the following we shall write C(φ) for the set of all sequences that are compatible with φ. Clearly, only sequence that are compatible with φ can actually fold into this structure, thus f −1 (φ) ⊆ C(φ). The distinction between paired and unpaired positions in a structure suggest a factorization of RNA sequence space into a space of unpaired bases and a space of n base pairs: Qnφ = Qnauu × Qanp with nu and np being the numbers of unpaired bases and base pairs, respectively, in the secondary structure φ; hence n = nu + 2np . For natural RNA molecules we have au = 4 and ap = 6 since six base pairs are allowed in stacks. The vertex set of Qnφ is C(φ). Two compatible sequence are neighbors of each other if they differ either by a point mutation in the unpaired part, or by the exchange of one type of possible base pair by another one. Note that two sequences can be neighbors in Qnφ while their Hamming distance in Qn4 is 2: assume for instance that a GC pairs is replaced by a UA pair. The random graph model described in section 4.1 can be customized to fit the n situation in RNA more closely by taking the factorization Qnφ = Qnauu × Qanp into account. Instead of a random subgraph of Qnα we model the neutral network f −1 (φ) by a random induced subgraph Γ[φ] ⊂ Qnφ . Two slightly different probability measures for Γ[φ] are considered in [112] with essentially the same qualitative results: One may conclude that if the restriction of the random graph Γ[φ] to both factors n Qnauu and Qanp is dense and connected, then Γ[φ] itself is dense and connected. Hence
Discrete Models of Biopolymers
16
the discussion in section 4.1 remains valid, one just has to take into account that we have different threshold values for the paired and unpaired factors, respectively. 5.2. Shape Space Covering. The random graph model can also be used to address the mutual location of the neutral networks of two different structures φ and ψ. The basic fact in this context is the so-called Intersection Theorem: Theorem 3. [112, Thm.5] Let φ and ψ be two secondary structures with the same length. Then C(φ) ∩ C(ψ) 6= ∅. The random graph approach then provides the following result: Theorem 4. [112, Thm.8] Let φ, ψ be two secondary structures with the same length and suppose the neutral networks Γ[φ] and Γ[ψ] are dense and connected almost surely. Then n (i) The minimum distance of Γ[φ] and Γ[ψ] in Qn4 u × Q6 p is a.a.s. at most 2. (ii) The expected Hamming distance from a randomly chosen sequence to the neutral network is a.a.s. at most E[r] < (1 − 6/16)np + o(1)
(20)
This predicts that the neutral networks of any two secondary structures come very close together at least somewhere in sequence space. As a consequence, any two common secondary structures should be accessible from each other. We shall return to this topic in section 5.3.5. Furthermore, equ.(20) predicts that we can find sequences that fold into almost all common secondary structures within a ball of radius E[r] centered at any given point in sequence space. This phenomenon has been termed shape space covering in [116]. This prediction has been confirmed in [118]. 5.3. Comparison of random graph models with data from RNA. 5.3.1. Exhaustive enumeration. One of the few examples that allow to test the prediction of random graph models directly is the mapping of RNA sequences into secondary structures. The most straightforward strategy is exhaustive folding of complete sequence spaces (Qna ) and enumeration of results (table 4). Because of the exponential increase in the number of sequences with chain length n and the limitation of efficient retrieval of data at sample sizes of a few 109 objects this strategy is limited to rather small molecules. This implies restriction to chain lengths n ≤ 16 for AUGC- and n ≤ 32 for AU- or GC-sequences. Table 5 contains a comparison of selected data on the numbers of minimum free energy RNA structures from exhaustive folding with the numbers Ψ3,2 n of all secondary structure graph with minimum stack length l = 2 and minimum length m = 3 of the unpaired stretch in a hairpin loop. These were chosen according to empirical experience: Very small hairpin loops, m < 3, and isolated base pairs, l = 1, are highly unstable and occur only in exceptional cases such as short sequences and sequences with an extremely biased base composition. The examples shown in table 5 contain only two minimum free energy structures with isolated base pairs formed by GC-sequences of chain length n = 12, nine structures for GC-sequences of chain length n = 16, and 51 structures for AUGC-sequences of chain length n = 16. Depending on the base pairing alphabet only a certain fraction of all structures will actually appear as most stable conformations. We see also that AUGC-sequences sustain substantially more minimum free energy structures than GC-sequences. The
Discrete Models of Biopolymers
17
Table 5. Comparison of exhaustively folded sequence spaces [117, 118, 125, 126]. The values given in parentheses are the counted numbers of actually occurring minimum free energy structures without isolated base pairs which are directly comparable to the numbers Ψ3,2 n .
Chain
Number of Sequences n
Number of Structures Ψ3,2 n
n
Length (n)
2
4
7
128
4.29 × 10⁹
2
2
1
10
1 024
1.05 × 10⁶
14
11
1
4 096
7
37
31 (29)
1
9
12
1.68 × 10 4
AUGC
15
3.28 × 10
1.07 × 10
174
16
6.55 × 10⁴
4.29 × 10⁹
304
17
1.31 × 10⁵
1.73 × 10¹⁰
20
6
12
1.05 × 10
7
1.10 × 10
GC
AU
116
2
195 (186)
4
530
340
8
2 741
1 601
35
274 (223)
15
44 695
18 590
164
760 983
218 820
1 064
25
3.36 × 10
1.13 × 10
30
1.07 × 10⁹
1.15 × 10¹⁸
number of structures formed by AU-sequences is rather small as a result of the relative weakness of AU base pairing and base pair stacking (in comparison to GC). In more detail we shall compare two cases with the prediction from random graph theory: (i) all sequences of chain length n = 16 and (ii) GC-sequences of chain length n = 30. For longer sequences we have to rely on statistical methods in order to obtain direct information. 5.3.2. Sequences of chain length n = 16. Structures, αk , in tables 6, 7 and 8 are ranked according to their probability of formation from random sequences. These probabilities are simply derived by dividing the size of the preimages in sequence space by the total number of sequences, p(αk ) = |f −1 (αk )|/an . Neutral networks in sequence space, corresponding to the structures αk , are characterized by their sequence of components which are listings of component sizes. What we expect to observe are either connected networks above the connectivity threshold or networks consisting of several components with one largest giant component. We have to recall, however, that the connectivity phenomenon discussed in section 4.1 is an asymptotic property and finite size effects may easily override it in case of short sequences. The most drastic example is the sequence space Q16 AU : 96.8% of the sequences don’t form a stable secondary structure at all. For GC-sequences the open chain amounts to 2.2% only and in Q16 AUGC we have 63.1% sequences with a non-trivial minimum free energy structure. The first eight most frequent shapes formed by sequences from Q16 GC have a single connected component. The neutral network of the open chain structure (rank 9), however, is partitioned into 13 components with a largest one containing 71.2% of the sequences. Unexpected partitions of neutral networks are found with the following two structures (ranks 10 and 11): They consist of two components of almost equal size. Further down in the probabilities of structures we observe many examples of this kind (ranks 14-20) and eventually structures appear whose netral
Discrete Models of Biopolymers
18
Table 6. Frequent shapes formed by GC-sequences of chain length n = 16 as minimal free energy structures.
GC-Alphabet Rank
Stucture
Number of
Number of
Sequence
Sequences
Components
of Components
1
((((•••))))•••••
2568
1
2568
2
•••••
((((•••))))
2541
1
2541
3
••••
((((••••))))
1895
1
1895
4
(((((•••)))))•••
1881
1
1881
5
•••
(((((•••)))))
1880
1
1880
6
((((••••))))••••
1803
1
1803
7
••
(((((••••)))))
1759
1
1759
8
(((((
1738
1
1738
1427
13
1016 358 16 11 10 43222111
((((•••))))•••
1316
2
695 621
((((•••))))••••
1316
2
732 582
9
••••
)))))
••
••••••••••••••••
10
••
11
•
12
•••••••
(((•••)))
1314
10
1292 5 4 3 3 22111
13
(((•••)))•••••••
1310
9
1293 4 4 2 2 2111
14
••••
((((•••))))•
15
•••
16
1293
2
691 602
••
1290
2
647 643
•••
((((•••••))))
1231
2
658 573
17
((((•••••))))•••
1205
2
664 541
18
••
((((••••••))))
1099
2
603 496
19
((((••••••))))••
1075
2
560 515
20 .. .
•
((((•••••••)))) .. .
1064 .. .
2 .. .
574 490 .. .
39
••
((((•••••))))•
659
4
181 171 157 150
40
•
((((•••••))))••
647
4
174 166 160 147
((((
))))
•••
networks are split even in four equal sized components (ranks 39 and 40). These clear deviations from the generic properties predicted by random graph theory found a straightforward biophysical explanation [118]. All structures containing a stack which cannot be elongated (class I in Fig.5) behave perfectly normal in the
Discrete Models of Biopolymers
19
Table 7. All shapes formed by AU-sequences of chain length n = 16 as minimal free energy structures.
AU-Alphabet Rank
1
Stucture
Number of
Number of
Sequences
Components
63 488
1
••••••••••••••••
2
•
((((((•••))))))
1020
1
3
((((((•••))))))•
1012
1
4
((((((••••))))))
16
1
Class I
Class II
Class III
Figure 5. Three classes of RNA stacks. Stacks are classified with respect to their compatibility with stack elongation on the two ends. Class I stacks cannot be elongated, class II stacks are compatible with elongation on one side whereas class III stacks can add base pairs on both side of the stacks.
sense that the form generic networks. The distribution of sequence belonging to such a network closely resembles the symmetric binomial distribution which is also the distribution of random sequences. Structures of class II, however, can form an additional base pair on one side of the stack and, in general, they will do so when compementary bases are in the opposing positions. This is most likely the case when the overall base composition is 50% G and 50% C and hence class II structures are less likely to be formed by sequences of equal percentage of G and C. The highest probability to form class II structures is thus expected to lie at a certain distance displaced from the middle of sequence space. Indeed, the two components of the class II structures have maxima of the distribution functions at excess G or excess C ([50 + δ]% G or [50 − δ]% G, respectively). The distribution of each component is close to binomial with equal offset from the center of sequence space (50% G/50% C). By the same token structuers of class III have two independent possibilities of stack elongation at both ends and thus the probability of their formation is largest if the sequences are displaced from the uniform distribution by δ and ε (for the left and for the right hand end), respectively. Without further information we assume δ = ε. Independent superposition yields then four components with maximal probability densities at the following G/C ratios: (50 + 2δ)/(50 − 2δ), 50/50, 50/50, and (50 − 2δ)/(50 + 2δ). These are precisely the positions of the peaks observed with four
Discrete Models of Biopolymers
20
Table 8. Frequent shapes formed by AUGC-sequences of chain length n = 16 as minimal free energy structures.
AUGC-Alphabet Rank
Stucture
Number of
Number and Sequence
Sequences
of Components
1
••••••••••••••••
2 709 560 048
1
2
(((•••)))•••••••
52 505 831
1
3
•••••••
(((•••)))
52 376 319
1
4
•••••
((((•••))))
44 544 114
1
5
((((•••))))•••••
44 273 764
1
6
••
(((•••)))•••••
33 131 192
1
7
•••••
(((•••)))••
8
•
9
••••••
32 883 686
1
••••••
32 878 614
1
•
)))
32 800 711
1
(((•••)))••••
31 738 681
1
(((•••)))•••
31 720 954
1
((((•••))))•••
27 886 795
1
((((•••))))••••
27 835 512
1
((((•••))))•
27 791 612
1
((((•••))))•• .. .
27 778 147 .. .
1 .. .
((••••))
2 329 003
2 (2 034 559+294 444) .. .
(((
•••
)))
(((
10
•••
11
••••
12
••
13
•
14
••••
15 .. .
•••
93
••••••••
•••
.. .
.. .
.. .
97
((••••))••••••••
2 254 841
.. .
.. .
.. .
(((•(••••)•)))•
87 295
174
•
2 (1 906 756+348 085) .. . 3 (76 755+10 222+318)
component networks. The structural details of neutral networks, we may conclude, are well described by the random graph model unless special structural features lead to systematic biasses which can be interpreted straightforwardly. Minimum free energy structures over the sequence space Q16 AU are little more than an exercise in finding the most stable hairpin loops with the largest possible number of base pairs. As said above the shape space is vastly dominated by the open chain which expresses the overwhelming influence of finite size. Stable structures are the
Discrete Models of Biopolymers
21
Table 9. Structures of GC-sequences of chain length n = 16 with two hairpins.
GC-Alphabet Rank
Stucture
Number of
Number of
Sequence
Sequences
Components
of Components
78
(((•••)))((•••))
135
4
132 1 1 1
80
((•••))(((•••)))
123
3
120 2 1
164
((•••))••((•••))
12
4
4332
178
••
((•••))((•••))
4
2
31
179
•
((•••))•((•••))
4
3
211
184
((•••))•((•••))•
3
2
21
195
((•••••))((•••))
2
1
2
three hairpin loops with six base pairs, the two triloops (ranks 2 and 3) and the tetraloop (rank 4). The other structures with less than six base pairs are apparently unstable. 16 16 The essential difference between Q16 GC or QAU and QAUGC lies in the cardinality, 9 65536 versus 4.29 × 10 sequences. This has to be compared with a rather small difference in structures, 195 versus 274, and leads to average numbers of 336 and 15.7 × 10⁶ sequences per structure, respectively. Distances in sequence space, how16 ever, are the same in Q16 GC and QAUGC and thus we suspect substantial differences in the sequence of components. Indeed most neutral networks in Q16 AUGC belonging to frequent structures are connected: The rank of the first network with two components is 93 and the two components have a ratio in size of about seven. Smaller networks have numbers of components up to five, but nowhere we found a situation of two or four equal sized components as in the Q16 GC case. A straightforward interpretation is based on the much higher cardinality of neutral networks in the AUGC case which leads to merging of components compared to networks in Q16 GC . In summary, the data collected for all AUGC-sequences of the small chain length of only n = 16 confirm the predictions of random graph theory rather well and certainly better than GC-sequences. Finally, we choose a special rare class of stuctures that can be easily counted and thus allows to compare directly all possible structures with the results derived from two-letter and four-letter sequences (Tables 10 and 9). These are the structures with two hairpins (. . . . .) which are hard to form at chain length n = 16. Two hairpins of minimal size, ((•••)), require 2 × 7 bases and thus only two more bases remain which could be either a base pair or two unpaired bases. The former case leads to two structures which are realized as the most common structures of 16 this class on both sequence spaces Q16 GC (ranks 78 and 80) and QAUGC (ranks 144 and 145). All other 15 two-hairpin structures are readily derived from the short-hand diagram by inserting the two unpaired bases at all possible positions. It is worth noticing that all of them are formed by the four-letter sequences whereas only five of them appear on Q16 GC . Interestingly, the stuctures formed by GC-sequences are in
Discrete Models of Biopolymers
22
Table 10. Structures of AUGC-sequences of chain length n = 16 with two hairpins. For structures which are formed also by GC-sequences the rank is given in parentheses.
AUGC-Alphabet Rank
Stucture
Number of
Number of
Sequence
Sequences
Components
of Components
144 (78)
(((•••)))((•••))
257 506
1
257 506
145 (80)
((•••))(((•••)))
254 456
1
254 456
188 (164)
((•••))••((•••))
57 398
1
57 398
196 (179)
•
((•••))•((•••))
32 528
1
32 528
197 (178)
••
((•••))((•••))
31 533
1
31 533
198 (184)
((•••))•((•••))•
31 429
1
31 429
199
((•••))((•••))••
30 367
1
30 367
223 (195)
((•••••))((•••))
15 048
1
15 048
224
((•••))((•••••))
14 625
2
13 968 657
225
•
((•••))((•••))•
14 497
1
14 497
229
((•••))•((••••))
11 518
2
10 226 1292
233
((••••))•((•••))
10 762
2
8880 1846
236
((•••))((••••))•
7318
2
6590 728
238
((••••))((•••))•
6855
2
5822 1063
239
•
((•••))((••••))
6739
4
6329 217 183 10
241
•
((••••))((•••))
6466
2
5423 1043
270
((••••))((••••))
1837
5
1344 245 204 41 3
the same sequeunce (with only one exception) also the most common structures of AUGC-sequences. 5.3.3. GC-Sequences of chain length n ≤ 30. Data derived from folding all GCsequences into secondary structures have been reported in detail [117,118]. We shall consider here mainly the chain length dependence of the most prominent features of sequence structue mappings in order to be able to predict the behavior in the limit of long chains and to elminate thereby the finite size effects. First the fraction of sequences forming no structure, i.e. the cardinality of the preimage of the open chain, decreases exponentially with increasing chain length n. It contains already less than 0.01% on Q16 GC . Second, careful inspection of the fraction of sequences forming common structures allows to extrapolate to long chains and leads to the following conjecture: In the limit of long chains almost all sequences fold into common stuctures which constitute only a minute fraction of all structures or, in
Discrete Models of Biopolymers
23
other words, the fraction of sequences folding into common structures approaches one in the lim n → ∞ whereas at the same time the fraction of structures fulfilling the condition of being common goes to zero. The results derived from exhaustive folding of binary sequences (GC and AU) with n ≤ 30 still show tremendous finite size effects but the general trends are already clear at the long chain ends of the diagrams in [117]. 5.3.4. Statistical evaluation of sequence spaces with chain lengths n > 30. Exhaustive techniques become infeasible when the total number of sequences exceeds ∼ 1010 , and one has to resort to sampling techniques [116]. Neutral paths, section 4.3, for instance can be used to detect neutral networks. The covering radius, section 5.2, can be estimated by measuring the minimum distance that is necessary to find a given structure from a chosen starting sequence, and averaging over the starting sequences and target structures weighted by their preimage sizes. This provides an upper bound for the mean covering radius. Extensive computer simulations reported in [70,116,120,127–129] provided strong evidence for the existence of sequence space percolating neutral networks and shape space covering. 5.3.5. Shape Space Topology. The topological (and possibly metric) properties of phenotype spaces are still largely uncharted territory. In fact, the description of the genotype-phenotype maps of RNA so far has made no reference to the structure of shape space itself beyond a definition of equality of structures. In order to understand the sequence of phenotypic changes along an evolutionary trajectory, however, it is necessary to know which phenotypes are accessible from which genotypes. Accessibility can then be used to define a relation of “nearness” among phenotypes, independently of their geometric, biophysical, or biological similarities [123, 124]. In the simplest case, we might say that ψ is accessible from φ, if it is possible to jump from f −1 (φ) to f −1 (ψ) by means of a point mutation. Shape space covering, section 5.2, suggests that each structure should be accessible from any other structure. However, sequence space is so large that not all possible sequences are ever realized in the course of simulation run (or during the history of evolution). Fontana & Schuster [124] argue that a more restrictive condition for accessibility is more suitable, for instance a minimum number of sequences in f −1 (ψ) that are neighbors of sequences folding into φ.
Shortening of stacks
Opening of constrained stacks
Elongation of stacks
Closing of constrained stacks
Figure 6. Structural changes corresponding to continuous evolutionary transitions. Shorting and elongation of stacks as well as opening of constrained stacks in general leads to easily accessible structures. Closing a constrained stack, on the other hand, leads to inaccessible structures and hence corresponds to discontinuous transitions.
Discrete Models of Biopolymers
24
The evolutionary trajectories observed in computer simulations can be regarded as a sequence (x0 , x1 , . . . ) of those phenotypes on whose neutral networks the population is concentrated during subsequent diffusion phases. The question hence becomes whether there is a meaningful way of distinguishing between continuous (smooth, expectable), and discontinuous (surprising) evolutionary transitions. From a more abstract point of view, continuity is a topological property of a map from one topological space into another one. Having defined the topology by specifying a suitable notion of accessibility, it becomes a matter of observation or computer simulation to find out whether “real” evolutionary trajectories are in fact continuous. We find that most evolutionary transitions are indeed continuous most of the time. Rare discontinuous transitions are often associated with major structural transitions [123, 124, 130]. We note, finally, that the topological notion of continuity might sometimes be too restrictive. Weaker mathematical structures, such as filter spaces or convergence spaces, as introduced for instance in [131–134], appear to be promising starting points for a generalization of this approach. 6. Conclusions and Outlook The lack of complementarity rules in discrete protein models makes the folding problem much harder than in RNA and less straightforwardly accessible to combinatorics. Some results, such as the relatively small extensions and the clustering of the neutral networks that has been observed in some lattice models [11], are not very well compatible with the simulations based on knowledge based potentials [135, 136] suggesting that proteins and RNA behave in essentially the same way. This discrepancy might be explained by the short chains n < 30 and the two-letter HP alphabet used in the lattice models. While native-like proteins can be designed from reduced alphabets, recent experiments [137] as well as computer simulations [135] suggest that two letters are not sufficient. The notion of neutral networks in RNA sequence space requires modification when suboptimal conformations or folding behavior of molecules is taken into account as an additional constraint. The degree of neutrality will certainly be smaller than in the case of the minimum free energy structures. Whether two folded RNA molecules are selectively neutral or not, after all, is not only a matter of sequencestructure mappings. The answer reflects selection constraints and thus requires detailed information on experimental conditions if one wants to deal with it in quantitative manner. Models of discretized RNA structures are inevitably based an the notion of secondary structure which restricts acceptable contacts by a base pairing rule. Although being a rather crude structural concept it has to highly relevant advantages [35]: (i) for most RNA molecules the secondary structure is a folding intermediate which is turned into the 3D by the formation of tertiary contacts, (ii) the majority of tertiary contacts can be classified by a few simple principles like pseudoknots, terminal (non-Watson-Crick) base pairs, base tripletts, base quartetts, and coaxial stacks. Making use of algorithms which are not restricted by the conventional sencondary structure concept like, for example, the kinetic folding algorithm [81], these tertiary interactions can incorporated into structures. Thereby one would still stay within the realm of discreteness and at the same time approach a more realistic concept of RNA structures.
Discrete Models of Biopolymers
25
References [1] K. F. Lau and K. A. Dill. Theory for protein mutability and biogenesis. Proc. Natl. Acad. Sci. USA, 87:638–642, 1990. [2] H. S. Chan and K. A. Dill. Origins of structure in globular proteins. Proc. Natl. Acad. Sci. USA, 87:6388–6392, 1990. [3] H. S. Chan and K. A. Dill. Sequence space soup. J. Chem. Phys., 95:3775–3787, 1991. [4] G. M. Crippen. Prediction of protein folding from amino acid sequences of discrete conformation spaces. Biochemistry, 30:4232–4237, 1991. [5] D. J. Lipman and W. J. Wilbur. Modelling neutral and selective evolution of protein folding. Proc. R. Soc. London B, 245:7–11, 1991. [6] C. J. Camacho and D. Thirumalai. Minimum energy compact structures of random sequences of heteropolymers. Phys. Lett., 71:2505–2508, 1993. ˇ [7] A. Sali, E. Shakhnovich, and M. Karplus. Kinetics of protein folding. A lattice model study on the requirements for folding of native states. J. Mol. Biol., 253:1614–1636, 1994. [8] K. A. Dill, S. Bromberg, K. Yue, K. M. Fiebig, D. P. Yeo, P. D. Thomas, and H. S. Chan. Principles of protein folding: a perspective from simple exact models. Prot. Sci., 4:561–602, 1995. [9] H. S. Chan and K. A. Dill. Comparing folding codes for proteins and polymers. Proteins, 24:335–344, 1996. [10] H. Li, R. Helling, C. Tang, and N. Wingreen. Emergence of preferred structures in a simple model of protein folding. Science, 273:666–669, 1996. [11] A. Renner and E. Bornberg-Bauer. Exploring the fitness landscapes of lattice proteins. Procceedings of Pacific Symposium on Biocomputing, 1997. submitted. [12] W. E. Hart and S. Istrail. Lattice and off-lattice side chain models of protein folding: linear time structure prediction better than 86% of optimal. J. Comput. Biol., 4:241–259, 1997. [13] N. Madras and G. Sokal. The Self-Avoiding Walk. Birkh¨ auser, Boston, Basel, Berlin, 1993. [14] P. J. Flory. Principles of Polymer Chemistry. Cornell Univ. Press, Ithaca, NY, 1971. [15] S. G. Whittington. Statistical mechanics of polymer solutions and polymer adsorption. Adv. Chem. Phys., 51:1–48, 1982. [16] H. S. Chan and K. A. Dill. Interchain loops in polymers: Effects of excluded volume. J. Chem. Phys., 90:492–508, 1988. [17] S.-J. Chen and K. A. Dill. Statistical thermodynamics of double-stranded polymer molecules. J. Chem. Phys., 103:5802–5808, 1995. [18] J. Touchard. Sur une probl` eme de configurations et sur les fractions continues. Canad. J. Math., 4:2–25, 1952. [19] W. N. Hsieh. Proportions of irreducible diagrams. Studies in Appl. Math., 52:277–283, 1973. [20] D. Kleitman. Proportions of irreducible diagrams. Studies in Appl. Math., 49:297–299, 1970. [21] P. R. Stein. On a class of linked diagrams, I. Enumeration. J. Comb. Theory A, 24:357–366, 1978. [22] P. R. Stein and C. J. Everett. On a class of linked diagrams. II. Asymptotics. Disc. Math., 22:309–318, 1978. [23] M. S. Waterman. Secondary structure of single-stranded nucleic acids. Adv. Math. Suppl. Studies, 1:167 – 212, 1978. [24] E. Westhof and L. Jaeger. RNA pseudoknots. Current Opinion Struct. Biol., 2:327–333, 1992. [25] A. Loria and T. Pan. Domain structure of the ribozyme from eubacterial ribonuclease P. RNA, 2:551–563, 1996. [26] D. A. M. Konings and R. R. Gutell. A comparison of thermodynamic foldings with comparatively derived structures of 16S and 16S-like rRNAs. RNA, 1:559–574, 1995. [27] C. K. Tang and D. E. Draper. Evidence for allosteric coupling between the ribosome and repressor binding sites of a translationally regulated mRNA. Biochemistry, 29:4434–4439, 1990. [28] P. F. Stadler and C. Haslinger. RNA structures with pseudo-knots: Graph-theoretical and combinatorial properties. Bull. Math. Biol., 61:437–467, 1999. [29] C. Berge. Hypergraphs. Elsevier, Amsterdam NL, 1989. [30] R. K. Singh, A. Tropsha, and I. I. Vaisman. Delaunay tessellation of proteins: Four body nearest neighbor propensities of amino acid residues. J. Comput. Biol., 3:213–221, 1996.
Discrete Models of Biopolymers
26
[31] C. B. Barber, D. P. Dobkin, and H. Huhdanpaa. The quickhull algorithm for convex hulls. ACM Trans. Math. Software, 22:469–483, 1996. [32] W. Zheng, S. J. Cho, I.I.Vaisman, and A. Tropsha. A new approach to protein fold recognition based on Delaunay tessellation of protein structure. In R. B. Altman and al., editors, Pacific Symposium on Biocomputing’97, pages 487–496, Singapore, 1997. World Scientific. [33] P. J. Munson and R. K. Singh. Statistical significance of hierarchical multi-body potentials based on Delaunay tessellation and their application in sequence-structure alignment. Protein Science, 6:1467–1481, 1997. [34] G. Weberndorfer, I. L. Hofacker, and P. F. Stadler. An efficient potential for protein sequence design. In Computer Science in Biology, pages 107–112, Bielefeld, D, 1999. Univ. Bielefeld. Proceedings of the GCB’99, Hannover, D. [35] R. T. Batey, R. P. Rambo, and J. A. Doudna. Tertiary motifs in structure and folding of RNA. Angew. Chem. Int. Ed., 38:2326–2343, 1999. [36] M. Tacker, P. F. Stadler, E. G. Bornberg-Bauer, I. L. Hofacker, and P. Schuster. Algorithm independent properties of RNA structure prediction. Eur. Biophy. J., 25:115–130, 1996. [37] I. L. Hofacker, P. Schuster, and P. F. Stadler. Combinatorics of RNA secondary structures. Discr. Appl. Math., 88:207–237, 1998. [38] J. A. Howell, T. F. Smith, and M. S. Waterman. Computation of generating functions for biological molecules. SIAM J. Appl. Math., 39:119–133, 1980. [39] W. R. Schmitt and M. S. Waterman. Linear trees and RNA secondary structure. Discr. Appl. Math., 12:412–427, 1994. [40] R. C. Penner and M. S. Waterman. Spaces of RNA secondary structures. Adv. Math., 101:31– 49, 1993. [41] P. R. Stein and M. S. Waterman. On some new sequences generalizing the Catalan and Motzkin numbers. Disc. Math., 26:261–272, 1978. [42] M. S. Waterman and T. F. Smith. Combinatorics of RNA hairpins and cloverleaves. Studies Appl. Math., 60:91–96, 1978. [43] M. S. Waterman and T. F. Smith. RNA secondary structure: A complete mathematical analysis. Math. Biosc., 42:257–266, 1978. [44] M. S. Waterman. Introduction to Computational Biology: Maps, Sequences, and Genomes. Chapman & Hall, London, 1995. [45] E. A. Bender. Asymptotic methods in enumeration. SIAM Review, 16:1974, 485-515. [46] E. R. Canfield. Remarks on an asymptotic method in combinatoric. J. Comb. Theory A, 37:348–352, 1984. [47] A. Meir and J. W. Moon. On an asymptotic method in enumeration. J. Comb. Theory A, 51:77–89, 1989. [48] G. Darboux. M´ emoir sur l’approximation des fonctions de tr` es grande nombres, et sur une classe ´ etendu de d´ eveloppements en s´ erie. J. Math. Pures Appl., 4:5–56, 1878. [49] G. Szeg¨ o. Orthogonal Polynomials, volume XXIII of Amer. Math. Soc. Coll. Publ. Amer. Math. Soc., New York, 1959. [50] J. Leydold and P. F. Stadler. Minimal cycle basis of outerplanar graphs. Elec. J. Comb., 5:R16, 1998. See http://www.combinatorics.org and Santa Fe Institute Preprint 98-01-011. [51] D. H. Mathews, J. Sabina, M. Zuker, and D. H. Turner. Expanded sequence dependence of thermodynamic parameters improves prediction of RNA secondary structure. J. Mol. Biol., 288:911–940, 1999. [52] A. E. Walter, D. H. Turner, J. Kim, M. H. Lyttle, P. M¨ uller, D. H. Mathews, and M. Zuker. Co-axial stacking of helixes enhances binding of oligoribonucleotides and improves predicions of RNA folding. Proc. Natl. Acad. Sci. USA, 91:9218–9222, 1994. [53] J. A. Jaeger, D. H. Turner, and M. Zuker. Improved predictions of secondary structures for RNA. Proc. Natl. Acad. Sci., USA, 86:7706–7710, 1989. [54] L. He, R. Kierzek, J. SantaLucia, A. E. Walter, and D. H. Turner. Nearest-neighbor parameters for GU mismatches. Biochemistry, 30, 1991. [55] A. E. Peritz, R. Kierzek, N. Sugimoto, and D. H. Turner. Thermodynamic study of internal loops in oligoribonucleotides: Symmetric loops are more stable than asymmetric loops. Biochemistry, 30:6428–6436, 1991 o+. [56] J. SantaLucia jr., H. T. Allawi, and P. A. Seneviratne. Improved nearest-neighbor parameters for predicting DNA duplex stability. Biochemistry, 35:3555–3562, 1996.
Discrete Models of Biopolymers
27
[57] J. SantaLucia jr. A unified view of polymer, dumbbell, and oligonucleotide DNA nearestneighbor thermodynamics. Proc. Natl. Acad. Sci. USA, 95:1460–1465, 1998. [58] R. Nussinov and A. B. Jacobson. Fast algorithm for predicting the secondary structure of single-stranded RNA. Proc. Natl. Acad. Sci. USA, 77(11):6309–6313, 1980. [59] R. Nussinov, G. Piecznik, J. R. Griggs, and D. J. Kleitman. Algorithms for loop matching. SIAM J. Appl. Math., 35:68–82, 1978. [60] M. Zuker and P. Stiegler. Optimal computer folding of larger RNA sequences using thermodynamics and auxiliary information. Nucleic Acids Research, 9:133–148, 1981. [61] M. Zuker and D. Sankoff. RNA secondary structures and their prediction. Bull. Math. Biol., 46(4):591–621, 1984. [62] M. Zuker. On finding all suboptimal foldings of an RNA molecule. Science, 244:48–52, 1989. [63] M. Schmitz and G. Steger. Base-pair probability profiles of RNA secondary structures. Comput. Appl. Biosci., 8:389–399, 1992. [64] J. S. McCaskill. The equilibrium partition function and base pair binding probabilities for RNA secondary structure. Biopolymers, 29:1105–1119, 1990. [65] J. Cupal, I. L. Hofacker, and P. F. Stadler. Dynamic programming algorithm for the density of states of RNA secondary structures. In R. Hofst¨ adt, T. Lengauer, M. L¨ offler, and D. Schomburg, editors, Computer Science and Biology 96 (Prooceedings of the German Conference on Bioinformatics), pages 184–186, Leipzig, Germany, 1996. Universit¨ at Leipzig. [66] J. Cupal. The density of states of RNA secondary structures. Master’s thesis, University of Vienna, 1997. [67] P. G. Higgs. RNA secondary structure: a comparison of real and random sequences. J.Phys.I (France), 3:43–59, 1995. [68] S. Wuchty, W. Fontana, I. L. Hofacker, and P. Schuster. Complete suboptimal folding of RNA and the stability of secondary structures. Biopolymers, 49:145–165, 1999. [69] S. Wuchty. Suboptimal secondary structures of RNA. Master’s thesis, Univiersity of Vienna, 1998. [70] I. L. Hofacker, W. Fontana, P. F. Stadler, S. Bonhoeffer, M. Tacker, and P. Schuster. Fast folding and comparison of RNA secondary structures. Monatsh. Chemie, 125:167–188, 1994. [71] S. R. Morgan and P. G. Higgs. Evidence for kinetic effects in the folding of large RNA molecules. J. Chem. Phys., 105:7152–7157, 1996. [72] H. M. Martinez. An RNA folding rule. Nucl.Acid.Res., 12:323–335, 1984. [73] A. A. Mironov, L. P. Dyakonova, and A. E. Kister. A kinetic approach to the prediction of RNA secondary structures. Journal of Biomolecular Structure and Dynamics, 2:953, 1985. [74] J. P. Abrahams, M. van den Berg, E. van Batenburg, and C. Pleij. Prediction of RNA secondary structure, including pseudoknotting, by computer simulation. Nucl. Acids Res., 18:3035–3044, 1990. [75] A. P. Gultyaev. The computer simulation of RNA folding involving pseudoknot formation. Nucl. Acids Res., 19:2489–2493, 1991. [76] M. Tacker, W. Fontana, P. F. Stadler, and P. Schuster. Statistics of RNA melting kinetics. Eur. Biophys. J., 23:29–38, 1994. [77] P. G. Higgs. Thermodynamic properties of transfer RNA: A computational study. J. Chem. Soc. Faraday Trans., 91:2531–2540, 1995. [78] A. P. Gultyaev, van Batenburg, and C. W. A. Pleij. The computer simulation of RNA folding pathways using an genetic algorithm. J. Mol. Biol., 250:37–51, 1995. [79] A. A. Suvernev and P. A. Frantsuzov. Statistical description of nucleic acid secondary structure folding. J. Biomolec. Struct. Dyn., 13:135–144, 1995. [80] C. Flamm. Kinetic Folding of RNA. PhD thesis, Universit¨ at Wien, 1998. [81] C. Flamm, W. Fontana, I. L. Hofacker, and P. Schuster. Elementary step dynamics of RNA folding. RNA, 1999. In press. [82] R. R. Gutell. Evolutionary characteristics of RNA: Inferring higher-order structure from patterns of sequence variation. Curr. Opin. Struct. Biol, 3:313–322, 1993. [83] C. Chaves and R. Riera. Correction to scaling for the self-avoiding walk in d=2: Result based on a cell renormalization group. Phys Rev B, 48:16084–16087, 1993. [84] A. Beretti and A. Sokal. New monte carlo method for the self-avoiding walk. J. of Stat. Phys., 40:483–531, 1985. [85] M. G. Watts. Application of the method of pade approximants to the excluded volume problem. J. Phys. A, 8:61–66, 1975.
Discrete Models of Biopolymers
28
[86] A. J. Guttmann. The high-temperature susceptibility end spin-spin correlation function of the three-dimensional ising model. J. Phys. A, 20:1855, 1987. [87] Enting and Guttmann. Self-avoiding polygons on the square, l and manhatten lattice. J. Phys. A., 18:1007, 1985. [88] T. Ishinabe and Y. Chikahisa. Exact enumerations of self-avoiding lattice walks with different nearest-neighbor contacts. J. Chem. Phys., 85(2):1009–1017, 1986. [89] A. J. G. et al. Connective constant of the self-avoiding walk on the triangular lattice. J. Phys. A, 19:2591, 1986. [90] K. Kremer, A. Baumg¨ artner, and K. Binder. Collapse transition and crossover scaling for self-avoiding walks on the diamond lattice. J. Phys A: Math. Gen., 15:2879–2897, 1981. [91] A. J. Guttmann. On the critical behaviour of self-avoiding walks. J. Phys. A, 20:1839 – 1854, Jul. 1986. [92] D. C. Rapaport. On three-dimensional self-avoiding walks. J. Phys. A, 18:113–126, 1985. [93] J. D. et al. Scaling exponents of the self-avoiding-walk problem in three dimensions. Phys Rev B, 49:3217–3225, 1993. [94] A. Guttmann, B. Ninham, and C. Thompson. Determination of critical behaviour in lattice statistics from series expansions. i. Phys. Rev., 172:554–558, 1968. [95] A. Kolinski, M. Milik, and J. Skolnick. Static and dynamic properties of a new lattice model of polypeptide chains. J. Chem. Phys., 94(5):3978–3985, 1991. [96] K. A. Dill. Theory for the folding and stability of globular proteins. Biochemistry, 24, 1985. [97] P. J. Flory. Statistical Mechanics of Chain Molecules. Wiley, New York, 1969. [98] S. Sun, R. Brem, H. S. Chan, and K. A. Dill. Designing amino-acid sequences to fold with good hydrophobic cores. Prot. Engeneer., 8:1205–1213, 1996. [99] N. E. G. Buchler and R. A. Goldstein. The effect of alphabet size and foldability requirements on protein structure designability. Proteins, ??:1–15, 1998. [100] S. Miyazawa and R. L. Jernigan. Estimation of effective interresidue contact energies from protein crystal structures: quasi-chemical approximation. Macromolecules, 18:534–552, 1985. [101] M. J. Sippl. Calculation of conformational ensembles from potentials of mean force — an approach to the knowledge-based prediction of local structures in globular proteins. J. Mol. Biol., 213:859–883, 1990. [102] G. Casari and M. J. Sippl. Structure-derived hydrophobic potentials — hydrophobic potentials derived from X-ray structures of globular proteins is able to identify native folds. J. Mol. Biol., 224:725–732, 1992. [103] M. J. Sippl. Recognition of errors in three-dimensional structures of proteins. Proteins, 17:355–362, 1993. [104] J. T. Ngo and J. Marks. Computational complexity of a problem in molecular structure prediction. Protein Engineering, 5:313–321, 1992. [105] R. Unger and J. Moult. Finding the lowest free energy conformation of a protein is an NP-hard problem: Proof and implications. Bull. Math. Biol., 55:1183 – 1198, 1993. [106] W. E. Hart and S. Istrail. Robust proofs of NP-hardness for protein folding: general lattices and energy potentials. J. Comput. Biol., 4:1–22, 1997. [107] H. Li, R. Helling, C. Tang, and N. Wingreen. Emergence of preferred structures in a simple model of protein folding. Science, 273:666–669, 1996. [108] K. Yue and K. A. Dill. Sequence structure relationships in proteins and copolymers. Phys.Rev. E, 48:2267–2278, 1993. [109] W. E. Hart and S. Istrail. Fast protein folding in the hydrophilic-hydrophobic model within three-eights optimal. Extended Abstract published in the Proceedings of the 27th Annual ACM Symposium on Theory of Computation, May 1995, 1994. [110] B. Bollob´ as. Random Graphs. Academic Press, London, 1985. [111] C. M. Reidys. Random induced subgraphs of generalized n-cubes. Adv. Appl. Math., 19:360– 377, 1997. [112] C. M. Reidys, P. F. Stadler, and P. Schuster. Generic properties of combinatory maps: Neural networks of RNA secondary structures. Bull. Math. Biol., 59:339–397, 1997. [113] M. Ajtai, J. Koml´ os, and E. Szemer´ edi. Largest random component of a k-cube. Combinatorica, 2:1–7, 1982. [114] S. Gavrilets and J. Gravner. Percolation on the fitness hypercube and the evolution of reproductive isolation. J. Theor. Biol., 184:51–64, 1997.
Discrete Models of Biopolymers
29
[115] S. Gavrilets, H. Li, and M. D. Vose. Rapid parapatric speciation on holey adaptive landscapes. Proc. Roy. Soc. London B, 265:1483–1489, 1998. [116] P. Schuster, W. Fontana, P. F. Stadler, and I. L. Hofacker. From sequences to shapes and ˙ back: A case study in RNA secondary structures. Proc. Roy.Soc. Lond. B, 255:279–284, 1994. [117] W. Gr¨ uner, R. Giegerich, D. Strothmann, C. Reidys, J. Weber, I. L. Hofacker, P. F. Stadler, and P. Schuster. Analysis of RNA sequence structure maps by exhaustive enumeration. I. Neutral networks. Monath. Chem., 127:355–374, 1996. [118] W. Gr¨ uner, R. Giegerich, D. Strothmann, C. Reidys, J. Weber, I. L. Hofacker, P. F. Stadler, and P. Schuster. Analysis of RNA sequence structure maps by exhaustive enumeration. II. Structures of neutral networks and shape space covering. Monath. Chem., 127:375–389, 1996. [119] C. M. Reidys and P. F. Stadler. Neutrality in fitness landscapes. Appl. Math. & Comput., 1999. in press, Santa Fe Institute preprint 98-10-089. [120] W. Fontana, P. F. Stadler, E. G. Bornberg-Bauer, T. Griesmacher, I. L. Hofacker, M. Tacker, P. Tarazona, E. D. Weinberger, and P. Schuster. RNA folding and combinatory landscapes. Phys. Rev. E, 47:2083–2099, 1993. [121] M. A. Huynen, P. F. Stadler, and W. Fontana. Smoothness within ruggedness: The role of neutrality in adaptation. Proc. Natl. Acad. Sci. USA, 93:397–401, 1996. [122] E. van Nimwegen, J. P. Crutchfield, and M. Mitchell. Finite populations induce metastability in evolutionary search. Phys. Lett. A, 229:144–150, 1997. [123] W. Fontana and P. Schuster. Shaping space. The possible and the attainable in RNA genotype-phenotype mapping. J. Theor. Biol., 194:491–515, 1998. [124] W. Fontana and P. Schuster. Continuity in evolution. On the nature of transitions. Science, 280:1451–1455, 1998. [125] P. Schuster. How to search for RNA secondary structures. Theoretical concepts in evolutionary biotechnology. J. Biotechn., 41:239–257, 1995. [126] U. G¨ obel, S. Kopp, and P. Schuster. Complete sequence-secondary structure mapping of oligo-ribonucleotides of chain length n = 16, 1999. Preprint. [127] W. Fontana, T. Griesmacher, W. Schnabl, P. F. Stadler, and P. Schuster. Statistics of landscapes based on free energies, replication and degredation rate constants of RNA secondary structures. Monatsh. Chem., 122:795–819, 1991. [128] W. Fontana, D. A. Konings, P. F. Stadler, and P. Schuster. Statistics of RNA secondary structures. Biopolymers, 33:1389–1404, 1993. [129] U. G¨ obel, C. V. Forst, and P. Schuster. Structural constraints and neutrality in RNA. In R. Hofest¨ adt, T. Lengauer, M. L¨ offler, and D. Schomburg, editors, Bioinformatics. German Conference on Bioinformatics, GCB’96, volume 1278 of Lecture Notes in Computer Science, pages 156–165. Springer-Verlag, Berlin, 1997. [130] J. Cupal, S. Kopp, and P. F. Stadler. RNA shape space topology. Alife, 1999. In press, SFI Preprint 99-03-022. [131] F. Hausdorff. Gestufte R¨ aume. Fund. Math., 25:486–502, 1935. [132] G. Choquet. Convergences. Ann. Univ. Grenoble, 23:55–112, 1947. [133] D. C. Kent. Convergence functions and their related topologies. Fund. Math., 54:125–133, 1964. [134] M. Katˇ etov. On continuity structures and spaces of mappings. Comm. Math. Univ. Carolinae, 6:257–278, 1965. [135] A. Babajide, I. L. Hofacker, M. J. Sippl, and P. F. Stadler. Neutral networks in protein space: A computational study based on knowledge-based potentials of mean force. Folding & Design, 2:261–269, 1997. [136] A. Babajide, R. Farber, I. L. Hofacker, J. Inman, A. S. Lapedes, , and P. F. Stadler. Exploring protein sequence space using knowledge based potentials. J. Comp. Biol., 1999. Submitted, Santa Fe Preprint 98-11-103. [137] K. Plaxco, D. Riddle, V. Grantcharova, and D. Baker. Simplified proteins: minimalist solutions to the “protein folding problem”. Curr. Opin. Struct. Biol., 8:80–85, 1998.