underlying processes occurring during a decision-making task in an everyday context. ... the different cognitive processes involved in distinct. 1 ..... with a tracking range of 80 .... each section, Before and After, two one-factor analyses.
Journal of Eye Movement Research 7(4):3, 1-14
Discriminating cognitive processes with eye movements in a decision-making driving task. Sophie Lemonnier Laboratory for road Operations, Perception, Simulators and Simulations, IFSTTAR, France Laboratory of Human and Artificial Cognition, LUTIN, University of Paris VIII, France
Roland Br´emond
Thierry Baccino
Laboratory for road Operations, Perception, Simulators and Simulations, IFSTTAR, France
Laboratory of Human and Artificial Cognition, LUTIN, University of Paris VIII, France
An experiment was conducted in a driving simulator to test how eye-movement patterns evolve over time according to the decision-making processes involved in a driving task. Participants had to drive up to a crossroads and decide to stop or not. The decision-making task was considered as the succession of two phases associated with cognitive processes: Differentiation (leading to a prior decision) and Consolidation (leading to a final decision). Road signs (Stop, Priority and GiveWay) varied across situations, and the stopping behavior (Go and NoGo) was recorded. Saccade amplitudes and fixation durations were analyzed. Specific patterns were found for each condition in accordance with the associated processes: high visual exploration (larger saccade amplitudes and shorter fixation durations) for the Differentiation phase, and lower visual exploration (smaller saccades and longer fixations) for the Consolidation phase. These results support that eye-movements can provide good indices of underlying processes occurring during a decision-making task in an everyday context. Keywords: visual attention, decision making, saccade amplitude, fixation duration, driving
Introduction
ing execution. Consequently, such studies do not reveal possible qualitative changes in gaze patterns over task phases (however, see Ballard et al. (1992, 1995); Mennie et al. (2007), who studied dynamic tasks). It is interesting to test whether it is possible to discriminate different task phases during the course of the task. In addition, in most studies, the decision-making tasks performed by the participants were manipulated by explicit instructions (e.g. lane changing, gap judgment in driving); and these tasks were clearly distinct from one another (e.g. Yarbus’ experiment: give the age, remember the clothes or the position of people, estimate material circumstances, etc.). This raises the question whether it is possible to discriminate between the mental states underlying an ongoing task, without changing the stimulus or instruction. Indeed, it would be valuable for everyday eye movement studies.
Visual attention is characterized by two types of processing: bottom-up processing is related to the visual characteristics of the scene, and may be modeled by saliency maps (Itti & Koch, 2001; Koch & Ullman, 1985; Follet et al., 2010; Bruce & Tsotsos, 2009); top-down processing depends on prior knowledge, goals and expectancies (Sprague & Ballard, 2003; Summerfield & Egner, 2009). Top-down processing is known to have a strong influence on eye movement (Howard et al., 2011; Hayhoe & Ballard, 2005; Land, 2004; Hayhoe et al., 2003; Henderson & Hollingworth, 1999; Land et al., 1999; Ballard et al., 1995; Land & Lee, 1994), which is supported by research on neural mechanisms (Li et al., 2004), while bottom-up processing poorly predicts eye movements in everyday tasks (Rothkopf et al., 2007). Since Yarbus (1967), a number of authors have demonstrated that oculomotor patterns depend on the task (Lipps & Pelz, 2004; Tatler et al., 2011). Most of these studies have collected eye movements in laboratory conditions, which restrict the generalization of these observations to ecological and complex situations (e.g. driving, playing sports, shopping, serving tea). Previous studies have considered static tasks, in the sense that task requirement itself does not change dur-
For these reasons, this paper is focused on the cognitive processes which contribute to the task, and their relationship with eye movements. We have chosen a decision-making task, which consists of two consecutive processes, in a sequential temporal structure. The experimental situation was a crossroads approach in a driving simulator, the decision was to stop or not. Is it possible to discriminate, using oculomotor patterns, the different cognitive processes involved in distinct 1
Lemonnier, S., Br´emond, R. & Baccino, T. (2014) Eye movements in a decision-making driving task
Journal of Eye Movement Research 7(4):3, 1-14
decision-making task (and thus, no D or C process) is present any more. In the following, when no decision is required any more, the current activity is described as Baseline (B), in contrast to D and C. D and C have cognitive costs associated with the decision-making task that are added to this baseline, which includes all other processes potentially at work. In this study, we will specify the D and C processes in a specific decision-making task, define their characteristics and those of the associated phases. The challenging issue will then be to discriminate these decision-making processes on the basis of specific eye movement patterns.
task phases, and to investigate whether these patterns change over time?
Decision making and temporal evolution In everyday situations, decisions are not always optimal under time pressure. Even if a first decision is made, allowing the appropriate action to start, visual control may be needed in order to check the decision’s validity until the action is finished. Experimental evidence of visual control in the course of action has shown for arm and hand movements (e.g. grasping a static target (Goodale, 2011); intercepting a moving target (Brenner & Smeets, 2011)), as well as driving (Wallis et al., 2007). In the following, we will consider a decision-making task in a situation with a time course: the decision may occur before action, so that the first decision may be reconsidered until the final decision. This latency introduces a time course of decision-making with two consecutive phases. This type of situation appears in many real-life situations, but is not considered in most decision-making models (general: Kahneman (2002); Eccles & Wigfield (2002); Gigerenzer & Gaissmaier (2011); perceptual decision: Geisler (2011); Summerfield et al. (2012); natural tasks: Sprague & Ballard (2003); under time pressure: Maule et al. (2000); theory of action: Nenkov & Gollwitzer (2012)). The first decision is labeled “prior decision”. The phase before this prior decision correspond to a “Differentiation” process (D). During D, the available information is evaluated and a prior decision is produced as output. The phase after this prior decision correspond to a “Consolidation” process (C). During C, the prior decision is checked, decreasing the uncertainty, and leads to a final decision. This time course follows the Differentiation and Consolidation (Diff / Con) theory of decision making (Svenson, 1992). The decision-making task is described within this framework as a Differentiation process followed by a Consolidation process; the latter strengthens the prior decision with congruent information (Svenson et al., 2009). This model mainly focuses on social psychology aspects of decision making, and addresses the impact of emotion, stress and attractiveness. Despite difference between the original model of Svenson and its use in a driving context, the vocabulary (D and C) has been preserved. In the time course of a decision task, the D process leads to a prior decision. Its aim is to make the best possible decisional choice, considering the current situation. Then, the C process triggers action and validates (or not) this prior decision. Its aim is to check whether the current information is consistent, gradually increasing confidence in the prior decision, until the realization of the action or until confidence level is considered sufficient. In the latter case, if a next decision is needed, a new D process may start (anticipation); otherwise, no
The experimental situation: a driver approaching a crossroads A number of elements influenced the choice of the experimental situation. Firstly, this study required a delay between prior decision and action (in order to observe C). Moreover, it needed an ecological and complex situation, a central role of perception, a time course, and minimal instructions, the same in all conditions. Indeed, the more complex the situation, the less the gaze is driven by the properties of the visual scene, via bottom-up processing (Foulsham et al., 2011; Land & Tatler, 2009). For all these reasons, we have chosen a driving situation. The experimental situation needed also to vary the result of the decision and the time course of the phases (before and after the prior decision). A behavioral observation was also needed in order to record the prior and final decision. The crossroads approach was selected. An important decision has to be made: to stop or not (NoGo vs. Go). If the final decision is to stop, a new decision has to be made: when to restart. The probability of the decision (Go / NoGo) was modulated with the road sign: Stop, Priority and Give Way (see Fig. 1 for an illustration of the sequential temporal structure). In the Stop sign condition, the prior decision NoGo was imposed by a road sign1 . The action does not depend on interaction with others vehicles. The probability to have a collision and to change the prior decision is very low. Therefore, confidence in the prior decision is high, and the C process is almost not needed. In this case, the process associated with the decision-making task is expected to be first B, then D in order to anticipate the next decision (when to restart). In the Priority sign condition, the prior decision Go was also suggested by the road sign. The action implies 1
In the data analysis, we have considered the last 150 m of the crossroads approach: the road signs were located at this distance, which is consistent with the French regulation. At this point, 150 m before the crossroads, the prior decision has already been made in the Stop road-sign condition (NoGo) and in the Priority sign condition (Go), but not in the Give Way condition (see Fig. 1).
2
Lemonnier, S., Br´emond, R. & Baccino, T. (2014) Eye movements in a decision-making driving task
Journal of Eye Movement Research 7(4):3, 1-14
tainty about environmental variables that are relevant to behavior” (cited from Sprague & Ballard (2003), p. 2). Accordingly, the possibility of decreasing the uncertainty is higher during a D process than during a C process, thus visual exploration should be higher during a D process (i.e. larger saccade amplitudes and shorter fixation durations). This is consistent with the driver behavior theory of N¨aa¨ t¨anen & Summala (1974): the information obtained during the D process modifies the expectancy, which will be more specific after the prior decision, during the C process. This supports a decrease of visual exploration during the C process. We therefore hypothesized that D, C and B would result in a hierarchy of visual exploration, ranging from more active in D than in C, and in C than in B. According to this hierarchy, the following predictions may be expected: fixation durations should be shorter during D compared to C process, and during C compared to B; and saccade amplitudes should be higher in a D process than in a C process, and in a C process than in a B.
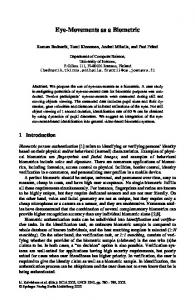
Figure 1. An approach of a crossroads and the prediction of cognitive processes. Top: bird’s view of the 150m before the crossroads; the participant’s car is in red, the traffic cars in black, and control cars in white (to increase immersion feeling). Bottom: predictions about the prior and final decisions, and the associated processes fore the three road sign conditions.
some level of collision risk (if other drivers do not respect the priority). When approaching the crossroads, information about the other driver’s behavior increases the level of confidence and consolidates the prior decision. Therefore, the C process is expected. In the Give Way sign condition, the prior decision is not obvious, so that the first process is D. Then, if the prior decision is NoGo, the D process can be replaced by a new D (anticipation) as in the Stop condition. If the prior decision is Go, the next process is C as in the Priority condition.
Cognitive processes and eye movements Visual search is characterized by scanpaths, resulting in sequences of fixations and saccades (Goldberg & Kotval, 1999). Chapman & Underwood (1998) showed that fixation durations decrease and saccade amplitudes increase when visual search increases (see also Rayner (1998); Crundall & Underwood (2011)). To decide whether to stop or not, saccade amplitudes and fixation durations (visual exploration2 ) are related to estimates of speed, distance and gap size of the oncoming vehicles, based on the information of color, shape, texture and rate of frontal surface expansion (Hancock et al., 1991). This information is supposed to be shared by both the D and C processes, the difference between them being the amount of visual exploration. To use the vocabulary of Sprague & Ballard (2003), this information is relevant for the decision making task, by reducing uncertainty (e.g. depending on the road sign): “eye movements serve to reduce uncer-
Figure 2. Prediction of oculomotor pattern during the approach of the crossroads, starting at 150 m. Top: Relative predicted value of the saccade amplitudes. Bottom: Relative predicted value of the fixation durations.
To summarize, we link the level of visual exploration with the cognitive processes (see Fig. 2 for an illustration of our oculomotor behavior predictions). The visual exploration is expected to be low in the beginning of the Stop condition (B), and then to increase (D pro2
“Visual search” is associated in the vision science literature to a detection task. In order to avoid any confusion with the visual search involved in the driving task, which is considered in this study, we use “visual exploration” instead, to denote the combination of fixation durations and saccade amplitudes. Thus, a decrease of fixation durations and an increase of saccade amplitudes will be referred to as an increase of visual exploration. 3
Lemonnier, S., Br´emond, R. & Baccino, T. (2014) Eye movements in a decision-making driving task
Journal of Eye Movement Research 7(4):3, 1-14
implemented: no vehicle, few vehicles (on average spaced 45 m from each other), or many vehicles (on average spaced 22.5 m from each other). The three levels of traffic density were also present in the Stop and Priority conditions, to have equivalent visual environments. In case of collision with other vehicles, the participant’s car could go through.
cess). Moderate visual exploration is expected in the beginning of the Priority condition (C process), lowering to a baseline level while evidence is accumulated for the final decision. In the Give Way condition, a high visual exploration is expected (D process) until the prior decision. In the Give Way NoGo condition, this first phase is followed by a new sequence of high visual exploration (D process). In the Give Way Go condition, a moderate visual exploration (C process) is expected following the prior decision.
Apparatus. The driving simulation experiment (see Fig. 4) was displayed via two computers and five video-projectors, on five screens of 1.85 m wide and 2.55 m high (resolution: 1024×1280 pixels for each video-projector; response time: 60Hz, consistent with the 60Hz simulation update rate). The distance between the participants’ heads and the screens (at 90◦ ) was 1.70 m. All five screens formed together an angle of 275◦ (see Fig. 4, right). The simulator included a gearbox, a wheel with force feedback, three pedals, a dashboard with speed and engine speed, and a model of a combustion engine.
Method Participants Thirty-four participants (29 men and 5 women) with normal or corrected-to-normal vision, took part in the experiment. They all had at least three years of driving experience (M = 15, SD = 12), and their average age was 34 years (SD = 12).
Material Virtual environment and scenario. The virtual environment was created with the Realax software. It was displayed at scale 1:1, and computed for the viewpoint of the participant (1.15 m above the simulated ground). It represented a two-lane highway in a rural environment, with a simplified landscape which helped to reduce bottom-up attention. The road was straight and crossed a new road at right angle every kilometer. The crossroads were announced 150 m beforehand with a road sign (see Fig. 3). The road markings at the crossroads were consistent with the road signs.
Figure 4. The fixed-based driving simulator. Left: lateral view of the driver equipped with SMI Eye Tracking Glasses; Middle: view from behind; Right: design of the five screens around the driver.
The eye tracking system was SMI (SensoMotoric Instruments) Eye Tracking Glasses (weight: 75 g). It included a scene camera (resolution: 1280×960 pixels, 24 fps) and two cameras capturing the driver’s gaze with a tracking range of 80◦ horizontal and 60◦ vertical. This system had a gaze position accuracy of 0.5◦ (according to the manufacturer), and a sampling rate of 30 Hz. The data was processed using BeGaze (SMI software, version 3.1.77). The fixations were calculated with a dispersion based algorithm, whose parameters were: 80 ms for minimum fixation duration and 100 pixels (4.69◦ ) for the maximum dispersion. The saccades were then derived from these fixations. This concerns eye movements relative to the head. Head movements were not recorded, which means that gaze shifts relative to the scene may have been much larger in amplitude. All computers were synchronized with the Absolute Time Server software (two for the environment, two for the simulation and one for the eye tracker).
Figure 3. Road signs used in the experiment, with their visual representation and meaning, according to French law.
A driving simulator software architecture (ARCHISIM) was used to introduce traffic in this virtual environment via two computers. In order to improve the sense of immersion, some vehicles were simulated coming along the highway in the opposite direction. At the crossroads, some vehicles were simulated on both ways crossed by the driver (see Fig. 1, Top). These vehicles followed the priority rules. In order to modulate the stopping decision in the Give Way conditions, three levels of traffic density were
Procedure Once the eye tracker was calibrated (with three points of calibration on anchor locations displayed on the central screen), the participants ran a learning 4
Lemonnier, S., Br´emond, R. & Baccino, T. (2014) Eye movements in a decision-making driving task
Journal of Eye Movement Research 7(4):3, 1-14
where the data should be split into two road sections, Before and After this prior decision. Newman-Keuls tests were used to determine significant changes in the gas pedal data comparing the 10 road segments with each other. Then, the same split was applied to the other conditions, to obtain two data subsets, Before the prior decision with three modalities of the Driving Situation (Give Way, Stop and Priority) and After with four modalities (GW-Go, GW-NoGo, Stop and Priority). For each section, Before and After, two one-factor analyses of variance (ANOVA) were computed on mean values, two more on slopes. All fixation durations and saccade amplitudes greater than the mean value plus 2SD were filtered out (respectively above 0.8s and above 52.28◦ ), which removed 4.07% of fixation data and 5.26% of saccade data. The saccade amplitudes were not normally distributed. A logarithmic transform was applied before statistical analysis, leading to a normal distribution. The significance level was set to .05, but, in order to be consistent with Johnson (2013), p-values are given when p>.001.
phase to get accustomed to the driving simulator and to the eye tracking glasses. Then, the main part of the experiment began. Calibration was checked throughout the experiment, and corrected when needed. The participants’ task was to drive straight and to cross the crossroads, while taking the road signs into account and avoiding accidents. The instruction was to drive as they would on the same road in reality. The experiment consisted of 45 counter-balanced trials (3 road signs, 3 traffic levels and 5 repetitions), divided up in three blocks (mean duration per block = 17’26”, SD=3’46”). After the experiment, the calibration of the eye tracker was checked again. The experiment lasted about one hour.
Analysis The hypotheses focused on the crossroads approach. Therefore, the analyses were restricted to the last 150 m before the crossroads. The oculomotor variables were the fixation durations and the saccade amplitudes. In addition to mean values, our hypotheses were also tested on the slope (mean increase/decrease rate of the saccade amplitudes and fixation durations with respect to the distance to the crossroads). These slopes relate closely to the evolution of the processes over time. To test our predictions about eye movements with respect to the processes of the decision-making task, preliminary analyses were needed to construct two factors: the Driving Situation and the Position. The Driving Situation factor describes the various situations the driver could be in during the time course of the crossroads approach (see Fig. 1). It depends on the anticipated stopping behavior3 and on the road sign. A NoGo behavior was expected in the Stop condition and a Go behavior in the Priority condition. In the Give Way conditions, the Go and NoGo behaviors (and the associated processes) were both expected. In order to get both decisions, three levels of traffic density were encountered, with “no vehicle” to induce mainly a Go behavior, “many vehicles” to induce mainly a NoGo behavior and “few vehicles” to induce both. The modalities of the Driving Situation factor were Stop with NoGo behavior, Priority with Go behavior, Give Way with Go and with NoGo behavior (GW-Go and GW-NoGo). A descriptive analysis was conducted in order to control that the road sign and traffic density induced the expected stopping behavior, and that the Driving Situation factor makes sense. The Position factor describes the two phases, Before and After the prior decision in the Give Way condition. It depends on the moment of this prior decision. To identify this moment, the data was cut into 10 road segments depending on the driver’s position with respect to the crossroads. Each road segment had a length of 15 m. We postulated that when the driver accelerates significantly in the GW-Go conditions, the prior decision has been made. Thus, it was possible to estimate
Results Preliminary analyses We wanted to link the level of visual exploration with the cognitive processes (D, C and B) associated with a decision-making task (see Fig. 1 and 2). For this, two factors were defined. The first one was the Driving Situation, with Give Way (conditionally to the prior decision: Go or NoGo), Stop and Priority conditions. The second factor was the Position at the crossroads, Before and After the Go/NoGo prior decision in the Give Way condition. The Driving Situation factor. The expected link was checked between, on the one hand, the Driving Situation factor and on the other hand, the stopping behavior, the road sign and the traffic density (see Tab. 1). As expected, there was no stop behavior in the Priority condition. In some trials, participants did not stop in the Stop condition (13 trials out of 483); these trials were removed from the analysis. In the Give Way condition, there were 216 trials with stop behavior and 274 with no-stop behavior. These values are of the same order of magnitude and are clearly related to the traffic density, showing that modulating the traffic density resulted in two sets of decision, Go and NoGo, with roughly the same size. The Position factor. Newman-Keuls tests were conducted in order to compare the mean gas pedal acceleration, for all pairs of 15 m road segments, in the GW3 The stopping behavior was annotated a posteriori from the behavioral data.
5
Lemonnier, S., Br´emond, R. & Baccino, T. (2014) Eye movements in a decision-making driving task
Journal of Eye Movement Research 7(4):3, 1-14
Traffic density No Few Many
GW 7 73 136
NoGo P 0 0 0
S 153 157 160
GW 155 93 26
Go P 163 162 163
S 10 2 1
Table 1 Number of trials with stop at the crossroads (NoGo decision) and without stop (Go decision) with respect to the road sign (Give Way: GW; Priority: P; Stop: S) and traffic density (No, Few or Many vehicles). The total number of trials is 1461. Figure 6. Mean values of the saccade amplitudes as a function of the Position and Driving Situation. The whiskers represent standards errors.
Go condition (see Appendix A, in italics). No difference appeared until 60 m, where significant differences appeared when comparing the first (p = 0.025), second (p = 0.025), third (p = 0.013) and fourth (p = 0.019) road segments to the seventh (60-45 m). This marker is consistent with the gas pedal curve: the push on the pedal increases sharply 60 m before the crossroads (see Fig. 5)4 .
Figure 7. Mean values of the fixation durations as a function of the Position and Driving Situation. The whiskers represent standards errors.
Main results On each section, four ANOVA have been conducted for saccade amplitudes and fixation durations, on the mean values (F1) and the mean slopes (F2). In the Before section, three modalities were considered for the Driving Situation: Give Way, Stop and Priority. In the After section, four modalities were considered: GW-NoGo, GW-Go, Stop and Priority. The results of planned contrasts are presented in Appendix C.
Figure 5. Mean speed for each of four conditions (left axis) and pressing (right axis) on the gas pedal (Give-Way Go condition) and on the brake pedal (Give-Way NoGo condition), as function of the distance to the crossroads. The whiskers represent standards errors. For the vehicle speed, red: GWNoGo, orange: GW-Go, blue: Priority, green: Stop; for the push on the pedal, solid line in black: gas pedal, dash line in black: brake pedal.
The “Before” road section. In the analysis of saccade amplitudes, a significant effect was found on the mean values, F1(2,66) = 27.365, MSE = 0.006, p < .001, η2 = 0.453, with amplitudes higher in the Give Way condi-
The data was thus split into two road sections, at 60 m from the crossroads. In the following, the first six road segments (150 to 60 m before the crossroads) are referred to as the Before section, and the last four road segments (60 to 0 m) are referred to as the After section, according to before and after the prior decision in the Give Way condition. A systematic interaction was found between the Position and the Driving Situation (see Appendix B), which shows a consistency between the behavioral and oculomotor data (see Fig. 6 for the saccade amplitudes and Fig. 7 for the fixation durations).
4
Newman-Keuls tests were also conducted on the brake pedal data in the GW-NoGo condition (see Appendix A, in non-italics). Significant changes appear 90m before the crossroads, when comparing the first (p < .001), second (p = 0.013) and third (p = 0.045) road segments to the fifth (90-75 meters). The change is less sharp however (see Fig. 5), so that we decided to split the data according to the observed change in the gas pedal behavior.
6
Lemonnier, S., Br´emond, R. & Baccino, T. (2014) Eye movements in a decision-making driving task
Journal of Eye Movement Research 7(4):3, 1-14
SA
FD
Situation M SD M-slope SD-slope M SD M-slope SD-slope
Before road section Stop Priority 7.014 8.031 2.280 1.601 1.087 0.974 6.254 5.037 0.279 0.271 0.057 0.049 0.007 -0.076 0.094 0.082
After road section Situation Stop Priority SA M 8.222 8.412 SD 1.881 2.035 M-slope 12.268 -7.759 SD-slope 12.452 15.615 FD M 0.254 0.277 SD 0.050 0.049 M-slope -0.173 0.042 SD-slope 0.181 0.177
GWGo 9.146 2.423 -10.398 10.000 0.226 0.040 0.181 0.208
.001, η2 = 0.769. The slopes were positive in the Stop and GW-NoGo conditions, and negative in the Priority and GW-Go conditions (see Tab. 2 for the means and SD, and Fig. 8). From the analysis of fixation durations, a significant effect was found on mean values, F1(3,99) = 26.044, MSE = 0.001, p < .001, η2 = 0.441, with shorter fixations in the GW-Go and GW-NoGo conditions than in the Stop condition, and shorter in the Stop condition than in the Priority condition. A significant effect was also found on the slopes, F2(3,99) = 26.344, MSE = 0.032, p < .001, η2 = 0.444. The slopes were positive in the GWGo and Priority conditions, higher in the GW-Go condition, and negative in the GW-NoGo and Stop conditions (see Tab. 2 for the means and SD, and Fig. 8). The slopes were steeper in the After section (for the saccade amplitudes: M = 0.0928◦ .m−1 , SD = 0.0791◦ .m−1 ; for the fixation durations: M = 0.0027s.m−1 , SD = 0.0024s.m−1 ), compared to the Before section (for the saccade amplitudes: M = 0.0392◦ .m−1 , SD = 0.0343◦ .m−1 ; for the fixation durations: M = 0.0017s.m−1 , SD = 0.0014s.m−1 ). This difference suggests a relative stability of the processes during the Before section, while steep slopes indicate process change during the After section.
GW 9.535 2.811 1.976 7.121 0.239 0.044 -0.042 0.089
GWNoGo 9.592 1.569 11.780 20.518 0.222 0.043 -0.108 0.165
Table 2 Means of saccade amplitudes (SA) and fixation durations (FD) according to the Position and Situation experimental factors, in terms of mean values (M; degree for SA and second for FD) and mean slopes (M-slope; degree/150m for SA and second/150m for FD), with the associated standard deviation (SD and SD-slope). The Table on Top refers to the Before position, the bottom one to the After position.
Summary of the results. In the “Before” road section, Table 2 shows that the highest saccade amplitudes and the shortest fixation durations are found in the Give Way condition (corresponding to the D process), which is congruent with the hypothesis of a higher visual exploration during this process. The difference between the Priority condition (C process) and the Stop condition (B), with higher amplitudes in C, may be due to a higher level of subjective risk in the Priority condition, related to the absence of interaction associated with the NoGo decision in the Stop condition: with a lower risk level, the process is closer to the Baseline. In the “After” road section, shorter fixation durations were found in the Stop condition (compared to the Priority condition) which is congruent with the anticipation of the next decision in the Stop condition (new D process). For the saccade amplitudes and fixation durations, no difference was found on the mean values between the GW-Go and GW-NoGo conditions. Figure 6 shows that the curves intersect, suggesting that the slope is a better description of the oculomotor behavior in this case. Indeed, the slopes of saccade amplitudes and fixation durations evolved in the same way in the Stop and GW-NoGo conditions on the one hand, and in the Priority and GW-Go on the other hand. This can be seen as an increase in visual exploration (intensification of D processes) in the first two (Stop and GW-NoGo), and a decrease of visual exploration in the other two (Priority and GW-Go).
tion than in the Priority condition, and higher in the Priority condition than in the Stop condition (see Tab. 2 for the means and standard deviations, and Fig. 8 for an illustration of contrasts). No significant effect was found on the mean slopes, F2(2,66) = 0.955, MSE = 0.043. The analysis of fixation durations showed a significant effect for the mean values, F1(2,66) = 21.765, MSE = 0.001, p < .001, η2 = 0.397, with durations shorter in the Give Way condition than in the Stop and Priority conditions (no difference was found between these two conditions). A significant effect was also found for the mean slopes, F2(2,66) = 7.524, MSE = 0.008, p = 0.001, η2 = 0.186. The slopes were negatives in the Give Way and Priority conditions and close to zero in the Stop condition (see Tab. 2 for the means and standard deviations, and Fig. 8). The “After” road section. From the analysis of the saccade amplitudes, a significant effect was found on mean values, F1(3,99) = 11.552, MSE = 0.006, p < .001, η2 = 0.259, with smaller amplitudes in the Priority and Stop conditions compared to the GW-Go and GWNoGo conditions. A significant effect was also found on mean slopes, F2(3,99) = 110.089, MSE = 0.206, p