AQUATIC MICROBIAL ECOLOGY Aquat Microb Ecol
Vol. 37: 283–293, 2004
Published December 15
Dissecting the microbial food web: structure and function in the absence of autotrophs Eva Sintes1, 2,*, Antoni Martínez-Taberner 1, Gabriel Moyà1, Guillem Ramon1 1
Departament de Biologia, Universitat de les Illes Balears, Ctra. Valldemossa km 7.5, 07122 Palma de Mallorca, Spain
2
Present address: Department of Biological Oceanography, Royal Netherlands Institute for Sea Research (NIOZ), PO Box 59, 1790 AB Den Burg, The Netherlands
ABSTRACT: The balance between organic matter producers and consumers defines the metabolism of aquatic ecosystems. Therefore, we can discriminate between net autotrophic and net heterotrophic ecosystems on the basis of the metabolic predominance of either group. Net heterotrophic systems need allochthonous inputs of organic matter. As a model of a heterotrophic ecosystem, we analyzed the structure and function of the microbial food web in littoral cave lagoons of Mallorca (Spain), where trophic food webs in the absence of light are sustained by organic matter, which enters the system through seepage. We compared the microplanktonic food web of these lagoons with that of net heterotrophic ecosystems which receive both autochthonous and allochthonous organic matter. The upper part of the water column has a similar structure and function to that of the oligotrophic open sea, but with a lower abundance and biomass of organisms, with an average of 4.7 × 10⁵ heterotrophic bacteria (HB) ml–1 and 162 heterotrophic nanoflagellates (HNF) ml–1. The deep zones are similar to that of the deep sea, with an average bacterial abundance of 2.9 × 10⁵ HB ml–1 and 48 HNF ml–1 and bacterial production values as low as 0.03 µg C l–1 d–1. KEY WORDS: Microbial food web · Electron transport system activity · Structure · Function · Cave lagoons · Heterotrophy Resale or republication not permitted without written consent of the publisher
The planktonic food web is composed of autotrophs, such as phytoplankton and autotrophic bacteria, and heterotrophs, such as bacteria, Protozoa and mesoand metazooplankton, which play contrasting roles in the ecosystem as producers (autotrophs) or consumers (heterotrophs) of organic matter (e.g. Sherr & Sherr 1988, Azam et al. 1993). The balance between these 2 trophic modes determines the net metabolism of the community, i.e. whether autotrophic production exceeds respiration, or heterotrophy prevails over autotrophic processes. Although planktonic ecosystems may be out of balance at a given point such as during the wax and wane of coastal phytoplankton blooms (Sorokin 1977), oligotrophic systems are generally considered as slightly net heterotrophic over an annual cycle (Duarte & Agustí 1998). The main source of the
organic matter in planktonic communities is the production by phytoplankton, which is channelled into the food web either directly through grazing, or indirectly via the bacterial utilization of dissolved organic carbon (DOC). Bacteria are also the main entry point for allochthonous DOC into planktonic food webs, and therefore play a main role as carbon sources for the community. The relative importance of bacteria as sinks (Ducklow et al. 1986, Pomeroy & Deibel 1986, Pace et al. 1990, Moloney et al. 1991) or links (Pace et al. 1984, Vézina & Platt 1988) in the carbon flow of food webs is still under discussion. However, experimental studies to date have not been able to resolve the role of bacteria as entry points of the allochthonous organic matter in structuring food web dynamics, as the bacterial carbon derived from autochthonous versus allochthonous production cannot be readily discriminated.
*Email:
[email protected]
© Inter-Research 2004 · www.int-res.com
INTRODUCTION
284
Aquat Microb Ecol 37: 283–293, 2004
at 50 and 10 m distance from the seashore, respectively, ES 0.25 km, EP 0.50 km and SG 1.5 km away. The topography of CF, CV and EP is described in Trias & Mir (1977). SG has been described as the largest aquatic cave in Europe, with up to 10.5 km of submerged passages and chambers explored so far. The studies of coastal caves mainly focus on their hydrogeology (Herman et al. 1985, Smart et al. 1988, Humphreys et al. 1999), zoology and biogeography (Stock 1981, Sket 1994, Jaume & Boxshall 1996, 1997), with only limited ecological work done thus far (Camacho 1992). Early studies on the Protozoa of cave systems only included a small list of identified organisms (Kofoid 1899). However, physico-chemical changes, meromixis and their influence on the food web structure are barely investigated. The physico-chemical aspects, such as dissolved Fe distribution (MartínezTaberner et al. 2000) and the distribution of organisms, have only recently been studied (Palmer 1986, Humphreys 1999, Carey et al. 2001). Sampling. The 5 cave lagoons were sampled from November 1996 to June 1999. ES and SG were studied over a seasonal cycle, and the other 3 were studied sporadically. Vertical profiles of salinity, conductivity, temperature and dissolved oxygen were measured with WTW sensors at 10 to 25 cm intervals. Water samples were obtained using a sampling tube with a double cone at the end and connected to a peristaltic pump (Miracle et al. 1992). Water samples were used to determine pH (Crison 501), alkalinity (Strickland & Parsons 1972, Golterman et al. 1978), total organic carbon (TOC-5000 A, Shimadzu), the cations Ca, Mg, Na, K, Fe and Sr (ICP-Plasma 2000, Perkin-Elmer) and suspended matter concentration
Here we examine the transfer of allochthonous DOC by bacteria in the food web by focussing on an extreme environment, cave lagoons, where DOC derived from allochthonous production is the only source of carbon for the microbial food web. We focused, in particular, on differences in the structure and activity of the planktonic food web in the cave system in relation to the open coastal waters. The environmental conditions and the abundance and interactions of bacteria and heterotrophic nanoflagellates were studied in 5 cave lagoon systems on the island of Mallorca (Mediterranean Sea, Spain). In these systems, the input of organic material is largely restricted to allochthonous input. Although some chemosynthesis may occur, as suggested for other anchihaline caves (Yager 1991, Yager & Humphreys 1996), this is limited by the long residence time of the waters.
MATERIALS AND METHODS Study area. The calcareous deposits of the Balearic Islands favor the formation of caves and other karstic structures, some being very close to the coastline and thus supplied with both seawater and freshwater. The southeast coast of Mallorca has numerous cave systems containing brackish pools with water masses of different salinity and oxygen concentrations. We selected 5 of these cave lagoon systems for the present study: Es Serral (ES), Sa Gleda (SG), Cala Varques (CV), Es Pont (EP) and Cala Falcó (CF) (Fig. 1). The cave lagoons studied are shallow, ranging from 1.5 m water depth at EP to 7.0 m at CV. They are located inland close to the coastline, CV and CF being
a
40°
0
45°
40°
b
SPAIN
20 km
39° 40'
Balearic Islands
35°
MALLORCA
EP
39° 20'
-5°
0°
5°
10°
15°
0 200 400 km
2° 20'
2° 40'
3°
CV SG 3° 20' ES Cave location
0
CF
10 km
Fig. 1. Location of the 5 cave lagoon systems studied on the Mallorca coastline. (a) General location of the Balearics in the western Mediterranean Sea; (b) detailed map of Mallorca (extracted from Martínez-Taberner et al. 2000), a section of the coastline is magnified to better visualize the location of the caves (CF: Cala Falcó; CV: Cala Varques; ES: Es Serral; EP: Es Pont; SG: Sa Gleda)
285
Sintes et al.: Microbial food web in cave lagoons
(APHA-AWWA-WPCF 1989). For the suspended matter pool, organic and inorganic matter content were determined by burning organic matter at 550°C. In addition, the abundance and biomass and activity of planktonic microorganisms were determined. Abundance and biomass of planktonic microorganisms. Heterotrophic bacteria (HB) and nanoflagellate (HNF) abundance were determined by epifluorescence microscopy (Porter & Feig 1980). A 60 ml water sample was fixed with formaldehyde (1% final conc.) and stained with DAPI (5 µg ml–1, final conc.). Ten to 15 ml were filtered onto 0.2 µm black polycarbonate filters and 40 ml onto 0.4 µm black polycarbonate filters. The filters were stored frozen for enumeration by epifluorescence microscopy with an Olympus IM. The bacterial biomass was obtained by applying the formula of Norland (1993), assuming an average cellular volume of 0.048 µm3 cell–1 for coastal northwestern Mediterranean Sea bacteria (Vázquez-Domínguez 1999). The HNF biomass was obtained by measuring 20 to 100 cells per sample and estimating the average cell volume by approximation to the nearest geometric shape. The cellular volume was then multiplied by the abundance and converted to carbon biomass using 220 fg C µm– 3 (Børsheim & Bratbak 1987). Ciliate abundance was evaluated in the samples collected at CV by sedimentation and inverted microscope enumeration (Utermöhl 1958). Water samples (1 l) were fixed with acid Lugol’s solution (1% final conc.) and allowed to settle in the bottles for at least 48 h; 800 ml of the supernatant were extracted and from the remaining volume 100 ml aliquots were sedimented in chambers for 48 h. The biomass was calculated from the average cell volume (determined by approximation to the nearest geometric shape in 20 to 100 ciliates), the abundance and applying the carbon conversion factor of 0.2 pg C µm– 3 (Putt & Stoeckner 1989). Respiratory activity measurements. The respiratory activity of plankton was determined by measuring the activity of the electron transport system (ETS) (Packard & Williams 1981). Water samples of about 5 l were filtered on Whatman GF/F glass fiber filters, which were frozen immediately in liquid N2 and stored at –70°C until analysis. Filters were processed within 1 yr. Parallel measurements of respiration by the decrease in dissolved oxygen concentration in BOD-flasks during the course of incubation were conducted on 2 occasions. The relationship between respiration measurements obtained by ETS activity measurement (independent variable) and by the decrease in dissolved oxygen gave different slopes of the linear regression equation for the different caves sampled (Sintes 2002), due to the different organisms and physiological state.
Bacterial production measurements. Bacterial production was determined via the uptake of [3H]-leucine ([3H]-Leu) (Smith & Azam 1992). Four replicate samples and 2 controls (with 5% TCA final conc.) of 1.2 ml each were incubated in Eppendorf tubes with [3H]-Leu (40 nM final conc.) in the dark at in situ temperature for 4 h. TCA (5% final conc.) was added to terminate the incubations and the Eppendorf vials were centrifuged (12 000 × g for 10 min), the supernatant discarded and the pellet resuspended in 5% (v/v) TCA; the latter step was repeated 3 times. Finally, the pellet was resuspended in 0.5 ml scintillation cocktail and allowed to sit for 24 h; thereafter, the radioactivity was determined in a Beckman scintillation counter. The uptake of [3H]-Leu was calculated and converted to bacterial carbon production according to Sommaruga & Psenner (1995). Determining the grazing activity of Protozoa. Bacterivory of protists was evaluated by the rate of disappearance of fluorescent particles (Pace et al. 1990, Vaqué et al. 1992). Duplicate 1 l samples were transferred into polycarbonate bottles with a known concentration of tracers (DTAF-stained Escherichia coli minicells, provided by E. Vázquez). Samples were mixed and incubated at 19°C in the dark and 60 ml aliquots were taken at 0, 24 and 48 h and fixed with glutaraldehyde (1% final conc.). Ten and 40 ml subsamples were DAPI-stained and filtered on 0.2 and 0.4 µm polycarbonate filters, respectively, for enumeration of bacteria and DTAF-stained particles, and HNF. The grazing rate (g, d–1) and the net growth rate (µ, d–1) were calculated according to the formulas of Salat & Marrasé (1994): −1 (1) g = t × ln Ft F 0 1 µ = (2) t × ln N t N 0
(
)
(
)
where F t and F0 are the number of tracers at times t and 0, respectively, N t and N 0 are the number of natural bacteria at times t and 0. The number of grazed bacteria (G, HB ml–1 d–1) was calculated from the trace particles consumed and the bacterial abundance: G =
−g µ × (N t − N 0 )
(3)
Total grazed bacteria (TG) was then calculated as: TG = F0 − Ft + G
(4) –1
The net growth rates of nanoflagellates (µ, d ) were calculated as those for bacteria, from the increase in abundance of flagellates over time assuming exponential growth.
Aquat Microb Ecol 37: 283–293, 2004
1 2
0.8
5 Oxygen Conductivity Temperature
7 17.0
0
2
4
6
8
10
12
Dissolved oxygen concentration ( mg O2l 4
6
8
10
12
17.5
18.0
18.5
19.0
19.5
10
12
Temperature (°C)
14
Conductivity (mS cm -2 )
-1
16
0
)
2
4
6
8
Dissolved oxygen concentration ( mg O2l 5
10
15
20
25
30
35
40
-1
)
45
Conductivity (mS cm-2 )
a
Near-Bottom Surface
10 8 6 4 2
CF
Jul-97
Feb-97
0
SG
EP
ES
CV
120
b 100 80 60 40 20 0
CF
Jul-97
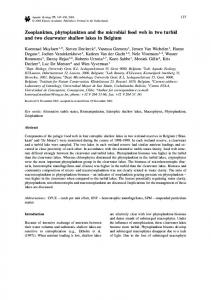
Physico-chemical characteristics. All cave lagoons studied showed conductivity and salinity gradients with values increasing with depth reaching near marine conductivity values at near-bottom waters. ES, SG and EP had intense clines, exemplified for SG in Fig. 2a, which caused meromixis and a layering of the water column in 3 zones: an upper layer where conductivity increased only slowly (mixolimnion or epilimnion), a chemocline where conductivity increased sharply, and a lower layer where conductivity values approached marine values. In contrast, CV and CF did not exhibit such sharp clines and conductivity increased steadily from the surface to near-bottom waters of the cave lagoons as shown for CV in Fig. 2b. Salinity varied little in the layers below the chemocline in all caves over the different seasons (maximum variation 2.2), while in surface waters it varied by up to 6.0. Vertical profiles of the other variables also exhibited a vertical structure. Temperature showed a profile similar to that of conductivity, and dissolved oxygen decreased from the surface to the deeper waters of the cave lagoons. Temperature varied between 15 and 20°C, with larger fluctuations in the surface waters, while deeper cave waters maintained almost constant temperature, ranging from 19 to 20°C throughout the different seasons. Dissolved oxygen concentrations decreased with
12
Feb-97
Seasonal dynamics in the cave systems
% O2 saturation
RESULTS
Dissolved oxygen concentration ( mg O2 l -1 )
Fig. 2. Physico-chemical differences in the structure of the water column in the cave lagoons. (a) Presence of an intense halocline and oxycline in SG in February. (b) Progressive clines in CV in February. See Fig. 1 for cave abbreviations
May-98
16.5
Temperature (°C)
CV
ES
EP
May-98
21
Jul-97
20
Feb-98
19
Feb-98
18
Feb-97
17
Jul-97
16
Feb-97
15
Feb-97
2.2
May-98
2.0
Feb-97
6
May-98
1.8
Jul-97
1.6
Feb-98
4
1.4
Jul-97
1.2
Feb-98
3
Feb-97
1.0
Nov-96
0.6
Feb-97
0.4
Depth (m)
depth (Fig. 2, Fig. 3a), reaching low values towards the bottom of the caves (minimum 21% saturation). Generally, even the upper water column was slightly undersaturated in oxygen for all seasons; only EP had slightly supersaturated oxygen concentrations at the surface in February (Fig. 3b). Concentrations of iron were below the detection limit of the method (