9 Design of an UHV System for the Use on a Sounding Rocket. 157 ... 9.6 Vibrational & Shock Testing of the MAIUS Pumping System . .... author's knowledge the presented system is the first vacuum system at this pressure level qualified ...... Figure 2.4: Accelerations during catapult launch and landing of drop capsule.
Thermal and Mechanical Design and Simulation for the first High Precision Quantum Optics Experiment on a Sounding Rocket Vom Fachbereich Produktionstechnik der UNIVERSITÄT BREMEN zur Erlangung des Grades Doktor-Ingenieur genehmigte Dissertation von Dipl.-Ing. Jens Grosse
Gutachter:
Prof. Dr. H.-J. Dittus Prof. Dr. C. Braxmaier
Tag der mündlichen Prüfung: 07.10.2016
Additional information and materials related to this thesis and the author are available through
www.jensgrosse.de
Contents Abstract
v
Zusammenfassung
I
vii
Introduction
1
1 Scientific Background 1.1 General Definition and Atomic Species Selection . . . . . . . . . . . . 1.2 Cooling Procedures . . . . . . . . . . . . . . . . . . . . . . . . . . . . 1.3 Atom Interferometry . . . . . . . . . . . . . . . . . . . . . . . . . . . 1.4 Typical Experimental Setup . . . . . . . . . . . . . . . . . . . . . . . . 1.5 Advantages and Approaches of Atom Interferometry under Microgravity 2 Microgravity Platforms 2.1 Parabolic Flights . . . . . . . . . . . 2.2 Drop Tower Bremen . . . . . . . . . 2.3 Sounding Rockets . . . . . . . . . . . 2.4 Foton Capsule . . . . . . . . . . . . . 2.5 International Space Station . . . . . . 2.6 Satellite Missions . . . . . . . . . . . 2.7 Comparison of Microgravity Platforms 3 State of the Art 3.1 Atomic Fountain Interferometer 3.2 I.C.E . . . . . . . . . . . . . . . 3.3 QUANTUS-1 . . . . . . . . . . 3.4 QUANTUS-2 . . . . . . . . . .
. . . .
. . . .
. . . .
. . . . . . . . . . .
. . . . . . . . . . .
. . . . . . . . . . .
. . . . . . . . . . .
. . . . . . . . . . .
. . . . . . . . . . .
. . . . . . . . . . .
. . . . . . . . . . .
. . . . . . . . . . .
. . . . . . . . . . .
. . . . . . . . . . .
. . . . . . . . . . .
. . . . . . . . . . .
. . . . . . . . . . .
. . . . . . . . . . .
. . . . . . . . . . .
. . . . . . . . . . .
. . . . . . . . . . .
. . . . .
3 3 5 10 12 14
. . . . . . .
17 17 19 21 23 24 27 29
. . . .
31 31 36 39 43
Contents
ii
II
Payload Environment and Requirements
49
4 Scientific Objective
51
5 Launch Vehicle and Flight Environment 5.1 Motors and Spin-Up Motors . . . . . . 5.2 Motor Adapter and De-Spin System . . 5.3 Service System and ACS . . . . . . . . 5.4 European Recovery System (ERS) . . . 5.5 Time Event List of MAIUS-1 . . . . . . 5.6 Mechanical Environment . . . . . . . . 5.7 Thermal Environment . . . . . . . . . . 5.8 Magnetical Environment . . . . . . . .
. . . . . . . .
. . . . . . . .
. . . . . . . .
. . . . . . . .
. . . . . . . .
. . . . . . . .
. . . . . . . .
. . . . . . . .
. . . . . . . .
. . . . . . . .
. . . . . . . .
. . . . . . . .
. . . . . . . .
. . . . . . . .
. . . . . . . .
. . . . . . . .
. . . . . . . .
. . . . . . . .
53 55 56 57 59 60 62 66 67
6 Payload Requirements 6.1 Coordinate Systems . . . . . . . . . 6.2 Operational Requirements . . . . . 6.3 Experimental Sequence of MAIUS-1 6.4 Mechanical Requirements . . . . . 6.5 Thermal Requirements . . . . . . . 6.6 Other Requirements . . . . . . . . .
. . . . . .
. . . . . .
. . . . . .
. . . . . .
. . . . . .
. . . . . .
. . . . . .
. . . . . .
. . . . . .
. . . . . .
. . . . . .
. . . . . .
. . . . . .
. . . . . .
. . . . . .
. . . . . .
. . . . . .
. . . . . .
69 69 72 73 75 76 77
III
. . . . . .
. . . . . .
Mechanical Design, Simulation and Testing
7 Payload Setup and Mechanical Design 7.1 Payload Structure and Sealing . . . . . 7.2 Harness and Umbilicals . . . . . . . . . 7.3 Physics Package . . . . . . . . . . . . . 7.4 Laser System . . . . . . . . . . . . . . 7.5 Electronics System . . . . . . . . . . . 7.6 Batteries and Power Distribution . . . .
. . . . . .
. . . . . .
. . . . . .
. . . . . .
. . . . . .
8 Qualification of Systems and Components 8.1 Methodology . . . . . . . . . . . . . . . . . . . 8.2 Vibration Testing of Rubber Dampers . . . . . . 8.3 Qualification of Batteries and Power Distribution 8.4 Qualification of Electronic System . . . . . . . . 8.5 Qualification of Laser System . . . . . . . . . . 8.6 Qualification of Physics Package . . . . . . . . .
. . . . . . . . . . . .
. . . . . . . . . . . .
. . . . . . . . . . . .
. . . . . . . . . . . .
. . . . . . . . . . . .
79 . . . . . . . . . . . .
. . . . . . . . . . . .
. . . . . . . . . . . .
. . . . . . . . . . . .
. . . . . . . . . . . .
. . . . . . . . . . . .
. . . . . . . . . . . .
. . . . . .
81 83 95 102 128 133 139
. . . . . .
143 143 146 150 151 152 154
Contents
iii
9 Design of an UHV System for the Use on a Sounding Rocket 9.1 Required Pumping Speed and Equilibrium Pressure Calculation . . 9.2 Outgassing Rates . . . . . . . . . . . . . . . . . . . . . . . . . . . 9.3 Leakage Rates . . . . . . . . . . . . . . . . . . . . . . . . . . . . . 9.4 MAIUS-1 Pump Concept and Effective Pumping Speed . . . . . . . 9.5 UHV Testbed Setup . . . . . . . . . . . . . . . . . . . . . . . . . . 9.6 Vibrational & Shock Testing of the MAIUS Pumping System . . . . 9.7 Estimation and Improvement of the Equilibrium Pressure in MAIUS
IV
. . . . . . .
. . . . . . .
. . . . . . .
Thermal Design, Simulation and Testing
10 Simulation of Aerothermal Heating 10.1 Atmospheric Model . . . . . . . . . . . . . . . . 10.2 Geometric Model and the Finite Volume Method 10.3 Computation of the Heat Flux at the Rocket Hull 10.4 Coupling with FEM Simulations . . . . . . . . . 10.5 Expected Temperatures at Rocket Hull . . . . . .
. . . . .
. . . . .
. . . . .
157 158 159 170 173 188 200 209
211 . . . . .
. . . . .
. . . . .
. . . . .
. . . . .
. . . . .
. . . . .
. . . . .
. . . . .
. . . . .
213 215 218 221 229 230
11 Heating of Payload Interior 233 11.1 Thermal Convection to MAIUS-1 systems . . . . . . . . . . . . . . . . . 234 11.2 Thermal Conduction to MAIUS-1 systems . . . . . . . . . . . . . . . . . 239 11.3 Thermal Radiation to MAIUS-1 systems . . . . . . . . . . . . . . . . . . 241 12 Thermal Design and Control System 12.1 Thermal Control System Concept of the MAIUS-1 Payload . . . . . . . . 12.2 Effective Flow and Heat Transfer Coefficient of the Water Cooling Circuits 12.3 Physics Package . . . . . . . . . . . . . . . . . . . . . . . . . . . . . . . 12.4 Laser System . . . . . . . . . . . . . . . . . . . . . . . . . . . . . . . . 12.5 Electronic System . . . . . . . . . . . . . . . . . . . . . . . . . . . . . . 12.6 Battery System . . . . . . . . . . . . . . . . . . . . . . . . . . . . . . .
243 243 246 252 263 269 283
13 Thermal Testing of MAIUS-1 payload 13.1 Test Setup and Parameters . . . . . . 13.2 Physics Package . . . . . . . . . . . . 13.3 Laser System . . . . . . . . . . . . . 13.4 Electronic System . . . . . . . . . . .
289 290 291 292 294
V
Conclusion
. . . .
. . . .
. . . .
. . . .
. . . .
. . . .
. . . .
. . . .
. . . .
. . . .
. . . .
. . . .
. . . .
. . . .
. . . .
. . . .
. . . .
. . . .
. . . .
295
14 Summary
297
15 Outlook
301
Abstract The MAIUS-1 scientific payload is a high precision quantum optics experiment about to fly on a VSB-30 sounding rocket with the scientific objective to demonstrate the feasibility of creating the first Bose-Einstein condensates in Space. To achieve this goal the experiment is using various sensitive instruments imposing strong requirements on the thermal and mechanical design. This thesis is divided into four major parts. The first part will introduce the reader without physics background into the field of atom interferometry and identify the necessary methods and instruments to successfully generate a Bose-Einstein condensate and perform atom interferometry. Furthermore the advantages of performing these experiments in microgravity environment are elaborated and possible platforms to access this environment are compared. Finally some ground-based and microgravity experiments are described to report the state-of-the-art and emphasize the level of miniaturization carried out to fit the experimental setup into a sounding rocket. The second part introduces the Brazilian-German VSB30 sounding rocket and the German recovery system, service module and attitude control system. The mechanical, thermal and magnetic environment aboard the sounding rocket are characterized by evaluating flight data from former TEXUS and MASER flights. Moreover the requirements of the scientific payload and its instruments regarding attitude, accelerations, vibration, operating temperatures and magnetic environment are summarized and compared with the environment. The hard thermal and mechanical requirements are a priori incompatible with the environment aboard the sounding rocket. The laser modules for example have to be temperature stabilized with an accuracy of ±0.1K, while the rocket hull temperature increases by 80 K during the flight. Some of the vacuum components are know to be very sensitive to vibrations, while passing a test with a vibration level of 8.1g RMS is mandatory to qualify those components for the use on a sounding rocket. The third part will present the mechanical design of the MAIUS-1 scientific payload, which ensures a reliable operation of the instruments in the harsh environment of the sounding rocket. A universal low-cost suspension of the instruments platforms has been developed and tested, which reduces the vibrational loads significantly. Because the optics require an ambient pressure of at least 800 hPa, a sealing method to maintain this pressure level in the entire scientific payload has been elaborated and tested. This includes sealing of the standard RADAX connections, which were slightly modified for this purpose. While the instrument selection or design, as well as the functional design of the four MAIUS-1 systems has been elaborated by the project partners, the mechanical and thermal design of an system housing suitable for the use on a sounding rocket has also been in the scope of this thesis. All system housings have been minimized in size and mass and have been designed according to requirements of the sheltered instruments. The laser system for example houses 8 laser modules,
vi
ABSTRACT
a Zerodur spectroscopy board, a Zerodur splitting and distribution board as well as multiple fibre splitters and sensors in only 0.021 m3 at a mass of 23 kg. The laser system and all other system housing designs and the housed instruments are described in detail in this thesis. As an additional topic of this thesis all of these systems have been successfully vibration tested according to a especially developed test methodology at vibration levels between 2.0g RMS and 8.1g RMS. The results of these tests are presented herein as well. Vacuum components appeared to be very sensitive to vibrational loads during component and subsystem level tests. To perform the quantum optics experiments a vacuum chamber with a pressure below 5 × 10⁻¹⁰ hPa is essential. Thus intensive vibrational and static load tests on indium and con-flat seals, as well as on ion-getter and titanium sublimation pumps have been performed. The results of these tests helped to find a suitable vacuum system design. The innovative design and the components of the MAIUS vacuum system will be presented in detail in this thesis. This design and the used components have been qualified for operation under vibrational loads of up to 8.1g RMS. A pressure rise has been observed in all test runs, which is caused by temporary leaks at the seals. It was proven that the pressure rise is depending on the level of vibrations applied. The design presented herein is capable of regaining a pressure of 5 × 10⁻¹⁰ hPa in less than 40 s. To the author’s knowledge the presented system is the first vacuum system at this pressure level qualified for the use on a sounding rocket. In the last part of the thesis the thermal design of the scientific payload is described. The payload systems are thermally controlled with fans and two water cooling circuits, which cool the systems until lift-off. For this purpose a water-cooling umbilical has been developed and tested. The water cooling ensures a thermally stable environment in the lab operation and at the launch pad until lift-off. During the flight the heat is passively stored in the system heat sinks. For the sizing of the heat sinks the heat input due to aerodynamic heating has to be known. A code has been developed, which approximates the heat flux and the wall temperatures based on the free stream conditions. Furthermore the code is capable of approximating the heat transfer coefficient of natural convection during the boost (hyper-g) phase of the flight based on the wall temperatures and acceleration profile. Additionally the code allows to estimate the air temperature inside a capsuled payload. The heat input to the payload systems by convection is estimated using the parameters obtained from this code. The thermal conductivity of the rubber dampers has been determined experimentally to simulate the heat input to the payload systems through the instrument platform suspension by conduction. In addition to the heat input through aerodynamic heating, the internally dissipated heat from each system is specified and included into a detailed finite element simulation to verify the heat sink mass. Ultimately the thermal control system for ground and flight mode was tested during a payload bench test. The thesis closes with recommendations and possible improvements for future space-born quantum optics experiments.
Zusammenfassung Die wissenschaftliche Nutzlast von MAIUS-1 ist ein hochpräzises quanten-optisches Experiment, was das Ziel der Erzeugung des ersten Bose-Einstein Kondensats im Weltraum verfolgt. Um diese Ziel zu erreichen nutzt das Experiment eine Vielzahl von empfindlichen Komponenten und Instrumenten, die herausfordernde Anforderungen an das mechanische und thermische Design stellen. Diese Arbeit teilt sich in vier Abschnitte auf. Der erste Abschnitt ist eine Einführung in das Feld der Atominterferometrie, der sich hauptsächlich an Leser richtet, die nicht aus diesem Feld kommen. Es werden die nötigen Techniken und Instrumente vorgestellt um ein Bose-Einstein Kondensat zu erzeugen. Zudem wird der Vorteil erörtert, diese Experimente unter Schwerelosigkeit durchzuführen. Weiterhin werden die verschiedenen Plattformen, die Zugang zu dieser Umgebung bieten vorgestellt und verglichen. Zum Abschluss wird der Stand der Technik von quantenoptischen Experimenten unter Schwerelosigkeit und in sogenannten Fontänen beleuchtet um den erforderlichen Grad der Miniaturisierung des Experimentes herauszustellen. Der zweite Teil dieser Arbeit stellt die brasilianisch-deutsche Höhenforschungsrakete VSB-30 und das deutsche Bergungs-, Service- und Lagerregelungssystem vor, welches mit der MAIUS-1 Nutzlast genutzt wird. Anhand von Messdaten aus vergangenen TEXUS und MASER Flügen wird das thermische, mechanische und magnetische Umfeld an Bord der Rakete charakterisiert. Dieses Umfeld wird den Anforderungen der Vielzahl von Instrumenten in der wissenschaftlichen Nutzlast gegenübergestellt. Dabei ist zu beobachten, dass die Anforderungen teilweise deutlich von der zu erwartenden Umgebung abweichen. Die Lasermodule beispielsweise erfordern eine thermische Stabilisierung auf ±0.1 K wohingegen die die Außenhülle der Rakete sich um fast 80 K erwärmt. Weiterhin sind ultra-hoch Vakuumkomponenten bekannt dafür empfindlich auf Vibrationen zu reagieren. Trotzdem müssen die Komponenten ein Vibrationstest mit einen Lastlevel von 8.1g RMS bestehen um auf der Rakete eingesetzt werden zu können. Der dritte Teil der Arbeit widmet sich diesem Widerspruch und präsentiert ein mechanisches Design, welches einen verlässlichen Betrieb der sensitiven Komponenten in diesem harschen Umfeld ermöglicht. Es wurde beispielsweise eine universell einsetzbare, effektive und kostengünstige Vibrationsdämpfung für die Montage der Systeme an der Raketenaußenhülle entwickelt und getestet. Weiterhin wurde eine hermetische Dichtung der gesamten Nutzlast entwickelt und getestet um einen Druck von mindestens 800 hPa während des gesamten Flug aufrecht zu erhalten, wie es von den optischen Komponenten gefordert wurde. Während die Auswahl und Konstruktion der Komponenten, sowie das funktionelle System-Design der vier MAIUS Systeme bei den Projektpartnern lag, ist das mechanische und thermische Design der Systemgehäuse Bestandteil dieser Arbeit. Hierbei wurden die Gehäuse weitestgehend in Masse und Volumen optimiert ohne die thermischen und mechanischen Anforderungen der beherbergten Instrumente außer Acht zu lassen. Ein gutes
viii
ZUSAMMENFASSUNG
Beispiel liefert hier das Lasersystem, welches acht leistungsstarke Lasermodule, zwei Zerodurboards mit Freistrahloptiken, sowie eine Vielzahl von Photodioden, Elektronikkomponenten und Fasern auf einem Volumen von nur 0.021 m3 beherbergt. Das System hat dabei eine Masse von nur 23 kg. Das Lasersystem und seine Komponenten wurde, genau wie alle anderen MAIUS-1 Systeme, erfolgreich in einer Vibrationstestkampagne für die Nutzung auf einer VSB-30 Höhenforschungsrakete qualifiziert. Die genaue Beschreibung der erarbeiteten Methodologie zur Qualifizierung der Systeme bei Lasten zwischen 2.0g RMS und 8.1g RMS, sowie die Ergebnisse dieser Tests sind ebenfalls Bestandteil dieser Arbeit. Besonders ausführlich wird die Konstruktion und Auslegung des Ultrahochvakuumsystems behandelt. Für die Erzeugung von Bose-Einstein Kondensaten ist ein niedriger Hintergrunddruck unabdingbar. Dieser Druck sollte während der Experimente 5 × 10⁻⁸ Pa nicht überschreiten um das Erreichen der wissenschaftlichen Ziele nicht zu gefährden. In Rahmen dieser Arbeit wurde der Gaseintrag durch Desorption und Permeation der Kammerwände und der Einbauten abgeschätzt und einige Möglichkeiten vorgestellt diesen in zukünftigen Experimenten zu reduzieren. Vor allem aber wurde eine Vielzahl von Vibrationstests im Bereich von 2.0g RMS und 8.1g RMS und statischen Lasttests bis zu 1200 N durchgeführt, um die Leckrate von Indium und ConFlat (CF) Dichtungen unter Last zu bestimmen. Die Ergebnisse dieser Tests flossen in das innovative Design des MAIUS Vakuumsystem ein. Bei allen Vibrationstests wurde ein Druckanstieg beobachtet. Das hier präsentierte System ist in der Lage innerhalb von 40 s nach einem Vibrationstest bei 5.4g RMS den geforderten maximal Druck von 5 × 10⁻⁸ Pa wiederherzustellen. Nach Kenntnis des Autors ist dieses System das erste Vakuumsystem für einen solchen Druckbereich das für den Einsatz auf einer Höhenforschungsrakete qualifiziert wurde. Der letzte Teil der Arbeit betrachtet das thermische Design der wissenschaftlichen Nutzlast. Die verschiedenen Systeme der Nutzlast nutzen im Bodenbetrieb Lüfter und Wasserkühlungen um die Temperaturen in den geforderten Bereichen zu halten. Die zwei Wasserkühlungskreisläufe kühlen die System bis zum Start der Rakete. Zu diesem Zweck wurde ein Umbilical zur Wasserkühlung entwickelt und getestet, welches beim Start getrennt wird. Von diesem Zeitpunkt an wird die dissipierte Wärme passiv in den System Wärmesenken gespeichert. Zur Auslegung dieser Wärmesenke ist es erforderlich den Wärmeeintrag durch die aerodynamische Erwärmung der Raketenhülle zu kennen. Im Rahmen dieser Arbeit wurde daher ein Code entwickelt der den Wärmestrom durch aerodynamische Erwärmung und die resultierenden Hüllentemperaturen basierend auf den Parametern der freien Anströmung abschätzt. Außerdem ist der Code in der Lage die Wärmeübergangskoeffizienten der freien Konvektion in der Beschleunigungsphase der Rakete aus den Beschleunigungswerten und den Wandtemperaturen zu approximieren. Dies erlaubt auch die Abschätzung der Erwärmung der eingeschlossenen Luft. Die Temperatur der in der Nutzlast eingeschlossenem Luft und der berechnete Wärmeübergangskoeffizient werden genutzt um den Wärmeeintrag durch freie Konvektion in die Nutzlastsysteme zu bestimmen. Außerdem wurde die thermische Leitfähigkeit der Vibrationsdämpfer experimentell bestimmt um auch den Wärmeeintrag durch Wärmeleitung in die Systeme simulieren zu können. Schließlich wurde auch die dissipierte Energie der Systeminstrumente ausführlich charakterisiert und in einer detaillierten FEM Simulation integriert um die Wärmesenkenmasse zu verifizieren. Die Ergebnisse der Simulation wurden mit Messwerten von thermischen Tests verglichen. Diese Arbeit schließt mit einigen Verbesserungsvorschlägen und Empfehlungen für das mechanische und thermische Design zukünftiger quanten-optischer Experimente für Weltraumanwendungen.
Part
I
Introduction
1
Scientific Background
To propose a suitable design for a scientific payload, one will have to understand the principle, architecture and specialties of its experiment. Since the scientific objective of the MAIUS mission is to demonstrate the feasibility of performing atom interferometry in space, the principle of the creation of Bose Einstein Condensates (BECs) and atom interferometry shall be presented in the following to the reader without. Moreover a typical experimental setup as well as the general requirements and constraints for the generation of a BEC shall be stated.
1.1 General Definition and Atomic Species Selection In 1924 the existence of BECs was proposed by Satyendranath Bose [Bos24] and Albert Einstein [Ein24]. Einstein postulates that cooling bosonic gases to a temperature very close to absolute zero will cause the atoms to condense to the lowest possible quantum state. At this point quantum effects become apparent on a macroscopic scale. Since the atoms are in the same state, they can be described using one single wave function. This characteristic behavior can be used to perform atom interferometry. To create a BEC a dilute gas of bosons needs to be cooled to a critical temperatures Tc . This is achieved using laser light, magnetic fields and radiofrequencies as described in the following section. The critical temperature is defined in [Pet02] as Tc ≈ 3.3125
h¯ 2 n2/3 mkB
(1.1)
It is depending on the particle density n, the mass per boson m, the reduced Planck constant h¯ and the Boltzmann constant kB . Therefore the temperature is only depending on the atom species and particle density n.
SCIENTIFIC BACKGROUND
4
The latter factor is strongly depending on the experiment configuration (trap geometry and particle number). Therefore it can not be calculated from literature values and is only valid for a certain experiment configuration. For Rubidium 87 in the QUANTUS-2 setup the critical temperature has been measured as Tc = 313 nK [Her13a].
REPUMPING
COOLING
COOLING
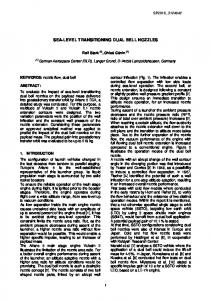
BECs have been demonstrated for a large number of other isotopes such as 7 Li, 23 Na, 39 K, 41 K, 85 Rb, 133 Cs, 52 Cr, 40 Ca, 84 Sr, 86 Sr, 88 Sr, 174 Yb, 164 Dy and 168 Er. In the MAIUS experiment the alkaline atom isotope 87 Rb is used, because the heritage and knowledge in the QUANTUS-3 consortium gained with the predecessor experiments, which are also using Rubidium 87.
Figure 1.1: Hyperfine structure indicated by dotted line.
87 Rb
with transitions for cooling and Repumping. Detuning to red
Rubidium 87 has one valence electron on the outer shell, which is advantageous in laser cooling. Figure 1.1 shows the energy level structure of 87 Rb naming the different hyperfine states and important allowed transitions. In presence of a magnetic field the hyperfine states (F) will split into 2F+1 Zeeman sublevels m f . Thus the F=1 level will split into 3 sublevels m f = [−1, 0, 1], the F=2 state splits into the 5 sublevels m f = [−2, −1, 0, 1, 2] and the F=3 state into 7 sublevels m f = [−3, −2, −1, 0, 1, 2, 3]. How the energy level structure and the different transitions can be used to cool Rubidium87 shall be described in the next section.
Cooling Procedures
5
1.2 Cooling Procedures There are different procedures to cool (Rubidium 87) atoms to the desired temperature. These techniques should be described briefly in the following. This should explain the necessity of the different technical instruments and underline the complexity of the experiment.
1.2.1 Doppler Cooling & Magneto-Optical Trap A basic principle used for laser cooling is the stimulated absorption and spontaneous emission of photons from a laser beam. If the laser wavelength equals the transition frequency in the specific hyperfine structure, the atom will absorb a photon from the laser beam and cause the atom to be transfered in the excited state. The absorption process causes a loss in the momentum of the atom. After a short period of time the electron is emitted spontaneously in a random direction transferring the atom to its initial state again. This process can be repeated infinitely thus it is a spontaneous emission cycle as indicated in 1.1.
Figure 1.2: Illustration of slowing of atoms by stimulated absorption and spontaneous re-emission (adapted from [Kri08])
If the wavelength of the lasers is tuned slightly below an transition of the atom (red detuned) as illustrated by the dotted line in figure 1.1 this process will become velocity selective. Atoms which do not move or are traveling in the same direction as the laser beam will not perform a transition, because the transfered energy is to low. However atoms with a velocity vector opposing the laser beam will see the wavelength of the laser light blue detuned to match the transition wavelength due to the Doppler effect. Therefore only atoms moving towards the laser light will absorb a photon as illustrated in figure 1.2. For this method of cooling only three orthogonal pairs of counter-propagating lasers beams are needed to shine in light from all directions in space. The frequency of the laser diode for cooling of Rubidium is typically set to 780 nm and can be controlled (for de-tuning) by current modulation of the master oscillator. Rubidium 87 is excited by laser light from the 52 S1/2 F=2 state to the 52 P3/2 F=3 state and vice-versa. However it is also possible that the atom is transferred into the 52 P3/2 F=2 state. From this state the electron can perform two allowed transitions either into the 52 S1/2 F=2 or F=1 state as illustrated at the right side of figure 1.1. Therefore it is possible that those atoms exits the spontaneous emission cycle.
6
SCIENTIFIC BACKGROUND
Atoms in the 52 S1/2 F=1 state would not be cooled by the incident laser light. To avoid loosing those atoms, an additional re-pump laser at a different frequency is used to bring the atoms back into the cycle. The Doppler cooling procedure mentioned above is only velocity selective. The atoms are slowed and thus cooled, but they are not trapped at a certain position as desired. This can be achieved by adding a quadro-pole magnetic field to the setup. This setup and method is called magneto-optical trap (MOT). The magnetic field is generated with an anti-helmholtz configuration of magnetic coils with zero-crossing in the center of the field. Contrary to the Doppler laser cooling the laser light needs to have a circular polarization, otherwise it would not interact with the magnetic sublevels of the atoms. The counter-propagating laser beams will have different polarizations ( σ + -σ − -configuration). A exemplary one-dimensional MOT setup is illustrated in figure 1.3 for a fictitious transition from a ground state F=0 (without magnetic sublevels) to an excited state F=1 (with three sublevels m f = [+1, 0, −1]). In the MAIUS-1 setup the transition used for magnetooptical trapping will be 52 S1/2 F=2 to 52 P3/2 F=3 as shown in figure 1.1 resulting in more sublevels.
Figure 1.3: Principle of MOT cooling for a fictitious transition from a ground state F=0 to an excited state F=1 (adapted from [Kri08])
As illustrated in figure 1.3 the magnetic field causes a Zeeman shift to the magnetic sensitive m f states of the rubidium atoms (in this example m = +1 and m = −1). The shift increases with the intensity of the magnetic field and therefore with the distance of the atoms to the trap center. With an increase in the Zeeman shift the transition frequency changes towards the frequency of the detuned lasers and a transition becomes possible. Laser beams with σ+ polarization can only interact with the m = +1 state, while the laser with σ− -polarization will only interact with the m = −1 state. If the σ+ laser is pointing at
Cooling Procedures
7
the MOT from the left, the σ− laser from the right and the frequency of the laser is detuned by the sum of Doppler shift and Zeeman shift the atoms will be cooled and pushed towards the trap center simultaneously. This cooling method is limited by a minimum (Doppler) temperature. This temperature can be calculated from h¯ Γ (1.2) TDoppler = 2kb as given in [Met99]. With given values of the reduced Boltzmann constant kb , Planck constant h¯ and line width Γ for Rubidium 87 D2 the Doppler limit temperature �87transition, � for Rubidium 87 can be determined as TDoppler Rb ≈ 145μK.
1.2.2 Sub-Doppler Cooling It was demonstrated that the laser setup described above can be used to cool the atoms below the Doppler limit [Ada97]. The red-detuned counter-propagating σ + - and σ − polarized laser beams, described in the MOT setup above, will result into a light field, whose polarization remains linear (Π) and rotates around the beam axis forming an helix as shown in figure 1.4. When progressing one wavelength λ along the beam the polarization vector will rotate by 360◦ . Polarization Ʌ
ʍ+-polarisation
ʍ--polarisation
Laser
r
r0
+ʄ/4
Laser
+ʄ/2
Figure 1.4: Polarization resulting from two counter-propagating σ + - and σ − -polarized laser beams. The polarization is linear Π and oscillates around the light axis forming a helix.
If an atom moves within this field, the polarization vector will rotate within the fixed coordinate system of the atom. The rotation speed is depending on the velocity of the atom. This rotation is basically imposing a virtual magnetic field oscillating with the rotation of the vector. This field results in velocity depending coupling between the sub-states m f of the hyperfine structure. As a matter of fact the population distribution in the different m f -states changes for an moving atom. If an atom moves towards a σ − -polarized laser beam (in direction r > 0) as illustrated in figure 1.5, the changing polarization described above will result in a higher population in the m f = −1, than in the m f = +1 sub level.
SCIENTIFIC BACKGROUND
8
Due to the fact that the probability is higher for an m f = −1-atom to absorb a photon from a σ − -polarized than from a σ + -polarized laser beam, there is an unbalance between the force of both beams for a moving atom. Thus the atom will more likely absorb an photon from the opposing laser beam, as from the co-propagating beam [Dal89].
Red-detuned, ʍ+-polarisation
movement
movement
Laser
Laser
r
movement towards r < 0
mf= +1 mf= 0
Red-detuned, ʍ--polarisation
mf= -1
movement towards r > 0
Initial state
mf= +1 mf= 0
mf= -1
mf= +1 mf= 0
mf= -1
Figure 1.5: Influence of the atom movement on the population distribution in the different sublevels (m f ) of the ground state
This results in a velocity selective cooling as described for the Doppler cooling in the previous section. However this cooling is not induced by the Doppler Effect, but by the velocity depending population distribution in the sub-states, thus it will also effect slower atoms . For this reason it is possible to cool the ensemble below the Doppler temperature, without additional hardware but with demanding requirements to the polarization stability of the lasers. The sub-doppler cooling procedure is limited by the recoil temperature, defined by the energy deposited transfered to an atom by the spontaneous emission of a single photon Trecoil
h¯ 2 k2 = 2mkb
(1.3)
The theoretical �87 �minimum temperature for the sub-doppler cooling of Rubidium-87 is given as Trecoil Rb ≈ 362nK.
Cooling Procedures
9
1.2.3 Magnetic Trap and Evaporative Cooling Evaporative cooling is the last step in the cooling process selectively removing fast atoms from the ensemble. For evaporative cooling the atoms are transfered into a harmonic magnetic trap, with a field minimum at a value larger than zero as exemplary shown in figure 1.6a. This is important to prevent the loss of atoms due to unwanted transitions into non trappable states (spin-flips). In MAIUS this trap is created by superposition of the field generated by the magnetic coils and an inhomogenous field generated by planar circuits on an (atom) chip [Sei14]. This chip consists of different layers which reduce in conductor diameter. The size of the trap is reduced stepwise by switching to smaller circuits on the chip. This will lead to a compression of the atomic ensemble in the trap. 10
mF
E
9
2
8 7
1
|B(r)|
6
h ¯ ωRF
5 4 3 2
-1
ωf,1 ωf,2
1 0 −1
0
ωf,3 −0.5
0 r
0.5
-2
1
(a) Trap frequency for different trap geometries on exemplary square trap potential (ω f ,1 < ω f ,2 < ω f ,3 ). Units are arbitrary.
(b) RF-evaportation scheme [Din04]
Figure 1.6: Principle of evaporation cooling
During the evaporative cooling process hot atoms are removed from the trapped ensemble by applying a RF-field emitted by an RF antenna. The RF signal will remove atoms with a certain energy and coordinate in the magnetic field of the trap selectively. If the energy of the RF field is equal to the potential difference between two m f -states as illustrated in figure 1.6b, a spin-flip will be induced. This will transfer the atoms in a magnetic state, which is not trappable and remove them from the trap. Stepwise reduction of the RF frequency will remove the hottest atoms in each step. Thus the mean temperature of the ensemble will be lowered with every step and finally cool the atoms below the critical temperature Tc and create the BEC.
SCIENTIFIC BACKGROUND
10
1.3 Atom Interferometry Before atom interferometry is performed, it is desirable to reduce the expansion rate of the BEC. This is achieved with a method called delta-kick cooling. The atoms are released from the magnetic trap, an re-trapped after a short time. This procedure will reduce the expansion rate significantly giving access to longer interferometer times. Additionally, the atoms are transferred into a non magnetic state by applying a laser pulse to reduce the influence of residual magnetic fields which effect the measurements despite magnetic shielding. This procedure is named adiabatic rapid passage. Finally, the prepared atoms are used to perform atom interferometry. In an atom interferometer setup the BEC is used as matter wave source, while laser light pulses are used as mirror or beam splitter. Since interferometers are inherently depending on the wave nature, cold atoms can be used to establish interferometers with ultra high sensitivity due to the short de Broglie wavelength. ʋ /2
ʋ
ʋ /2
g|1 g|1 g|1
g|2
g|1
Input
Output 2
g|2 g|2
g|2
g|1
Output 1
T
T
Figure 1.7: Mach Zehnder atom interferometer schematic with a spacing between the pulses of T and an interferometer time of 2T . The output of the interferometer is the population in the two states g|1 and g|2.
Figure 1.7 shows the schematic of a typical Mach-Zehnder atom interferometer. The mirror is realized by applying a π/2-pulse of laser light. The probability of the atoms to absorb two photons from the light pulse is 50%. Thus the pulse will cause a superposition of the two states g1 and g2 . Moreover the atoms receive a recoil impulse from the absorbed photons and separate from the atoms that are left in the ground state.
Atom Interferometry
11
The π-pulse shown in after a time T, will mirror the states as indicated in the figure. When a period of 2T has passed a second π/2-pulse recombines the clouds again. Depending on the phase difference that has accumulated between the two paths, some atoms will remain in the manipulated state and most of them will fall back to the initial state. The atoms in each state are detected by absorption imaging. The ratio of the atom number of the two states represent the interferometer signal and will allow to calculate the phase difference. This phase difference is depending on the external acceleration and rotation. If the light pulses are not only separated in time but are also in space and the atoms are moving with a velocity perpendicular to the light pulse the atom interferometer is sensitive to rotations and can thus be used as gyroscope. Atom interferometer gyroscopes offer high precision combined with ultra long time stability. Other than laser gyroscopes they do not need a GPS link to compensate their drift. This is why these gyroscopes are used e.g. on nuclear powered submarines giving opportunity of long under water operation [Ric08]. In an accelerometer setup the light pulses are only separated in time. Thus the atoms will only receive a recoil impulse along the interferometer axis and will not posses a velocity component perpendicular to the light pulse. In an accelerometer configuration atom interferometers can be used to measure the local gravitational field of the earth with an accuracy of 10−6 to 10−9 g in ground based devices. With this accuracy it is possible to detect natural resources such as metals, oil or water [Pet01]. Moreover an atom interferometer offers the possibility to test the university of free fall (UFF) or the weak equivalence principle (WEP) postulated by Einstein. The university of free fall states, that two bodies with different masses m1 and m2 will be accelerated equally by an gravitational field if there are no disturbances (such as air friction) present [Ein07]. This can be tested by using two clouds of different isotopes (e.g. 40 K and 87 Rb) as test masses. The difference between the acceleration of the test masses is defined as Eötvös factor: η =2
|am1 − am2 | |am1 + am2 |
(1.4)
This factor has been measured to be smaller than 10−13 using lunar laser ranging [Wil04] and a rotating torsion balance instrument [Sch08]. A setup with two atom interferometer would allow a precise measurement of the acceleration of both clouds and therefore of the Eötvos factor. Hereby the sensitivity is strongly depending on the environment and the platform used. The satellite mission study STE-QUEST proposed an accuracy in the order of 10−15 after 5 years of operation in [Lei13], which would be a significant improvement to current measurements.
SCIENTIFIC BACKGROUND
12
1.4 Typical Experimental Setup In the following the different subsystems and interfaces of an atom interferometer apparatus as described above shall be summarized. Figure 1.8 shows a functional diagram of a typical atom interferometer, illustrating the different subsystems and their interfaces. The vacuum chamber is the centerpiece of the atom interferometer. For cooling and performing atom interferometry at least three pairs of coils in anti-helmholtz configuration and three orthogonal pairs of laser beams are needed as described above. An atom chip will reduce the size of the apparatus and the needed power to operate it. While the atom chip needs to be placed close to the atoms and is typically mounted inside the vacuum chamber, the coils are directly attached to the chamber.
Figure 1.8: Components of a typical atom interferometer setup arranged in a functional diagram
The laser system provides the light with the needed power, frequency and polarization for trapping, re-pumping, detection and atom interferometry. Aside from the laser modules a high number of optics and modulators might be needed to achieve this. The produced light is often guided to the vacuum chamber by optical fibers. Collimators will couple the laser light from the optical fiber into the vacuum chamber through a viewport. A collimator offers the possibility to adjust the angle of the laser beams and ensures its coherence. Moreover waveplates allow to change the polarization of the beam.
Typical Experimental Setup
13
Aside from light and magnetic fields, a trappable atom species is needed to perform atom interferometry. Either dispensers or ovens are used to provide the atoms. In general the atom source is situated close to the chamber, to ensure a stable vapor pressure of the atomic species. To measure the temperature of a cold atoms or to evaluate the atom interferometer, a detection device is essential. Typically the detection is performed by a CCD camera detecting the fluorescence of the atoms or by taking an absorption image of the cloud. The used device has to be situated close to the experiment chamber to keep the optical path short and improve accuracy. In order to achieve measurements of high accuracy disturbances have to be minimized. One disturbance is the collision of the trapped atoms with the residual gas in the vacuum chamber. For this reason a vacuum pressure of less than 5 × 10⁻¹⁰ hPa has to be maintain ed in the chamber. This is achieved by a suitable combination of vacuum pumps. Moreover external magnetic fields can disturb the experiment. A magnetic shielding made from MUMETALL, which is of high magnetic permeability protects the atoms from these fields as illustrated by the dotted line in figure 1.8. For control, power supply and data acquisition of/from the different components mentioned above, a significant amount of electronics will be needed. The computer will manage and process all data from the electronics and the detection and display it for the operating personnel. A detailed description of the configuration of different ground-based and microgravity experiments as well as of the MAIUS payload will be given in chapter 3 and 7.
SCIENTIFIC BACKGROUND
14
1.5 Advantages and Approaches of Atom Interferometry under Microgravity Within this section the advantages of performing atom interferometry under microgravity shall be pointed out. As mentioned above atom interferometry is used to measure accelerations and/or rotations from an accumulated phase difference between the two interferometer paths. This phase difference is not only depending on the acceleration a or rotation Ω but also quadratically depending on the time T between the applied light pulses as given in equation 1.5 and 1.6 [Bar13]. Δφacc = ke f f aT 2 � � � � 4π 2 vt Ω L 2 Δφrot = λdB vl
(1.5) (1.6)
While the dependency is obvious in the accelerometer equation, it is not that intuitive in the gyroscope setup. However with the distance between two light pulses L and the longitudinal velocity vl perpendicular to those light pulses and along L, the pulse separation time becomes T = L/vl . Thus Δφrot is proportional to T 2 . Thus longer interrogation times will directly result in higher accuracy of the atom interferometer. To perform atom interferometry the atoms have to be released from the magnetic trap. Without the trap the atoms will be accelerated by gravity towards the bottom of the vacuum chamber. Thus the interferometer interrogation time is limited by the time of free fall of the atomic ensemble. There are several approaches to extend the time of free fall. The simplest way is to enlarge the vacuum chamber and drop the atoms. A second option to enlarge the time of free fall in ground-based experiments is the use of atomic fountains. Hereby the atoms themselves are accelerated against gravity inside the vacuum chamber and will return to the bottom of the vacuum chamber performing a parabolic flight. This will double the time of free fall of the cold atoms compared to a drop of the atoms. The achievable time of free fall (and pulse separation time) is depending directly on the geometry of the chamber. Obviously building large vacuum chambers and magnetic shielding with meters of height is challenging. Moreover it is difficult to keep the environmental conditions stable along the drop/fountain tube and to isolate the tube from external disturbances. In ground-based experiments gravity could also be compensated by a magnetic force acting in the opposite direction as the vector of gravity. This procedure is called (electromagnetic) levitation. However there are a few drawbacks to levitation. Most importantly levitated atoms can not be used for atom interferometry as proposed in section 1.3, because the atoms need to be in a magnetic sensitive state (m f �= 0) to be levitated. Moreover it is impossible to use this technique for tests of the equivalence principle, since the necessary levitation force is depending on the atomic mass of the atom species. Therefore different atomic species would require different magnetic fields.
Advantages and Approaches of Atom Interferometry under Microgravity
15
Another possibility to enlarge the time of free fall of the atoms is to provide microgravity for the atom ensemble by using a free falling laboratory as e.g. a satellite or a drop capsule. The time of free fall t f f of the atomic cloud for a given length smax , in which the atomic cloud can be detected can been calculated for a given gravitational acceleration from � 2smax (1.7) tf f = g neglecting all disturbances. For a microgravity level of 10−6 g0 the time of flight would increased from to 0.078 s at earth gravity to 78 s with g0 = 9.81 m/s2 . Aside from the time of free fall the expansion rate of the atomic cloud influences the time of free evolution. As described in section 1.3 the expansion rate itself can be influenced by the trap geometry before release and by advanced methods as the delta-kick-cooling. The geometry of the magnetic trap before release of the atoms is limited by the gravitational field, since the potential of the trap must feature a gradient that is larger than the gravitational force on the trapped atoms. This does not allow the use of shallow traps without a significant loss of atoms. Performing atom interferometry in microgravity will allow to access lower trap frequencies and reduce the rate of expansion. Simultaneously the time of flight is increased due to the lower residual acceleration of the atomic cloud. This allows to stick with compact vacuum chambers and magnetic shielding. Lastly disturbances such as vibrations and accelerations, which are the dominant noise source in lab experiments, are avoided or minimized on some microgravity platforms. Therefore it is possible to achieve similar or even better sensitivity on microgravity platforms than on fountain experiments [Lei13]. The sensitivity is depending on the available time of microgravity and the environmental conditions (as e.g. disturbances). Thus the choice of the microgravity platform is important. A trade off between available microgravity time, repeatability rate, engineering afford and costs has to be performed. Some possible candidates for providing micro gravity to an atom interferometer experiment shall be introduced in the following chapter.
2
Microgravity Platforms
Several platforms are available to perform experiments under microgravity. There are advantages and disadvantages associated with each platform, which shall be discussed in this section focusing on platforms supported by the European Space Agency (ESA).
2.1 Parabolic Flights Multiple providers worldwide offer parabolic flights for scientific purposes. The NASA is using a Boeing KC-135 for parabolic flights, while the russian space agency is using a Iljuschin 76. The German Space Agency (DLR) and the European Space Agency (ESA) are both using an Airbus A300 “ZERO-G”, which is operated by the French company NOVESPACE and based in Bordeaux-Mérignac, France. The A300 “ZERO-G” offers
Figure 2.1: A300 Zero G (left) and cross section of experiment area (right) [Ros09]
100 m2 (5 m × 20 m) of experimental area, which is usually divided between up to 15 experiments. The maximum height of an experiment is approximately 2.5 m as shown in figure 2.1. There is almost no limitation in mass. The Airbus A300 Zero-G is Based on the A300B2, which is capable of carrying an estimated payload of 35 t [Air09]. A total of 40 passengers can be accommodate within the aircraft.
18
MICROGRAVITY PLATFORMS
Electrical power is provided by the plane as 220 V AC or 28 V DC in energy panels with standard sockets [Ros09]. Thus the plane offers almost laboratory conditions regarding space and power supply.
Figure 2.2: Flight profile for microgravity experiments
As shown in figure 2.2, the plane provides microgravity for roughly 22 s in every parabola. Typically a plane will perform around 100 parabolas in one campaign. Thus a high repeatability can be performed on very low costs. However the quality of microgravity on parabola flights is limited to ±0.05 g. The loads on the experiment are moderate compared to the other platforms. During ascent and decent phase accelerations of 1.8 g appeal to the payload as shown in figure 2.2. In the worst case scenario of a “hard landing” the loads will not exceed 9 g [Ros09]. Another important advantage is that the plane can accommodate the scientists as well. Therefore the payload can be accessed and influenced at any time if the experiment requires input/decisions of humans. The Airbus A300 "Zero-G" was replaced by an Airbus A310 "Zero-G" mid 2015. This plane offers the same possibilities as its predecessor.
Drop Tower Bremen
19
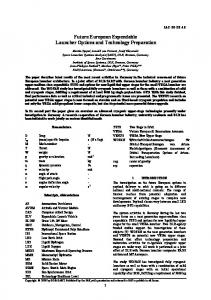
2.2 Drop Tower Bremen The drop tower in Bremen is one of the most prominent drop towers for scientific experiments in the world. The facility is situated at the University of Bremen and operated by the Center of Applied Space Technology and Microgravity (ZARM). During operation the whole tower will be evacuated in order to improve microgravity quality. The tower will provide a microgravity level as low as 10−6 g. The tower can be used in a drop mode, whereby the capsule is lifted 120 m to the top of the tower and released. This will result in 4.74 s of microgravity time. The second operation mode is the catapult launch. For a catapult launch the capsule is pneumatically accelerated from the basement of the tower, which will almost double the time of microgravity to approximately 9.3 s.
Figure 2.3: Different drop capsules sizes and dimension drawing of experiment platform of ZARM Drop Tower [Dro12]
As shown in figure 2.3 there are two sizes of capsules used in the drop tower. The choice of the capsule size is depending on the operation mode. In the drop mode either the large or the short capsule can be used. The available volume for experiment within the large capsule is defined by the capsule length of 1.72 m and the diameter of the experiment platforms of 0.7 m [Dro12]. The usable length of the payload area decreases to 0.95 m when using the catapult mode or the short capsule. The mass of the payload should not exceed 264.4 kg (short capsule) or 221.2 kg (long capsule) in drop mode. The maximum mass of the payload for the catapult operation is given as 161.5 kg. The capsule is supplied with power until short before the drop or launch. After release the electrical power is provided by batteries situated at the bottom of the capsule (ref. figure 2.3). The nominal voltage of these batteries is 24 V DC. Their nominal capacity is 25 A h. For thermal control of the payload, water cooling can be provided until drop / launch.
20
MICROGRAVITY PLATFORMS
Figure 2.4 shows a typical acceleration profile inside a capsule in catapult operation. The average acceleration of the catapult system is about 18 g for 280 ms.
Figure 2.4: Accelerations during catapult launch and landing of drop capsule. The acceleration in these phases exceeds the range of the accelerometer. In between during the microgravity phase the accelerations are in the order of 10−6 g. [Dro12]
The peak value in the acceleration phase has been recorded with 30 g. The deceleration at the end of any drop is 25 g in average for about 200 ms, which also applies for drop operation. The peak value in both types of operation is given as 50 g for approximately 11 ms [Dro12]. Although the presence of vibrations and accelerations is limited to a short period of time, the environment is challenging for sensitive instruments and has to be considered in the design phase of the experiments. Since the whole tower has to be evacuated before each drop, a maximum of three drops or catapult launches per day can be performed within the drop tower Bremen. This still allows to make e.g. parameter studies at moderate costs.
Sounding Rockets
21
2.3 Sounding Rockets Worldwide, a lot of sounding rocket types are in service and launched from various sites around the globe. The sounding rocket community in Europe is dominated by the German and Swedish space companies. Therefore most sounding rockets are launched from Esrange in northern Sweden. Figure 2.5 shows some sounding rockets used in Europe. At Esrange mainly four types of sounding rockets are launched, which shall be described in the following.
Figure 2.5: Some sounding rockets operated in Europe with suppliers of motors (adapted from [Sta13])
The smallest and cheapest launcher is the Improved Orion, which is used by the Mobile Rocket Base (MORABA) as part of the German Aerospace Center (DLR) for the REXUS student sounding rocket program. The Orion motor is combined with the Nike motor to the Nike/Orion launcher, used for the Mini-Texus program operated by Airbus Defense and Space. This launcher might be replaced by the Brazilian VS-30 in the near future. The VS-30 is already launched by the MORABA with smaller scientific payloads. The S-30 motor of the VS-30 vehicle is also used as an upper stage within the Brazilian VSB-30 launcher. The S31 motor is providing the lower stage for this launcher. The European Space Agency (ESA) in cooperation with Airbus DS uses the launcher for the TEXUS program, while the ESA cooperates with the Swedish Space Corporation (SSC) within the MASER missions using the same launcher. For heavier payloads and access to longer microgravity times, the MORABA is providing the Brazilian VS-40 motor consisting of the S40TM lower stage and the S44M upper stage. Airbus DS is using the Castor-4B motor in the MAXUS program offering similar performance.
MICROGRAVITY PLATFORMS
22
In table 2.1 the different launchers are compared regarding usable experiments time (t), the residual acceleration or quality of the reduced gravity environment (ares ), the maximum payload mass for given experiment time (mmax ), module diameter (dmodule ), maximum scientific payload length (lmax ), the maximal acceleration during ascent (amax ) and the recommended qualification test level (aqual ). Motor (Launcher)
t [s]
ares [g]
Imp. Orion (Rexus) Nike/Orion (MiniTexus) VS-30 VSB-30 (Texus/Maser) VS-40 Castor-4B (Maxus)
180 ≤ 10−4 240 ≤ 10−4 240 ≤ 10−4 360 ≈ 10−6 (∗) 720 ≤ 10−5 750 ≤ 4 × 10⁻⁵
mmax [kg]
dmax [m]
lmax [m]
amax [g]
aqual [grms ]
95 180 260 400 500 800
0.356 0.6 0.438 1.00 0.5 N/A 0.5 3m N/A N/A 0.64 3.8m
20 21 8 12 N/A 13
12.7 N/A 8.1 8.1 N/A 5.9
Table 2.1: Comparison of major rockets launched in Europe [Maw14] [Ceg05] [Hof14] [Sta12] [Bar12] (* predicted μg-level with attitude and rate control supported by DMARS inertial platform)
As illustrated in table 2.1 sounding rockets offer good microgravity quality for long continuous periods of time. This allows to perform longer experiment cycles as e.g. on parabolic flights or in the drop tower. The Castor-4B motor used in the MAXUS program is offering the highest payload volume and mass. Moreover the long microgravity time of about 12 minutes is attractive to scientists. However a MAXUS launch is also the most expensive launch opportunity in Europe.
Figure 2.6: DC accelerations during flight of TEXUS 42 (VSB-30 launcher) [Ett06a]
Foton Capsule
23
Due to the high mechanical loads and vibration caused by the motor burn, the experiment has to be designed and tested to withstand these loads, although they will only occur in the first seconds of the flight. A typical distribution of the accelerations during a sounding rocket flight is shown in figure 2.6. The actual loads may vary depending on the mass of the payload, but the distribution over time is characteristic for the launcher. The vibrational loads for qualification are given in table 2.1 for every launcher. During the re-entry in the earth atmosphere even higher loads of up to 25 g could be recorded on former missions [Ett06b]. However the payload might be reused for future flights, if the experiment is designed to withstand both launch and re-entry loads. The loads affecting the experiment and its instruments on a sounding rocket are comparable to those of some larger launchers. Moreover the qualification procedures (as vibration and/or thermal testing) are similar, this is why an experiment or instrument is often tested on sounding rockets first before it is being chosen for an satellite or ISS mission.
2.4 Foton Capsule Several reentry capsules have been developed worldwide. Foton capsules have been developed by the Russian Space Agency and are used in a cooperation with the European Space Agency for European microgravity experiments. The capsule is launched with the Soyuz-U rocket into a circular near earth orbit with a maximum apogee of 305 km. The capsules will remain in orbit for 12 to 18 days and the re-entry capsule will return the experiment(s) to earth after this period. Within Fonton 1.6 m3 are available for experiment hardware, which shall not exceed 650 kg in mass. This volume can be pressurized at 1 atm if required by the payload. During flight the temperatures in the payload compartment are stabilized between 19 ◦C to 26 ◦C [Ceg05].
Figure 2.7: Foton capsule layout with payload accommodation (highlighted in yellow) [Ceg05]
MICROGRAVITY PLATFORMS
24
The orbit altitude and the low level of perturbations result in a microgravity quality of 1 × 10⁻⁵ g or better. Therefore Foton offers an opportunity to perform experiments with longer durations and prepare future experiments on the international space station (ISS) or on a satellite. The Soyuz launcher causes linear accelerations at the payload mounts of up to ±10 g for about 600 s during launch. During re-entry the measured peak accelerations are ±16 g for a duration of 20 s. The landing shock is demanding as well with 40 g for 40 ms to 50 ms. Moreover the hardware has to be vibration tested at a maximum level of 7.5 grms for 120 s in each axis [Ari12]. In addition sine vibration with up to 1.3 g (10 − 30 Hz) and shock tests have to be performed. Because of the long time in orbit, the instruments inside Foton have to withstand ionizing background radiation of 0.055 rad/day. During solar flares the instruments can be subject to a radiation of up to 50 rad.
2.5 International Space Station The International Space Station (ISS) offers the possibility to perform microgravity experiments aboard. Experiments can either be placed inside the station in racks or outside on the truss. Inside the station the experiments are accommodated in international standard payload racks (ISPRs). There are overall 35 ISPRs station-wide. In addition there are 18 external and unpressurized accommodations for microgravity experiments.
Figure 2.8: International Standard Payload Rack (ISPR) dimensions [Ceg05]
Internal payloads are exposed to the artificial atmosphere of the ISS. This atmosphere consists of 78% nitrogen and 21% oxygen and is kept in the pressure range between 97.9 kPa to 102.7 kPa. A water cooling loop can be provided for thermal management capable of dissipating up to 1200 W [Ceg05].
International Space Station
25
The payload envelope in each ISPR measures 1.2 m3 as illustrated in figure 2.8 with a maximum mass of the payload hardware of 704 kg (excluding rack structure). The power supply varies between 3 kW and 12 kW depending on the ISPR. Therefore the ISS offers almost laboratory conditions in space with reduced gravity and most important the possibility of human interaction. External space exposed payload accommodations differ in size. At the Columbus module operated by ESA, the payloads are mounted to a standardized Columbus External Payload adapter (CEPA) offering a envelope of 1.39 m3 as shown in figure 2.9. The payload mass including CEPA shall not exceed 290 kg. External payloads at Columbus module are supplied with 1.25 kW. There is no active temperature control implemented.
Figure 2.9: Columbus External Payload Adapter (CEPA) dimensions [Ceg05]
The station is set to "microgravity mode" six times a year. This mode is defined to last for 30 days. Within this period of time scheduled activities, that might influence the microgravity quality (such as steering maneuvers or sports activities of the crew) are minimized. The microgravity level within this time should therefore only influenced by two types of acceleration, the quasi-steady acceleration and vibrations. Accelerations are considered quasi-steady if at least 95% of their power lies below 0.01 Hz as measured over one orbit, which lasts 5400 s [NAS]. The aerodynamic drag, which slows the station down, limits the microgravity level to 1 × 10⁻⁶ g. The gravitation gradient of structural parts not in line with the stations center of mass will reduce the microgravity level depending on the payload location to a maximum of 3 × 10⁻⁶ g as presented in figure 2.10. Vibrations above 0.01 Hz and up to 300 Hz are not considered within these levels, since they are damped by the active rack isolation system (ARIS). The ISS will allow continuous measurements of 30 days in microgravity with the quality of 3 × 10⁻⁶ g or better. However normal crew activity and vibrations might have a significant impact on measurements.
26
MICROGRAVITY PLATFORMS
Crew activities will exceed the usual acceleration level by orders of magnitude. Skylab T-013 recorded the effect of several crew activities. It was proven that crew activity can have a significant effect on the spacecraft and the microgravity level [Ols81]. Although the ISS mass is significantly higher than the one of the Spaceshuttle and isolation methods have been improved this effect needs to be considered.
Figure 2.10: At the ISS the μg quality is depending on the location of the experiment. With increasing distance from the stations center of gravity the quality can reduce to 3 × 10⁻⁶ g [Ceg05]
All payloads have to fulfill the strict ESA safety requirements. Requirements differ for internal and external payloads. Payloads inside ISS have to meet requirements regarding astronaut safety and payloads outside the station require radiation hardness. Regardless their position all payloads need to pass several tests and need to be well documented to grant access to the ISS. Once a payload is accepted it has to be transported to the ISS. This is usually done with the European automated transfer vehicle (ATV), the American DRAGON carrier or the Russian PROGRESS capsule. These are typically launched with an Ariane 5, Falcon 9 or Soyuz rocket. Therefore the payload has to be tested to fulfill the requirements of the launcher as well. Mechanically the requirements of the launcher are the most demanding. Exemplary Ariane 5 requires a random vibration test with 11grms for qualification of hardware. Moreover a sine vibration test with maximum loads of 5g (5-150Hz) and a test with shocks up to 2820g have to be passed for successful qualification. [Bra97] [Ari11]. Soyuz qualification levels have been summarized in section 2.4 [Ari12].
Satellite Missions
27
2.6 Satellite Missions Satellite missions are usually launched with the same vessels as the ISS cargo (including payloads). Therefore some of the tests performed in the qualification process are similar to the ones for ISS payloads. However there are several tests, which have to be passed additionally. One of the most challenging might be the qualification for radiation hardness, which is mandatory since the instruments might be exposed to radiation of multiple kinds for the duration of the mission. Moreover thermal requirements have to be considered, which depend on the orbit of the satellite. Near earth orbits will always have to consider direct sun, Earth albedo and Earth infrared heat flux aside from heat dissipation of internal instruments. Exemplary direct solar flux density on a plane perpendicular to the solar rays is given by the solar constant with 1367 W/m2 . Although the actual thermal loads will be smaller than this, high thermal fluxes will require well designed thermal control systems, which will be tested by thermal cycling tests simulating hot and cold cases during the mission and orbit.
Figure 2.11: Useable volume beneath Ariane 5 fairing [Ari11]
The most powerful launcher available in Europe, the Ariane 5, is capable of carrying a maximum of 20 t into low earth orbit. Payload mass will reduce for higher orbits. The usable volume for payloads underneath the fairing is approximately 180 m3 as illustrated in figure 2.11.
28
MICROGRAVITY PLATFORMS
Launch costs for Ariane 5 are estimated with 90 Million Euro. This results in a approximated price of 4500 Euro per kilogram. For this reason weight and size of the payload should be decreased as far as possible. A shared launch with multiple satellites will reduce costs for a mission significantly.
(a) Environmental effects and their impact on the acceleration level aboard a satellite for a 370 km and 740 km orbit
(b) Induced accelerations by center of gravity (CG) displacement for high altitude orbit
(c) Induced accelerations by center of gravity (CG) displacement for low altitude orbit
Figure 2.12: Induced accelerations aboard satellites with an drag area of 60 m2 , moment of inertia of 1 × 10⁷ kg m2 and a mass of 3270 kg [Ols81]
The quality of microgravity on an unmanned spacecraft is depending on multiple factors influenced by the orbit height. These are environmental conditions (such as aerodynamic drag or solar pressure) and center of gravity misalignment (resulting in accelerations due to laws of orbital dynamics). The impact of these effects is illustrated in figure 2.12 for a spacecraft with an drag area of 60 m2 , moment of inertia of 1 × 10⁷ kg m2 and a mass of 3270 kg on a circular orbit [Ols81]. As pictured in figure 2.12a aerodynamic drag will be dominant in low earth orbit. At an attitude of roughly 740 km solar pressure effects will be dominant at day time. This results in a cycling effect over one orbit as illustrated. Although the absolute drag is depending on the geometry of the individual spacecraft the impact of the orbit altitude on the microgravity level can be estimated from the numbers given in [Ols81] If the satellite is not spin stabilized and the orbit is perfectly circular, only objects aligned along the orbital path of the center of gravity will experience zero gravity conditions. Misalignment of e.g. experiments will lead to a reduced microgravity level. Figure 2.12b and 2.12c demonstrates the influence of a center of mass misalignment for different circular orbits with the given satellite configuration. Technically a alignment of the area of interest for the scientist (e.g. detection zone of experiment) in the order of a centimeter to the spacecraft center of gravity is reasonable. In this case it is possible to achieve a microgravity level better than 10−8 g at an orbit altitude of approximately 740 km.
Comparison of Microgravity Platforms
29
2.7 Comparison of Microgravity Platforms Although there are several other possibilities to perform experiments in microgravity, the platforms mentioned above are capable of carrying complex high precision experiments such as an atom interferometry experiment with all payload subsystems needed. Therefore only these platforms are compared in this section. As shown in table 2.2 the different platforms offer different advantages and disadvantages. The best microgravity quality and longest experiment duration is offered on satellites. Aboard the satellite a constant level of microgravity is obtained for the lifetime of the satellite mission, which is typically 5-10 years. This allows long integration times for measurements and therefore high accuracy. However satellite missions require intensive testing, long time of preparation, investments in the order of hundreds of million Euro and they do not allow to return the experiment to earth. Platform Parab. Flights Drop Tower Sound. rocket Foton capsule ISS Satellite
t [s]
ares [g0 ]
20 ≤ 10−3 9.3 ≈ 10−6 750 ≤ 10−5 12-18d ≤ 10−5 30d ≤ 3 ∗ 10−6 5-10y ≤ 10−7
mmax [kg]
Vmax amax [m3 ] [g0 ]
»1000 161.5 800 650 704 »1000
250 1.54 4.9 1.6 1.2 180
2.5 18 13 10 10 10
Remark Lab-like environment High Repeatability Intermediate costs human spaceflight restr. High costs
Table 2.2: Comparison of microgravity platforms
Parabolic flights and drop tower experiments allow high repetition rates, but only short experiment cycles. The access to these platforms is relatively easy and fast. Moreover the operation cost for both platforms are small compared to the other platforms. Sounding rockets can significantly increase the time of microgravity. Motor vibrations before the measurement phase require a accurate qualification process to ensure reliable operation of all instruments. This will increase development cost and time for the experiment hardware. Moreover the cost for a launch campaign are higher. ISS and Foton capsule close the gap between the largest sounding rocket MAXUS and a satellite payload. ISS and Foton offer very good microgravity quality, with less risk of disturbances on the Fonton capsule then aboard the ISS. The qualification process gets more complicated and challenging for advanced platforms such as ISS or satellites and most often a certain technology readiness level (TRL) is demanded from space agencies in order to provide funding for such complex and expensive missions. The platforms with easy access (parabolic flights,drop tower and sounding rockets) can be used to test the instruments under microgravity and prove the concept of the experiment. Qualification for these platforms will increase the TRL and the chance of selection for more advanced platforms.
3
State of the Art
Since the first BEC has been produced by Cornell and Weiman in 1995 a lot of investigations have been performed in lab-based experiments. Bose-Einstein Condensates helped to study many questions of fundamental physics, such as matter wave interferometry, superfluidity or even the slowing of light pulses. Hereby the quality of the BECs (atom number, temperature, etc.) has improved a lot over time and the accuracy of measurements was increased significantly. Simultaneously the size of the experimental setup has been decreased further and further. With access to new technologies atom interferometry became a large field of interest in physics allowing e.g. for an improved test of the weak equivalence principle (WEP). As described above large times of expansion and respectively large times of (free) flight (TOF) of the atomic ensemble is essential for atom interferometry measurements with high accuracy. In the following some ground-based fountain and microgravity experiments on different platforms shall be introduced.
3.1 Atomic Fountain Interferometer As described in section 1.5 it is possible to increase the time of free flight of the atomic ensemble by launching the atoms vertically and performing a parabola. This principle is called atomic fountain. There are several atomic fountain interferometer operated worldwide, three of which are to be presented here. These apparatuses represent the state of the art of ground based experiments and shall be characterized and compared in this section. The basic parameters are summarized in table 3.1.
STATE OF THE ART
32
Volume Weight Atomic species Platform Microgravity time Interferometer time (2T) Sensitivity (Δg/g)
GAIN
Stanford
Wuhan
3.68m3 N/A 87 Rb ground-based ground-based 460 ms 2.5 × 10⁻⁸
> 10m3 N/A 87 Rb & 85 Rb ground-based ground-based 2300 ms 6.7 × 10⁻¹²
> 13m3 N/A 87 Rb, 85 Rb, 6 Li & 133 Cs ground-based ground-based ≥ 2600 ms (*) N/A
Table 3.1: Comparison of characteristics of atomic fountain interferometers (*targeted values) [Hau13] [Dic13b] [Kas13] [Hog14]
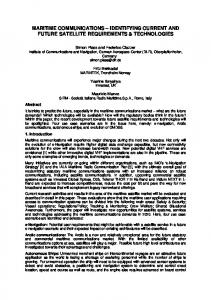
The only mobile and very compact atom interferometer described in this section is the Gravimetric Atom Interferometer (GAIN) developed by the Humbold University Berlin, which should be described here for comparison. The whole experiment setup consists of two standard racks, sheltering the laser system, electronics and optics, and a mobile trolley carrying the physics package. In total the complete apparatus occupies 3.68 m3 .
(a)
(b)
(c)
Figure 3.1: Photo of GAIN physics package outside of Humboldt University and drawing of interferometer set-up [Hau13]
As illustrated in figure 3.1 the physics package consists of a 3D MOT vacuum chamber and a large vacuum tube representing the interferometer zone. Within the vacuum chamber 87 Rb atoms are loaded into a 3D MOT directly from dispensers connected to the chamber. After loading the atoms is completed the optical molasses is launched upwards and is cooled to a final temperature of about 13 nK by state and velocity selection [Hau13]. These selections are performed by applying laser light and RF signals (evaporation cooling).
Atomic Fountain Interferometer
33
Since the Raman beams and the third MOT beam enter the chamber only at the top they need to be retro reflected at the bottom of the chamber to cover all three axes in space. By passing a λ /4 waveplate twice the polarization is rotated by 90◦ to perform subdoppler cooling as described in section 1.2.2. After state and velocity selection the atomic cloud enters the interferometer zone, which is protected by a three layer magnetic shield. When entering the interferometer tube, a Raman pulse sequence as described in section 1.3 is applied. The first pulse separates the atoms in the F1 and F2 states. The different states perform a different parabola and are first mirrored by a second pulse after time T and finally recombined by a third pulse at the end of their flight (after 2T) (fig. 3.1a.). When exiting the interferometer zone the atoms in each state are measured with fluorescence detection (fig. 3.1b.). From the population in both states the phase difference and the local gravitation can be calculated. Hereby sensitivity is enlarged with the pulse separation time T between two Raman pulses. The maximal time T is limited by the geometry of the interferometer zone and external disturbances. For instance, vibrations have a significant and direct influence on the interferometer signal. In the GAIN setup vibrations are compensated by active vibration isolation of the retro reflection mirror (fig. 3.1c.). This reduced the vibrations and therewith the noise in the interferometer signal significantly. The active vibration isolator enabled to enlarge the pulse seperation time T from 40 ms to 230 ms, which increased the sensitivity in Δg/g from 7 × 10⁻⁶ to 2.5 × 10⁻⁸ [Hau13]. Moreover the Earth rotation is compensated during interferometer phase by a piezo driven tip/tilt mount for the mirror. This minimizes the effect of the Coriolis force due to earth rotation on the measurement. These two techniques are also used by the 10 m fountains in Stanford and Wuhan. The setup of those two 10 m towers is similar, although there are some smaller differences. The techniques for launching and trapping are the same as used in the smaller fountains. Both towers use a 3-layer magnetic shielding, which has been assembled and annealed afterwards. Moreover both shields are stabilized by a tower of aluminum profiles as illustrated in figure 3.2 and 3.3. The Stanford fountain is operated with Rubidium 87 and Rubidium 85, which are prepared at the bottom of the fountain and launched upwards. Hereby the atoms are pre-cooled in a 2D MOT from which the 3D MOT is loaded. This increases the atomic flux and therefore shortens the loading time of the 3D MOT. The interferometer zone is 8.2 m high, which allows a time T between the Raman pulses of the interferometer of 1150 ms. This equals 2300 ms of interferometer time (2T) [Dic13b]. The long interferometer time results in a a single shot precision of 6.7 × 10⁻¹² . For integration over several shots in one hour a resolution of 5 × 10⁻¹³ g has been demonstrated and a resolution in the order of 10−15 g is theoretically possible.
34
STATE OF THE ART
Figure 3.2: Principle and photo of 10m atomic fountain experiment in Stanford [Kas13]
Due to its high sensitivity the apparatus can not only be used as a sensitive gravimeter, but also to perform tests of general relativity and quantum mechanics with a much higher resolution, than in common experiments. As mentioned above the Stanford 10m atomic fountain uses two atomic species, which offers the opportunity to test the weak equivalence principle (WEP) by trapping and launching Rubidium 87 and Rubidium 85 atoms simultaneously. The atomic fountain situated in Wuhan (China) has been developed and built after the Stanford apparatus and thus provides some additional features. It includes two magnetooptical traps (MOT). One at the bottom of a 10 m interferometer zone and one at the top. The top MOT is designed to trap Lithium 6 and Rubidium 85 simultaneously. These atoms are dropped instead of launched to perform atom interferometry and e.g. test the WEP. The second MOT situated at the bottom is capable of trapping Rubidium 87, Rubidium 85 and Caesium 133. While Rubidium 85 will be used in an atomic fountain gravimeter for precise measurements, Rubidium 87 and Caesium 133 will be used for implementation of a dual fountain clock. Other than in the Stanford experiment Zeeman slowers are used to pre-cool the atomic beam generated directly from the atom source. These tube-shaped devices will slow and cool the atoms of the beam by applying a magnetic field with a intensity decreasing towards the exit of the slower and a laser beam pointing opposite to the atomic beam, which is red detuned to the transition wavelength of the atoms.
Atomic Fountain Interferometer
35
Due to the combined shift of the atomic transition by the Zeeman effect and Doppler effect of the moving atoms, fast atoms will be slowed already at the beginning of the device by the laser light (as explained in section 1.2.1), while slower atoms will be cooled later on. The exit temperature can be adjusted by the field gradient along the atomic beam path. As shown in figure 3.3 there are two Zeeman slowers attached to each 3D MOT chamber. These will slow the atoms down to some 10 m/s before they will enter the actual MOT from which they will be either launched or dropped into the interferometer zone.
Figure 3.3: Principle and photo of 10m atomic fountain experiment in Wuhan [Zho11]
Unfortunately, no data of the performance of the Wuhan fountain have been published so far. However, measurements of the tidal phenomena and gravity measurements with a resolution of 4.5 × 10⁻⁹ g for integration over 1.8 s have been demonstrated in [Zho11]. The slightly larger interferometer zone might enable interferometer times of up to 2.6 s (T = 1300 ms) as proposed in [Zho11] and therefore might also exceed the accuracy of the Stanford fountain. Although the performance of the lab-based fountains is outstanding and they have the advantage of their high repeatability, they occupy whole buildings. The vacuum chamber and shielding of the Stanford apparatus for example has a volume of more than 10 m3 . Due to the large volume and the material needed the cost are comparable to space missions, but still limited by systematic effects (as e.g. magnetic field inhomogeneities and gravity anomalies) as given in [Kas13]. These limits might be overcome by future space missions in absence of gravity and vibrations as proposed in [Lei13].
STATE OF THE ART
36
3.2 I.C.E The I.C.E. (Interférométrie Cohérente pour l’Espace) collaboration is performing experiments and measurements with atom interferometry under microgravity on parabolic flights. The consortium has designed an atom interferometer for inertial sensing aboard a A300 Zero-G [Nym06]. The apparatus is operated with a mixture of 40 K and 87 Rb. I.C.E Volume Weight Atomic species Platform Microgravity time Interferometer time (2T) Sensitivity (Δg/g)
≈ 6 m3 800 kg 87 Rb & 40 K Airbus A300 Zero-G 20 s 150 ms 8 × 10⁻⁸ (*)
Table 3.2: Key parameters of I.C.E. experiment aboard the Airbus A300 Zero-G (*targeted values for upgrade to MEMS capacitive accelerometer) [Ste09] [Gei11] [Nym06]
As described in 2.1 the plane offers up to 20 s of microgravity resulting in a maximum Raman pulse separation of T = 75 ms [Ste09] due to the challenging environment on the plane. Typically the microgravity quality on the plane is 10−2 g. This enlarges the maximal T from 20 ms on ground to 75 ms on the plane, because of the slowed fall of the atoms. The accelerations aboard the plane vary by up to 1 m s−2 during the microgravity phase [Gei11], which influences the signal output. Instead of isolating the interferometer from vibrations, the I.C.E team measures the vibrations on the reference retro reflection mirror with mechanical accelerometers and correlates them with the interferometer data. The sensitivity of the atom interferometer is therefore limited by the accuracy of the mechanical accelerometers in a usual Mach-Zehnder interferometer configuration. In the setup published in [Gei11] the accelerations have been measured with two accelerometers. The capacitive accelerometer Sensorex SX46020 for frequencies between up to 1 Hz and the piezoelectric IMI626A03 for vibrations in range of 1 - 500√Hz. With this setup the atom interferometer is limited to a sensitivity of 2 × 10⁻⁴ ms−2 / Hz. The use of a MEMS advanced capacitive accelerometer is proposed to increase the resolution to 8 × 10⁻⁸ g per shot [Gei11]. The experiment setup consists of four racks with a total volume of about 6 m3 and a weight of 800 kg consuming 1 kW of power. There are three racks (marked 1 to 3 in figure 3.4a) with support equipment such as lasers and electronics. The centerpiece of the experiment is the physics package (marked with 3) which shelters the vacuum chamber, vacuum pumps, optics and atomic source as presented in figure 3.4b.
I.C.E
37
(a) Overview on ICE atom interferometer (b) View inside the magnetic shield onto the mounted in A300 Zero-G vacuum chamber with optics Figure 3.4: I.C.E. experimental setup aboard an Airbus Zero-G (Copyright: Institut d’ Optique)
The physics package measures 1.2 m × 0.6 m × 0.9 m and is protected from external fields by a single layer magnetic shielding. The scientific chamber consists of a stainless steal trapping chamber (3D MOT) and a collection chamber (2D+ MOT for pre-cooling). The trapping chamber is offering eight 40 mm ports and two 63 mm view ports. Six of the eight ports are equipped with windows to shine in laser light. The other two connect to the pumping system and the collection chamber. As pictured in figure 3.5 the laser light is sent into the trapping and collection chamber without telescopes. Optics such as mirrors and beam splitters are included in the physics package envelope. The MOT and compensation coils are directly wound onto the chamber. The collection chamber is mounted under an angle of 45◦ to the trapping chamber. Both chambers are divided by an orifice and a getter pump to achieve a high differential pressure between both chambers. This will allow high vapor pressure of Rubidium and/or Potassium in the 2D+ MOT to rapidly capture high numbers of atoms but only a low vapor pressure in the 3D MOT to prevent atom losses because of collisions of the trapped atoms with the background gas. Potassium and Rubidium is provided by enriched dispensers directly attached to the collection chamber. The 2D+ MOT uses two pairs of coils to trap and pre-cool these atoms. Because one direction in space is not blocked, an atomic beam will be generated transporting the pre-cooled atoms into the trapping chamber. The flux of atoms can be increased by a push beam which will enter the collection chamber in the free axis pointing towards the trapping chamber. Within the trapping chamber the atoms will be caught in a 3D MOT and subsequently transferred in a far-off-resonance trap (FORT) as preparation for the evaporative cooling. Finally the atoms are cooled below the critical temperature by evaporation.
38
STATE OF THE ART
Figure 3.5: 3D MOT laser beams and setup of the I.C.E. physics package (left); Diagram of the complete I.C.E laser system: DFB, distributed feedback laser diode; OI, optical isolator; PM,phase modulator; FC, fiber combiner; SHG, second harmonic generation; DM, dichroic mirror; PPLN, periodically poled lithium niobate crystal; AOM, acousto-optic modulator (right) [Men11]
The pumping system to maintain the pressure within the trapping chamber is attached to the last remaining port as shown in figure 3.5. The pumping system is positioned with an angle of 45◦ to the floor and suspended to the aluminum profiles surrounding the physics package. The sufficient pumping rates are achieved by a combination of a powerful ion pump and a passive titanium sublimation pump. The light for the magneto optical traps is provided by a robust and stable laser setup of two telecom lasers operating at 1560 nm and 1534 nm. The output of these lasers is amplified and frequency-doubled to generate light at 780 nm and 767 nm, which is needed to cool Rubidium and Potassium. The two lasers are frequency-stabilized on a self-referenced optical frequency comb designed by MenloSystems [Men11]. The laser system as shown in figure 3.5 will provide 200 mW of power in each of the four output ports (Raman 40 K, Raman 87 Rb, MOT 40 K and MOT 87 Rb) supplying the optics of the physics package. The laser system has been operated during flight under vibrations of 0.5 g, accelerations of 1.8 g and temperature fluctuations between 17 ◦C and 30 ◦C without problems. Interferometry has been performed with this setup with 106 atoms at a temperature of 300 nK for Rubidium [Gei11]. Additionally a dual-species magneto optical trap of Potassium 40 and Rubidium 87 a has been demonstrated during a parabola flight in [Men11]. The I.C.E team managed to trap 109 Rubidium atoms simultaneously with 5 × 10⁷ Potassium atoms. The temperature of the Rubidium atoms in the MOT have been measured to be 8 μK, while the Potassium atom temperature was 200 μK.
QUANTUS-1
39
3.3 QUANTUS-1 Motivated by potentially larger times of free evolution of BECs in microgravity the QUANTUS (Quantengase unter Schwerelosigkeit) project was started in 2004 with the objective to create a BEC in a drop tower [vZ10]. QUANTUS-1 Volume Weight Atomic species Platform Microgravity time Interferometer time (2T) Sensitivity (Δg/g)
< 0.66 m3 221 kg 87 Rb Drop Tower Bremen 4.7 s 677 ms N/A (*)
Table 3.3: Key parameters of QUANTUS-I experiment (* N/A because of missing phaselock of laser) [Rud11] [Mun13] [vZ10]
To achieve this goal the instruments needed for the creation of a BEC had to be shrunk to fit into a volume of 0.66 m3 . Although the space is limited and the mass shall not exceed 221 kg, the drop tower at the Center of Applied Space Technology and Microgravity (ZARM) offers not only good microgravity conditions with a quality of better than 10−5 g but also good accessibility with up to 3 drops per day. As shown in figure 3.6 the experiment is mounted into a capsule measuring 0.82 m in diameter and 2.15 m in length. The experiment hardware can fill 0.7 m of the diameter and 1.72 m of the total capsule length. The remaining space is occupied by a data handling system for housekeeping data such as pressure or temperature of the capsule and a selfcontained power supply for in-flight operation of the experiment. When the experiment is set up, the capsule is closed and lifted to 120 m height by a crane. In this position it is supplied with energy and water cooling, while the tower is evacuated to reduce aerodynamic drag and improve microgravity conditions. After evacuation of the tower has been completed, the capsule is released by the scientists experiencing 4.7 s of free fall. Finally the capsule will be recaptured in in a pool of polystyrene balls at the bottom of the tower. During deceleration at the end of the microgravity phase the experiment receives decelerations of up to 50 g. If all instruments inside the capsule are designed and mounted properly and survive the impact, the capsule can be used again without any modifications.
40
STATE OF THE ART
Figure 3.6: CAD drawing of the drop tower facility in Bremen (A), the QUANTUS-I drop capsule (B) and the scientific chamber (C) [vZ10]
QUANTUS-1 is the first apparatus, which has been designed and built by the QUANTUS consortium. It is basically a proof of principle for BEC generation in the harsh environment of the drop tower. Within this first experiment the team managed to minimize all the components necessary to create a BEC in a way that they fit into a drop capsule. This includes all support instruments such as lasers, vacuum pumps and electronics. An upgrade of a Bragg laser module in 2011 enabled atom interferometry as well. Control and data handling of the QUANTUS-1 experiment is performed by a commercial real-time National Instruments PXI computer system. The same system is used for handling of the house keeping data. Both computer systems communicate via WLAN with the control room on ground during the drop. The laser system and electronics have been customized for the experiment to suit the environment in the capsule. The laser system provides light for cooling from three distributed feedback diode (DFB) lasers. Aside from a master laser stabilized on Rubidium 85 transition (2 S1/2 ; F = 3 →2 P3/2 ; F = 4), the system consists of two additional lasers for cooling, re-pumping and detection which are stabilized with respect to the master laser. The cooling light is switched and distributed in a encapsulated module connected to the lasers with fibers. A fourth DFB laser is used to provide light for Bragg interferometry. This laser is red de-tuned by 2 GHz to the 2 S1/2 ; F = 2 →2 P3/2 ; F = 3 transition of Rubidium 87. The light of the Bragg module is switched and distributed by a separate switching module. Subsequently the laser light of both switching modules is guided to the main chamber using optical fibers, which are directly mounted to telescopes collimating and widening the beam to 21 mm in diameter.
QUANTUS-1
41
Figure 3.7: Atomchip schematic drawing with different geometries I,Z & U marked with red, green and yellow color and photo of the atom chip on its copper mount before installation in apparatus
As shown in figure 3.6 C. QUANTUS-1 is equipped with only one experimental chamber loading the atoms from the background gas. The chamber is equipped with 8 con-flat sealed ports. The magnetic coils for the bias field and the magnetic trap are mounted directly to the experiment chamber. Inside the chamber an atom chip (shown in figure 3.7) is completing the setup for the magneto optical trap. The atom chip wires act as "coils", capable of creating different trap geometries to control and manipulate the atoms. The use of atom chips significantly reduces the volume of the apparatus, since they offer the possibility to create high magnetic fields gradients while they consume only little energy. The laser light for the MOT is shone in by two telescopes mounted under an angle of 45◦ to the chip surface and two additional telescopes aligned along the x-axis of the capsule parallel to the chip surface (figure 3.6 C.). The light of the telescopes mounted under 45◦ is mirrored from the atom chip. Therefore no third pair of telescopes is needed to cover all axis in space. The telescopes in x-axis are used for interferometry light pulses as well. The two ports in the y-axis are used for detection of the BEC or interferometer fringes. A light pulse is shone in by a telescope attached to one of these ports and an image will be created on the CCD of the camera attached to the opposing port. The pumping system is connected to the main chamber. It consists of an ion pump, which has been modified by the supplier to survive the high mechanical loads during deceleration. Beside the ion pump a titanium sublimation pump and a SAES getter pump are used to passively getter all atoms but noble gases and methane. All pumps maintain a pressure below 10−10 hPa in the chamber. This chamber and its magnetic coils, as described above, have to be shielded from outside magnetic fields, which vary during the flight. This is achieved by a single layer μ-metal shield.
42
STATE OF THE ART
( )
Figure 3.8: Optimized sequence of the QUANTUS-1 atom interferometer and asymmetric Mach-Zehnder interferometer sequence with asymmetry of δ T [Mun13]
Within 6 years of operation the parameters for BEC creation and the sequence for atom interferometry have been optimized by the QUANTUS-I team. The resulting sequence is shown in figure 3.8. The atoms are captured from the background gas into a MOT using the external fields. These atoms are then transferred to a Chip-MOT, which uses the U-structure on the atom chip. Within this MOT 107 atoms are trapped at a temperature of 200 μK [Bro10]. These atoms are the transferred into an Ioffe-Pritchard trap whereby the Z-structure of the chip is used. Within this step the atom number reduces furthermore to 4 × 10⁶ and the atoms will cool to 50 μK. By evaporation the temperatures will be brought below the critical temperature to approximately 100 nK [Bro10]. The BEC will consist of roughly 1 × 10⁴ atoms. A novel method called delta-kick cooling (DKC) has been implemented within the experiment sequence. To achieve DKC the chip based trap is switched on for 2 ms approximately 30 ms after the release of the BEC from the MOT. This procedure will reduce the remaining thermal energy within the BEC. Thus a temperature of about 1 nK [Mun13] is achieved and the expansion rate is lowered significantly giving access to longer interferometer times. Additionally the atoms are transferred into a non magnetic state to reduce the influence of residual magnetic fields which affect the measurements despite magnetic shielding. This procedure is named adiabatic rapid passage (ARP). This preparation of the atoms for interferometry as described in [Mun13] takes approximately 2.7 s. Subsequently interferometer measurements will start at time T0 . As illustrated in figure 3.8 an asymmetric Mach-Zender interferometer (AMZI) sequence is applied using bragg scattering (ref. section 1.3). Interferometer times of 677 ms have been demonstrated with this apparatus at maximum pulse separation times T of 340 ms.
QUANTUS-2
43
3.4 QUANTUS-2 QUANTUS-2 has been redesigned in many aspects compared to the first generation apparatus with the objective to reduce the volume and increase the performance of the experiment. Most importantly the device will be capable of performing atom interferometry with two atomic species (Rubidium 87 and Potassium 40) simultaneously giving access to tests of the weak equivalence principle (WEP) and investigations on the behavior of quantum gas mixtures in chip-based traps under microgravity. QUANTUS-2 Volume Weight Atomic species Platform Microgravity time Interferometer time (2T) Resolution (Δg/g)
0.38 m3 162 kg 87 Rb & 40 K Drop Tower Bremen 9.2 s 2000 ms (*) 5.6 × 10⁻¹¹ (*)
Table 3.4: Key parameters of QUANTUS-2 experiment (* targeted values) [Mun13] [Rud11] [Her13a]
Further reduction of the experiment volume will allow usage of the catapult mode of the drop tower. This nearly doubles the time of microgravity and thus the time for experiments. A short capsule offers 0.98 m in length and 0.7 m in diameter for payload hardware. Obviously the increase in hardware due to the upgrade to dual species operation is contrary to the aim of reducing the size of the whole apparatus. Moreover operation in catapult mode requires the instruments to operate reliably even during the 30 g shock at launch. Despite those limitations the design of QUANTUS-2 meets all objectives for catapult mode operation. As illustrated in figure 3.9 the apparatus can be divided into four sections each one mounted on an individual aluminum board with a wood core, which is attached to the stringers of the capsule. The laser system is placed on the top board. On the two boards below, all electronics necessary for operation of the experiment is arranged around the vacuum pumps. These pumps need to be situated outside of the magnetic shielding, because of its strong magnets. Protected by a two-layered magnetic shielding the experiment chambers are mounted onto the last experiment board. At the very bottom of the capsule default drop tower interface systems are stored. These are the PXI system for data handling of the housekeeping data as well as DC-DC converter and customized lithium iron phosphate (LiFePO4 ) light-weight batteries. These batteries have replace the standard lead-acid batteries and save weight and space, which will add to the weight and volume available for the experiment. The vacuum and experiment chamber has been redesigned completely. Contrary to the QUANTUS-1 experiment, a 2D+ MOT is used in its successor to pre-cool the atoms as it has already been described in section 3.2.
STATE OF THE ART
44 700mm
2065 mm
980 mm
Laser System
Electronics, PXI, Vacuum Pumps
2D+ MOT
Experiment Chamber Magnetic Shielding Science Chamber ZARM Systems
Figure 3.9: CAD Drawing of the QUANTUS-2 experiment with different subsystems and a foto of the science chamber within the μ-metal magnetic shielding (adapted from [Her13a])
Both chambers are manufactured from grade 5 (Ti6Al4V) titanium, which is considered highly nonmagnetic and of low magnetic susceptibility. This will reduce time varying residual magnetic fields within the shielding. As illustrated in figure 3.10 the 2D+ MOT offers four rectangular optical ports for 2D MOT beams distributed over the four sides of the chamber. One of these ports is slightly larger to shine in the retarder beam. An additional circular port at the back of the chamber provides access to the pusher beam. The 2D+ MOT is connected to the science chamber by an aluminum tube, which should absorb loads, which will apply during launch and deceleration by elastic deformation. At the exit of the 2D+ MOT chamber a differential pumping stage will ensure that only the concentrated atomic beam will leave the pre-cooling chamber and the background pressure in the science chamber will remain at a low level. The principle of the differential pumping stage will be described in section 7.3. Aside from the mechanical port for access to the 2D+ MOT, the science chamber uses a second mechanical port behind the atom chip to connect to the pumping system. This is achieved using commercial con-flat (CF) sealed components made from stainless steel. Moreover the science chamber is equipped with seven 30 mm and one 86 mm view ports. In both the main chamber and the 2D chamber a different sealing technology has been used to reduce the size of both chambers. Adhesive indium wire is used to mount the windows directly into the associated pockets in the chamber by applying pressure to the window and compressing the indium wire.
QUANTUS-2
Potassium
45
Rubidium
Y Rubidium & Potassium Master Laser
X
Figure 3.10: CAD drawing of QUANTUS-2 laser system for Potassium and Rubidium and experiment chamber with different laser beam paths (adapted from [Her13b])
The use of the different ports is presented in figure 3.10. The laser light for 3D trapping is shone in through the 86 mm view port in front of the atom chip under an angle of 45◦ and through the two smaller ports on the side of the chamber along the x-axis. Similar to the setup in QUANTUS-1 the light is mirrored at the chip surface to complete the 3D MOT setup. Orthogonally to the beams from the side the interferometer beams are directed along the y-axis. The seventh port is used for the absorption detection and will create a shadow image in a CCD camera connected to the opposite view port. Additionally a second camera is mounted between the coils facing the chip surface. This camera will take fluorescence images of the atoms. The associated three pairs of coils are set up in Helmholtz configuration. The pair of coils creating a field in z-direction are wound directly onto the titanium chamber, while the coils for y- and x-fields are mounted to the chamber. The rectangular coils of the 2D+ MOT are wound onto aluminum bodies screwed to the 2D+ MOT chamber. These coils form the magneto optical trap in combination with the atom chip inside the experiment chamber. The chip is mounted onto a solid copper mount to ensure that the produced heat is conducted properly. The chip consists of three different structures as shown in figure 3.11 which decrease in conductor diameter and are mounted to each other with UHV suitable glue. While the lowest layer consist of mesoscopic structures (1 mm copper wire), the science and the base chip are fabricated from aluminum nitrate substrate with printed circuits made of gold. The chip layers are capable of forming various trap geometries with different distances of the trap bottom to the chip surface. Additionally a RF antenna is included in the chip setup to apply RF signals during evaporation.
46
STATE OF THE ART
Science Chip (50 μm structures) Base Chip (500 μm structures)
Cooper Mount Mesoskopic structures (1mm wire)
Figure 3.11: QUANTUS-2 science chamber with atom chip (adapted from [Her13b])
The laser system is especially designed by the Humboldt University of Berlin to withstand the loads of the catapult launch. It provides light with a wavelength of 767 nm and 780 nm for trapping and manipulation of Rubidium and Potassium. As illustrated in figure 3.10 the hardware itself consists of three parts: two master lasers stabilized on Rubidium and on Potassium transitions and a mixing and switching module for each species. The mixing module includes three master oscillator powered amplifier (MOPA) lasers, which are stabilized on the associated master laser. These modules will provide light for trapping and interferometry of both atomic species. The vacuum pressure is maintained by two pumps. An active ion getter pump custom-made by VinciTech and a passive getter pump from SAES. These pumps maintain a pressure of 6 × 10⁻¹⁰ hPa, which is sufficient for BEC experiments. The pressure is monitored by a cold cathode gauge (Pfeiffer IKR270). The current drivers for coils, atom chip and laser as well as the temperature and vacuum pump controllers are an ultra-compact customized PCB design developed by the University of Hanover. Since these components are a lot smaller than commercial parts, this saves a lot in space and weight. QUANTUS-2 is able to load its Rubidium 3D-MOT with an atomic flux of 1.4 × 10⁹ atoms per second. The atoms are then held in a 3D MOT using the mesoscopic U-structure of the atomchip and the external coils. A 3D-chip MOT with 2.5 × 10⁹ atoms has been demonstrated in this apparatus [Her13a]. Subsequently the atoms are transfered in a compressed MOT (cMOT) and prepared for evaporation. The largest BEC observed after evaporation had a size of 4 × 10⁵ atoms at a temperature of 330 nK [Her13b]. As illustrated in figure 3.12 a typical BEC with 1 × 10⁵ atoms can be produced within 1.1 s. Therefore the experiment is faster and provides more atoms in the BEC than its predecessor.
QUANTUS-2
47
Figure 3.12: Sequence for BEC creation in QUANTUS-2 [Her13b]
As a final step of preparation the BEC is transferred into a non magnetic state (ARP) to reduce the influence of residual magnetic fields, as it is done in QUANTUS-1. Unfortunately optimization of the procedures within preparation of the atoms is still ongoing. Therefore there is no data for the performance of the QUANTUS-2 atom interferometer and Potassium MOT available so far. However with the planned implementation of delta kick cooling the apparatus shall allow interferometer times 2T of up to 2 seconds and reach a resolution (Δg/g) of 5.6 × 10⁻¹¹ [Mun13].
Part
II
Payload Environment and Requirements
4
Scientific Objective
The QUANTUS project was initiated in 2004 to prove the feasibility of atom interferometry in space-like environments and to develop and test the necessary technologies.
Figure 4.1: Three generations of QUANTUS experiments (Figure: IQO Hanover)
The project is led by the University of Hanover in cooperation with the University of Bremen, University of Hamburg, Humboldt-University Berlin, Ferdinand-Braun Institute Berlin (FBH), the University of Darmstadt and the University of Ulm. Moreover there are some universities and institutes involved as subcontractors, one of which is the German Aerospace Center’s Institute of Space Systems in Bremen. The QUANTUS projects have the aim to produce outstanding results in the field of atom interferometry and prepare future missions on satellite platforms, which offer the best environmental conditions for atom interferometers (refer chapter 2) and enable a test of the weak equivalence principle with accuracies not reached before [Lei13].
52
SCIENTIFIC OBJECTIVE
During the first project phase (QUANTUS-I) the first Rubidium-87 BEC was created in the microgravity environment of the drop tower Bremen [vZ10]. In the course of the project the sequences for BEC creation and atom interferometry under microgravity have been improved significantly revealing new techniques such as delta-kick cooling (refer section 3.3). Subsequently in the project QUANTUS-II a new apparatus QUANTUS-2 was built, which was designed for the use with the catapult of the drop tower. The second generation of the experiment uses an improved setup (refer 3.4) to achieve higher atom numbers in the BEC and aims at longer interferometer times. Moreover dual species atom interferometry will be investigated and optimized within this experiment. Because of the high accessibility and repeatability in the drop tower, parameter studies can be performed, which prepare mission in space and on sounding rockets. Within the third phase of the project (QUANTUS-III) not only optimization of atom interferometry in the QUANTUS-2 apparatus is addressed, but a new platform of microgravity is accessed - the sounding rocket. The qualification of an atom interferometer experiment for the use on a sounding rocket is a milestone on the way to access orbital platforms such as satellites or the international space station. The MAIUS-1 scientific payload is a technology demonstrator and aims at generating the first generation of BECs in space. As an atomic species Rubidium-87 was chosen in order to benefit from the heritage of the QUANTUS-experiments. The payload is designed to create BECs with performance comparable to the QUANTUS-2 apparatus. In addition to the generation of BECs in space atom interferometry with Rubidium atoms will be performed. This would mark the first BEC-based atom interferometer in space and reach interferometer times of 2T > 2.3 s. The BEC itself is aimed to have temperatures in the pK-regime. These low temperatures would allow for evolution times of multiple seconds. Even more sophisticated experiment sequences with two species and the possibility of testing the Einstein equivalence principle shall be carried out on following missions. For a successful mission the environment during the sounding rocket flight needs to be characterized and the instruments aboard adapted and qualified accordingly. This includes the optimization of the experimental parameters and sequences of the atom interferometer, which might differ from those used on ground or in the drop tower. Additionally an autonomous experiment control has to be implemented and tested, because the experiment has to operate without a continuous tele-command link. An exemplary experimental sequence and the associated requirements for the payload design are given in chapter 6. Within QUANTUS-III the German Aerospace Center’s Institute of Space Systems is responsible for the thermal and mechanical design of the scientific payload and the qualification of the experimental hardware for the use on a sounding rocket. The results of this contribution are presented in this thesis.
5
Launch Vehicle and Flight Environment
The MAIUS-I vehicle consists of the payload and the two-staged rocket motor assembly. By definition the payload includes not only the scientific payload(s), but also multiple support systems as shown in figure 5.1. The motor adapter is mounted above the two-staged VSB-30 motor combination, which measures 0.559 m in diameter and 7.4 m in length. The conical adapter will reduce the hull diameter to 500 mm on a length of 378 mm. The adapter is mounted to the de-spin and payload separation system. It will guarantee the separation of motor and payload and will remove rotations. The de-spin system is connected to the scientific payload by a manacle ring and a manacle adapter. Item VSB30 Motor Assembly Motor adapter De-spin and separation Manacle Adapter Scientific Payload Service Module ACS Recovery system
Mass [kg]
Length [m]
Diameter [m]
2265.1 8.7 25.2 7.3 280 53.5 31.2 55.5
6.638 0.378 0.123 0.187 2.790 0.500 0.125 1.102
0.559 conical 0.500 0.500 0.500 conical 0.438 conical
Table 5.1: MAIUS-1 mass and geometry overview
The scientific payload itself consists of 5 hull segments with a diameter of 500 mm. The mass of the payload is approximated with 280 kg. The service system is situated above the payload. The service system hull is of conical shape and is reducing the diameter from 500 mm to 438 mm on a length of 500 mm. At the top the European Recovery System (ERS) and its parachute is situated below the nose cone. The total vehicle as shown in figure 5.1 has a length of 11.843 m and a mass of 2726.5 kg.The support systems are designed and operated by DLR’s Mobile Rocket Base (MORABA) and will be described briefly in the following sections.
LAUNCH VEHICLE AND FLIGHT ENVIRONMENT
54
ERS Recovery System
Service System and RCS
Payload
MAIUS Science Payload
Motor Adapter & De-Spin System, Manacle Joint opened nd
2 stage ignition system
2nd Stage
S30 Motor, Burn time ~ 29s
2nd Stage Fin Assembly; Tailcan and 3 Fins Interstage Adapter and Spin-Up Motors
S31 Motor, Burn time ~ 15s
1st Stage
st
1 Stage Fin Assembly; Tailcan and 3 Fins
Figure 5.1: Overview of MAIUS-I vehicle [Sta12]
Motors and Spin-Up Motors
55
5.1 Motors and Spin-Up Motors MAIUS-I will be launched with the two-staged Brazilian VSB-30 vehicle. The VSB-30 is a combination of a S31 Motor as first stage and a S30 motor as second stage as shown in figure 5.2. Both motors are filled with solid ammonium perchlorate composite propellant using aluminum as high energy fuel and HTPB as binder fuel.
Figure 5.2: VSB 30 motors in integration hall at Esrange [Sta12]
The first stage motor will create a total impulse of 1.741 MNs and an average thrust of 136.3 kN for 14.6 s. After burn-out the first stage will be separated and the second stage will be initiated by an independent ignition system. It will create an additional total impulse of 2.332 MNs and an average thrust of 103.7 kN for 29.5 s [Sch]. The vehicle is spin-stabilized during the entire propelled flight to compensate possible misalignment of the motor nozzle. The fins will be arranged in the standard canted 3-fin configuration with a nominally angle of 18’ (S31) and 24’ (S30). This will cause the vehicle to spin from lift-off through burnout. This "passive" spin up will be supported by three spin up motors situated at the interstage between the motors, which will be ignited 0.7 s after the vehicle has left the rail of the launch facility. Altogether fins and spin up motors will cause the vehicle to spin with a nominal rate of 2.71 Hz around its longitudinal axis.
LAUNCH VEHICLE AND FLIGHT ENVIRONMENT
56
5.2 Motor Adapter and De-Spin System The payload is connected with the motors by the motor adapter, which is a conical shaped mechanical part reducing the diameter from 557 mm to 500 mm. Above this adapter the de-spin and separation module is mounted. Figure 5.3a shows the module of MASER-12, which is similar to the one which will be used on MAIUS. For de-spin a yo-yo system is used, consisting of two masses which are placed opposite to each other on the hull of the module. These masses are attached to the payload by steel cables wound onto the hull as indicated in figure 5.3a. At de-spin the masses are released and the cable will unwind from the hull decreasing the angular velocity of the payload. If the cable is unwound completely the masses will be detached from the payload. By adjustment of the de-spin weights at a given length of the cable, the angular velocity will be decrease to ±30 ◦ /s within one second [Sta12]. 6
2
4
P500,00
Manacle Adapter
5
Manacle Ring
1 378,00
Motor Adapter
3
501,00
688,00
De-Spin and Separation
P559,00
(b) De-spin system, motor and manacle (a) MASER-12 de-spin module with interface adapter assembled with manacle ring in MAIUS to payload by manacle flange (1), pneumatic configuration. The scientific payload will be manacle ring opener plunge (2), Tungsten de- mounted to the manacle adapter. spin weight (3), 2 nitrogen gas bottles for plunge operation (4), three pneumatic payload separation plunges (5) and interface to motor adapter (6). [Sta12] Figure 5.3: De-spin and separation system
After de-spin the second stage motor has to be separated from the payload. This is done by opening a manacle ring, which connects the manacle adapter and the de-spin module. Subsequently the motor and the de-spin system is pushed away by actuation of pneumatic separation plunges.
Service System and ACS
57
5.3 Service System and ACS The service module will manage and monitor the housekeeping and flight performance data of the rocket such as position, speed or acceleration. Furthermore it will establish bidirectional communication between the sounding rocket and the ground station to transmit flight parameters or experiment data. For this purpose the service system is equipped with several antennas and a telemetry system, which will obtain a data connection during flight with a downlink data rate of 5 Mbit/s and an uplink data rate of 38.4 kbit/s. Due to the fact that the uplink might be interrupted during flight the experiment has to operate autonomously as already mentioned above. The service system provided for MAIUS-1 is a prototype, developed by DLR MORABA especially for this payload. The housing was re-designed to be a conical adapter between the 500 mm hull segments of the payload and the 438 mm structure of the attitude control system (ACS) and the European recovery system (ERS) as shown in figure 5.4. Moreover the experiment interfaces has been extended by four 100 Mbit/s Ethernet ports. These will add to four bi-directional RS-422 interfaces. DMARS S-Band Antenna
P438,00
500,00
GPS Reciever
GPS-Antenna
P500,00
Figure 5.4: MAIUS-1 service system equipped with a DMARS inertial platform, GPS receiver, 6 antennas for communication and a GPS wrap-around antenna
Most importantly the service module has been equipped with a DMARS inertial navigation and flight control System and a GPS module to determine not only the rates of the rocket but also the position with high accuracy. This is necessary to align the interferometer measurement axis to the local gravity vector of earth as required in future MAIUS experiments (refer section 6.3).
LAUNCH VEHICLE AND FLIGHT ENVIRONMENT
58
Adjustments of the attitude and rates will be commanded from the service module to the two-staged cold gas steering system of the attitude control system. As shown in figure 5.5 the steering system comprises 8 nozzles, which are aligned to provide thrust either in roll, yaw or pitch direction. Single Thruster
P438,00
Three Thruster Assembly (Nozzles and Valves)
Gas Tanks (2x2l) 125,00 243,00
Pressure Regulator
Figure 5.5: Attitude and rate control system
The nozzles will be supplied with gaseous Nitrogen by valves. The movement of the payload is controlled by the length of the thrust pulses. Overall the advanced ACS will be able to reduce the angular rates to 0.03 ◦ /s during microgravity phase and control the attitude with an accuracy of 0.1◦ .
European Recovery System (ERS)
59
5.4 European Recovery System (ERS) The European Recovery System (ERS) is mounted to the upper end of the MAIUS vehicle. It consists of two parts: the upper and the lower nose cone as shown in figure 5.6. Lower Nose Cone (electronics, parachute)
Nose Tip
Upper Nose Cone
Figure 5.6: European Recovery System (ERS) [Sta12]
The outer structure of the upper nosecone is made of AlMg1 aluminium alloy with an average wall thickness of 2.25 mm. The cone radius is 3922 mm and the nose tip radius 110 mm. For heat protection the complete upper nosecone is coated with a cork heat shield Airbus Defence and Space NORCOAT HPK, which is protecting the structure from the high thermal loads during ascent. At an altitude of 70 km, when the ascent through the lower atmosphere has been completed, the upper nose cone is detached from the vehicle by releasing the manacle ring. After release the upper nose cone is ejected from the vehicle by pyrotechnically actuated plungers. Below the upper nose cone at the top of the lower part of the recovery system a second heat shield will protect the parachute from hot gases during re-entry. The hull of the lower nose cone is made of an 6 mm nickle-coated aluminum alloy. It accommodates the parachute recovery system, two redundant battery packs to supply the ERS and a set of electronics in the back of the lower nose cone. This electronic includes a barometric system for determination of the vehicle altitude, the ignition unit for the pyro actuators and acceleration sensitive g-switches as well as a lift-off switch for system initialization. The parachute will be activated at an altitude of about 4.6 km and will decrease the descent velocity to about 8 m s−1 to 10 m s−1 .
LAUNCH VEHICLE AND FLIGHT ENVIRONMENT
60
5.5 Time Event List of MAIUS-1 The time event list given in table 5.2 is summarizing all major flight events during the MAIUS-1 mission. For simplicity some of those are also visualized in figure 5.7
260 km | Apogee
Attitude Control Begin of Experiment Sequence
2 optional sequences for attitude control
End of experiment sequence Beginn of re-entry
100 km | Beginn of microgravity om fer er
Int
Motor/Payload & nosecone separation
r ete
75 km |
is Ax
RCS Spin Up Re-entry mode
60 km | Burn Out 2nd Stage YoYo De-Spin
Chute Activation + Recovery Phase
gravity
5 km |
Figure 5.7: Illustration of flight events during MAIUS-1 mission. The payload is orientated along earth’s gravity vector during the microgravity phase.
On the right hand side of figure 5.7 the launch configuration with the systems described in the section above is shown. This configuration will be maintained until the vehicle reaches an altitude of 4.3 km. At this time the first stage S30 motor will burn-out. Since there is no axial connection between the two stages (pin connection), the first stage will separate passively from the second stage and the payload due to the aerodynamic drag. 1.5 s after the burn out off the first stage second stage will be ignited. The second stage will lift the payload to 43.4 km in altitude. While the motor is still attached to the payload, the YoYo-despin will be carried out at an predicted altitude of 64.9 km. The nosecone will be separated from the payload shortly after the de-spin is completed. Subsequently the burned-out motor will be separated from the payload, which will continue its ballistic trajectory as shown in figure 5.7. Next the attitude control system (ACS) will minimize the remaining spin of the rocket to 0.03 ◦ s−1 . Simultaneousley the ACS will acquire the desired attitude of the vehicle. To be able to perform measurements for testing the weak equivalence principle or measurements of earth gravity field, the interferometer axis will be aligned to the gravity vector of the earth. Although this is not mandatory for the first flight, the attitude control should demonstrate its accuracy in MAIUS-1.
Time Event List of MAIUS-1
No.
Time
Altitude [km]
1 2 3 4 5 6 7 8 9 10 11 12 13 14 15 16 17 18 19 20 21 22 23 24 25 26 27 28 29 30 31 32
T-120 min T-25 min T-25 min T- 5 min T- 5 min T+ 0.0 T+ 0.0 T+ 13.5 T+ 15.0 T+ 44.0 T+ 55.0 T+ 56.0 T+ 58.0 T+ 60.0 T+ 61.0 T+ 75.0 T+ 91.0 T+ 180.0 T+ 190.0 T+ 260.0 T+ 300.0 T+ 310.0 T+ 446.0 T+ 448.0 T+ 468.0 T+ 487.0
0.33 0.33 0.33 0.33 0.33 0.33 0.33 4.30 5.00 43.40 64.90 66.79 70.56 74.29
T+ 900.0 T+1000.0
101.02
258.30
100.00 97.40 60.93 27.00 4.70 3.9 2.9 1.7
61 Event P/L Checkout Possible Hold Switch from Hardline to RF Switch to internal power supply Quantus Switch to internal power Lift-Off Quantus LO (Signal and Bit) Burnout 1st Stage (S31) Ignition 2nd Stage (S30) Burnout 2nd Stage (S30) YoYo De-spin GPS Antenna Switch Nosecone Separation Motor/PL Separation MAIUS ACS On (Bit) Begin of microgravity phase MAIUS ACS Off (Bit) MAIUS ACS On (Bit) MAIUS ACS Off (Bit) Apogee MAIUS ACS On (Bit) MAIUS ACS Off (Bit) Begin of Atmospheric Re-entry RCS Re-Entry Detection Mode Re-Entry Mode, Spin-Up by RCS Maximum Deceleration Heat shield, Stab Chute & Beacon Activation Stab Chute De-Reefing Main Chute Activation Main Chute De-Reefing Power Off for Experiments Power Off TM/TV
Table 5.2: MAIUS-1 time event list
For the following 355 s different experiment sequences will be run autonomous as described in section 6.3. In between there are two time frames of 10 s foreseen to correct the attitude and the rates of the payload if necessary. One of which is before the apogee at the ascent and one at the descent. At an altitude of 100 km, the experiment and microgravity phase will end and the payload will be aligned with the vertical axis parallel to the atmosphere.
LAUNCH VEHICLE AND FLIGHT ENVIRONMENT
62
Afterwards the payload will switch into re-entry mode. The rate control system will spin up the payload to distribute the thermal loads during re-entry equally over the hull surface. At an altitude of approximately 5 km the stab parachute will be activated. The stab chute activation will be followed by the main parachute activation at an altitude of roughly 3 km. The main parachute will return the payload safely to the ground. This last phase of the flight is called recovery phase. The mechanical, thermal and magnetic environment related to the flight events described above will be discussed in the following section. This will characterize the environment aboard the sounding rocket. In combination with the requirements given in section 6 these represent the necessary information for the design of the payload.
5.6 Mechanical Environment The vibrations and accelerations acting on the payload are the major factor of influence on the mechanical design. Unfortunately the mass of the payload will influence the actual mechanical environment. In the following predictions and estimates of the rates, vibrations and accelerations for a payload of 400 kg shall be discussed.
5.6.1 Ascent
2000
260
1500
200
Altitude in km
Velocity in m s−1
It is important that the instruments will have full functionality after the occurrence of accelerations, otherwise no scientific output will be generated and the mission has to be considered a failure. In the following the expected mechanical loads due to motor burn or spin are summarized.
1000 500 0
150 100 50 0
0
200 400 Time in s
600
0
200 400 Time in s
600
(a) Predicted velocity of MAIUS-1. The peak (b) Predicted altitude of MAIUS-1. The velocity is going to be 2033 m s−1 at 41 s after apogee is expected to be 260 km and is reached launch. 260 s after lift-off. Figure 5.8: Predicted trajectory and velocity of MAIUS-1
Mechanical Environment
63
Figure 5.8a shows the nominal trajectory for the MAIUS-1 flight. At a mass of 400 kg the vehicle is predicted to achieve an altitude of 260 km, which equates to a microgravity time of 355 s above 100 km. The velocities and accelerations on this trajectory are presented in figure 5.8b and 5.9. Motor ignition will generate shock loads of approximately 20 g acting on the payload for 15 ms [Sch]. The rocket will accelerate from zero to MACH 1 within 7.9 s. The maximal velocity of 2033 m s−1 will be reached after just 41 s in an altitude of 38.3 km. Respectively the accelerations caused by the rocket motor are strong. The gap after 10 s of flight represents the separation of first and second stage. The peak acceleration is marked in figure 5.9b with 12.4 g. It will be reached after 35 s and represents a critical phase, since the loads acting on the payload will reach its maximum before experiment operation. While figure 5.9b shows the predicted steady accelerations, figure 5.9a presents the vibrations recorded during the test flight of the VSB-30. The vibration loads inside the payload were measured by a hard mounted 3 axis accelerometer, with a measurement range from 15 Hz to 10 000 Hz. The accelerometer was attached to the deck of the instrumentation module used in the test flight.
Long. Lat.
1.5
Acceleration in g
Vibration Level in g RMS
2
1 0.5
Long. Lat.
10
5
0 0
0
10
20 30 Time in s
40
(a) Longitudinal and lateral vibrations measured on VSB30 test flight [Sch]. Peak accelerations in both direction is 1.8 grms (longitudinal at lift off and lateral at 16 s respectively
0
20
40 60 Time in s
80
100
(b) Measured longitudinal and lateral accelerations of TEXUS-44 during ascent. The peak acceleration along the long. z-axis is 12.4 g at 36 s
Figure 5.9: Measured vibrations accelerations during ascent
The data has been evaluated for 15 Hz and 2000 Hz, calculating the root mean square (RMS) in this frequency range in slices of 1 second. The maintained data points for the vibration root mean square are plotted over the flight time in figure 5.9a. The results show that the integrated RMS value does not exceed 2 grms , which is significantly below the test parameters as presented in section 8.
LAUNCH VEHICLE AND FLIGHT ENVIRONMENT
64
Aside from vibrations and accelerations, the rotation of the payload, which is induced by the fins and the spin up motors will add up to the total loads during ascent. As illustrated in figure 5.9b the maximum lateral acceleration is caused by the rotation around the z-axis. The rate will be 2.71 Hz and will be reached roughly 40 s after lift-off. The rocket hull has a diameter of 500 mm and a wall thickness of 5 mm. Thus the maximum centrifugal acceleration inside the payload can be calculated from acent = ω 2 r
(5.1)
With a given radius from 0.245 m and a spin rate of 2.71 Hz the maximum acceleration is 71.05 m s−2 or 7.24 g. Other than the accelerations caused by the motor, these loads act radial to the payload, which has to be considered in the design phase of the payload. Table 5.3 summarizes all loads applicable for the design and qualification of the experiment and the structural parts. The loads are given for the ascent as well as for the descent loads described in the following chapter. Event
Begin
Motor ignition Motor acceleration (DC) Motor acceleration (AC) Spin Re-entry Touch down
0 0 0 0 480 0
Duration
level
Shock ( 15ms) 20g < 44s max. 12.4g < 44s < 2g RMS < 55s max. 7.24g < 40s Shock ( 15ms)
20-25g 100-200g
Table 5.3: Overview on loads during ascent and descent
Mechanical Environment
65
5.6.2 Descent Most experiments want to use their hardware for multiple missions. So does the MAIUS experiment. Although the mission might be considered successful when the experiments have been carried out and the data has been sent to the ground, a safe return of the instruments is desirable. Therefore the experiment and especially the mounting has to be designed to withstands loads of the re-entry as well. x y z
Acceleration in g
40 20 0 −20
480 490 500 510 520 530 540 550 560 570 580 590 600 Time in s Figure 5.10: Deceleration during Re-entry of TEXUS 44
Unfortunately there is no prediction of the loads for the MAIUS vehicle during re-entry available. Figure 5.10 displays the loads of the re-entry of the TEXUS 42 mission. The mission had a similar mass as the MAIUS payload. The accelerations have been recorded by the service module of the payload. As shown in the figure the loads are a factor 2 above those at ascent. Especially within the first seconds of re-entry the atmospheric friction will generate decelerations of 20 g to 25 g. Those occur along the lateral x-axis, since the payload will be aligned to enter the atmosphere with the roll axis perpendicular to the flight direction. Otherwise the aerodynamic drag would be significantly stronger. Shortly before re-entry the payload is spun up to distribute the thermal loads equally on the cylinder walls. As shown in the graph the payload went into a rotation around the x-axis during re-entry. This phenomena is called flat spin. Between T+550s and T+590s, the flat spin rate in the lateral axes reached its peak value of 1.4 Hz. This flat spin caused a maximum centrifugal acceleration of 8 g in the roll axis. In an altitude of roughly 4 km to 5 km at the time T+590s the recovery phase was initiated by stab chute activation which is indicated by 2 strong deceleration peaks in z- and x-axis. During main chute activation two more peaks are recorded. Subsequently the measured accelerations stabilize at 1 g during descent at the main chute. At touch down a strong shock load of 50 g to 100 g [Sch] has to be expected.
LAUNCH VEHICLE AND FLIGHT ENVIRONMENT
66
5.7 Thermal Environment 5.7.1 Pre-flight The integration of the modules and payload is done in an integration room at normal room temperature 20 ± 5 ◦ C. When the integration is completed the payload transported to the Skylark launch tower. Inside the tower the payload will be mounted to the motors. The temperature in the launcher building is controlled to 17±7 ◦ C. The tower is a closed heated building, which protects the payload from the rough outside temperatures which can drop below −40 ◦ C in winter. Shortly before launch the roof and the blast doors are opened and the ambient temperatures might decrease for a short period of time.
5.7.2 Flight The service module of TEXUS 44 was equipped with four PT100 sensors installed on the inner side of the outer hull with an angular separation of 90◦ . The sensors accuracy is given by ±1 ◦ C in the data-sheet. The measured data is shown in figure 5.11. Two of the sensors failed after 55 s and no more data was recorded. 0◦ 90◦ 180◦ 270◦
Temperature in ◦C
200 150 100 50 0 0
100
200
300
400 Time in s
500
600
700
Figure 5.11: Temperatures during flight of TEXUS 44
The TEXUS 44 payload was heated during ascent by aerodynamic friction to roughly 100 ◦ C. In chapter 10 the impact and prediction of aerothermal heating during ascent will be studied in more detail. Within the microgravity phase the temperatures decreased due to radiation into space. During re-entry the hull elements were affected by aerothermal heating once more. Due to the new angle of attack and the absence of an ablative layer, the hull of the TEXUS service module was heated to more than 200 ◦ C.
Magnetical Environment
67
5.8 Magnetical Environment 5.8.1 Pre-flight EGiS is an information service for data from Esrange’s scientific instruments. This includes a magnetometer measuring the deviation of the earth magnetic field in North/South, East/West and Z directions.
Figure 5.12: Magnetic field at Esrange obtained from EGiS database (http://egis.esrange.ssc.se/)
Figure 5.12 shows recorded data of the magnetic field at Esrange on October, 5th 2015 between 0800 and 1100 hours UTC. As depicted the magnetic environment only deviates in small amounts during a typical launch window (three hours). The deviations might be caused by the large iron ore deposits around the launch site. The strongest deviation recorded in this dataset 350 nT which equals 3.5 mG.
68
LAUNCH VEHICLE AND FLIGHT ENVIRONMENT
5.8.2 Flight Aside from an accelerometer a three-axis magnetometer was mounted inside the TEXUS 42 service module. The data recorded by the magnetometer is shown in figure 5.13.
Figure 5.13: Magnetic fields during the flight of TEXUS-42 [Ett06b]
Since the orientation of the magnetometer inside the payload is fixed and the earth magnetic field vector does not vary, the spin between T0s and T+50s (ascent) and between T+480s and T670s (re-entry) of the vessel is recorded as pseudo high-frequency deviations. In reality the payload is moving (rotating) in an almost constant field. During the microgravity phase (T+70s to T+480s) the payload performs a parabola as predicted in figure 5.8a, which influence the measurement of the local magnetic field. The field in z-direction will change its sign at the trajectory apogee. The lateral magnetic field deviations might be caused by slow rotations of the vehicle. The maximum magnetic field variation of roughly 750mG has been recorded in z-direction (from 300 mG to −450 mG). Although the deviations represents the movement of the vehicle within earths magnetic field and no change of the field itself, the external fields at the BEC location will vary over time during flight. Since the MAIUS experiment is especially sensitive to such time varying magnetic fields, the shielding needs to be designed to protect the MOT chamber by minimizing residual fields in the surrounding of the atoms as presented in section 7.3.1.
6
Payload Requirements
While chapter 1 presented how a BEC is achieved and what instruments are necessary to do so, this chapter will summarize the known requirements of the different (sub)systems of the scientific payload. Aside from mechanical, thermal and magnetic requirements, requirements addressing the payload orientation and thus the launcher are given herein. Comparing these requirements with the given environment aboard the VSB30 sounding rocket as described in chapter 5, will give an estimate on the engineering effort necessary in design and characterization of the environment.
6.1 Coordinate Systems There are only few requirements with respect to the operation or attitude control. The most important requirement on the attitude control is the right alignment of the interferometry axis to the gravitational field of Earth. To define these requirements the coordinate system of the launcher (body frame coordinate system) and of the atom interferometer should be introduced in the following.
6.1.1 Body Frame Coordinate System The body frame coordinate system (BF) is used to define the orientation of rocket components of the entire payload (including the MORABA systems) with respect to each other and to their environment (e.g. the launch tower). Thus this coordinate system is important to guarantee a proper assembly of all payload components. Moreover it is the coordinate system used by the attitude control and service system. Thus flight parameters like acceleration and rotation rates are given with respect to this axis definition. However the measurements of the MAIUS atom interferometer are performed in a different coordinate system as described in section 6.1.2.
PAYLOAD REQUIREMENTS
70
The coordinate system is defined by certain components of the rocket. The origin of the system is located at the interface between the motor adapter and the payload on the cylinder axis of the vehicle. The cylinder (longitudinal) axis is the roll-axis zBF pointing towards the rocket nose cone. The position of the rocket motor fins dictate the pointing of the pitch-axis xBF . This axis is aligned to the 0◦ -fin as shown in figure 6.1b. 0°�Fin�No.1
0°
RAIL
Umbilical�355° Umbilical�340° Cable�Tunnel�330°
x,�Pitch
RAIL
60°
y,�Yaw
270° z,�Roll
24 0°�
Fin �No .3
Cable�Tunnel�150°
180°
RAIL
(a) Nomenclature of axes, angular velocities and (b) Coordinate system orientation with roll-momentums respect to fins and launch tower rails Figure 6.1: MAIUS bodyframe coordinate system
The yaw-axis yBF is completing a right-hand coordinate system. The associated angle velocities in the BF-system are named p, ˙ q˙ , r˙ as shown in figure 6.1a. The same applies to the roll-momentum L, the pitch-momentum M and the yaw-momentum N. All drawings of the MAIUS systems and components respect these axis definition and are clearly indicating the position or orientation of each component. Thus also the orientation of external components as umbilical ports or hatches is defined and it is ensured that these can be accessed once payload and motor are assembled in the launch tower. The umbilical ports of the MAIUS payload are located at 355◦ and 340◦ , while the hatch has been placed on the opposite site, with its symmetric line at 120◦ . All features help to identify the axis orientation. In addition to this a "0◦ -mark" has been engraved on each structure elements of the MAIUS payload indicating the x-axis alignment.
Coordinate Systems
71
6.1.2 Experiment Coordinate System As previously mentioned the measurements of the atom interferometer are performed in a different coordinate system. This system is defined by the atom chip and the magnetooptical setup of the MAIUS payload. z_bf = -y_exp
A:
x_bf 30° (orthogonal to chip surface) z_exp
40,8 3°
0°
355° (Umbilical 1) 340° (Umbilical 2)
° 30,23
y_bf 3,50
x_exp
y_bf = x_exp 120° (Center of Hatch) (Interferometer Axis)
2,04
A
1983,50
B
B-B ( 1 : 3 ) z_exp
x_exp Interferometer Axis
Interferometer Axis
B y_exp
y_exp
Figure 6.2: Drawing of the MAIUS-1 scientific payload and atom chip with bodyframe and experiment coordinate system axes and orientation of interferometry axis
The origin of the experiment coordinate system is defined to be in the center of the atom chip on the surface of the upper (mirror) layer. As illustrated in drawing 6.2 the zexp -axis is pointing away from the chip surface. This axis is rotated by 30.23◦ to the xb f -axis as defined in section 6.1.1. The yexp -axis is pointing towards the rocket motor. Thus it is opposing the zb f -axis. The xexp -axis is completing a right-hand coordinate system. Although the experiment chamber is aligned to have its center in the cylinder axis of the payload, the atom chip surface is not positioned in the center of the chamber, since this is the place were the atom ensemble should be. Thus the origin of the experiment system is shifted with respect to the origin of the bodyframe system in all three dimensions. The bf position of the origin of the experiment system in body frame coordinates is x0 = −3.50, bf bf y0 = −2.04 and z0 = 2153.50.
72
PAYLOAD REQUIREMENTS
6.2 Operational Requirements The MAIUS mission is expecting 360 s of micro gravity, if the scientific payload mass will not exceed 280 kg. Although the MAIUS-1 mission is considered a technology demonstrator and no measurement campaign, it is essential to proof the feasibility of a precise alignment of the interferometer axis to the local gravity vector of Earth. Figure 6.2 does not only show the different coordinate system axis, but also the interferometer axis as it is aligned in MAIUS-1. With the given angles the vector of the interferometer axis is defined to be ⎛ ⎞ ⎛ ⎞ sin(40.83) cos(59.77) 0.3292 � = ⎝ sin(40.83) sin(59.77) ⎠ = ⎝ 0.5649 ⎠ M (6.1) cos(40.83) 0.7567 in body frame coordinates. With a known position of the payload an alignment of this vector can be achieved with the attitude control system. The required accuracy of the axis alignment and residual angular rates strongly depending on the interferometer scheme. A five-pulse-interferometer scheme will allow to perform long-time interferometry at rotation rates as high as 0.3◦ /s (0.005 rad/s) [Sei14]. Unfortunately this scheme is insensitive to acceleration. Thus it is not suitable to measure earth gravitational field or carry out investigations on the universality of free fall. For this reason the alignment accuracy is not a limiting factor for performance of the experiment. Measurements to e.g. determine the local gravitation acceleration would require a MachZehnder interferometer scheme, which is not only sensitive to accelerations, but also to rotations. Thus the rotation rates of the payload would need to be reduced to 1 × 10⁻⁵ rad/s for a pules separation time T of 5 s [Sei14]. This is hard to achieve on a sounding rocket, thus MAIUS-1 will only be able to achieve significantly smaller pulse separation times in the order of T = 50 ms. According to MORABA the alignment of this vector to the local gravity vector can be achieved with an accuracy of ±1◦ ., which is sufficient for experiments planned in MAIUS1. The alignment should be demonstrated in the first flight of the MAIUS payload by performing one attitude acquisition at T+61s. The attitude will not be controlled during microgravity phase. As stated above residual angular rates are required to be below 0.3◦ /s. Thus the threshold of the rate control system is set accordingly. In former flights the cold gas system had to be activated at least once to correct the rates. Thus two slots for correction of the angular rates are foreseen in the MAIUS-1 experiment sequence as listed in table 6.1.
Experimental Sequence of MAIUS-1
73
6.3 Experimental Sequence of MAIUS-1 Within the MAIUS-1 mission a complex set of experiments has to be performed. Due to the lack of gravity the optimal experiment or sequence parameters (e.g. the evaporation end-frequency), which have been determined on ground might change. To produce good and reliable results these parameters have to be optimized for microgravity in flight. For this purpose the complexity of the sequences will be increased step-wise as listed in table 6.1. This table serves as a guideline, in order to estimate the repetitions and time necessary to optimize the parameters starting from the lab-optima. A sequence player developed by the German Aerospace Center Brunswick will run the sequences and decide autonomously from the measured data how to proceed. Thus the actual duration and repetitions of some steps might differ from what is stated here. Time T+ 0.0 T+ 55.0 T+ 60.0 T+ 61.0 T+ 75.0 T+ 91.0 T+ 92.0 T+ 107.9 T+ 113.5 T+ 129.0 T+ 144.8 T+ 160.5 T+ 180.0 T+ 190.0 T+ 191.0 T+ 260.0 T+ 191.0 T+ 300.0 T+ 310.0 T+ 311.0 T+ 446.0
Duration
Rep.
1.06 1.11 3.11 3.15 3.15 3.11
15 5 5 5 5 5
3.11 - 3.6
17
3.7 - 4.1
17
3.11 - 4.6
34
Event Lift-Off YoYo De-spin Motor/PL Separation MAIUS ACS On (Bit) Begin of microgravity phase MAIUS ACS Off (Bit) Optimization molasses Optimization transfer to magn. trap Optimization evaporation Optimization decompr. of trap / DKC Determine trap frequencies Optimization ARP MAIUS ACS On (Bit) MAIUS ACS Off (Bit) BEC TOF 10 ms to 500 ms Apogee BEC TOF 600 ms to 1000 ms MAIUS ACS On (Bit) MAIUS ACS Off (Bit) Atom Interferometry T 10 ms to 1500 ms Begin of Atmospheric Re-entry
Table 6.1: MAIUS-1 proposed experiment sequence
Nevertheless the optimization steps remain the same. At the beginning the atom number in the magneto-optical trap and the temperature of the optical molasses (sub-doppler cooling) described in section 1.2.1 and 1.2.2 has to be optimized.
74
PAYLOAD REQUIREMENTS
Once a certain threshold is achieved the algorithm will proceed to optimize the transfer into the magnetic trap to prepare the atoms for evaporation. Subsequently the evaporation itself will be optimized to achieve an optimal number of atoms in the BEC. The evaporation is followed by a the decompression of the trap to reduce the expansion rates of the BEC. The optimization of this process will ensure that the expansion rate of the produced BEC is minimized and the reduction of the atom losses in this phase. This will allow long times of flight (TOF). Delta kick cooling as described in section 1.3 will also be applied to reduce the expansion rate furthermore. The optimization of the adiabatic rapid passage (ARP) will result in BECs with high number of atoms in a magnetically insensitive state. This is important to supress the influence of residual magnetic fields on the experiment. This is the last step before the BEC observation or atom interferometry will be performed. Within the experiment sequence two rate and attitude control (ACS) slots are foreseen. Within this 10 s interval the ACS will check whether the payload rates exceed the control threshold. If this applies the ACS will reduce the rates with the cold gas steering system. Otherwise the experiment sequence will be continued immediately. The experiment sequence aims at completing the preparation steps towards an optimized BEC before the first ACS-slot, which will start at T+180s. After this slot the BEC will be observed for a time of free expansion which is increased in small steps from 10 ms to 1000 ms. This will allow to study the impact of the environment on the BEC and its behavior. This is important to validate simulations and to identify possible sources of disturbances. Both will help to optimize the performance in future missions. Finally atom interferometry will be performed in a five-pulse-scheme, which will allow long interferometer times and in a Mach-Zehnder scheme to measure e.g the residual rotation of the sounding rocket. For both interferometer schemes the pulse separation times will be increased stepwise aiming at times of up to 2000 ms. However it is the objective to gain knowledge on the behavior of an atom interferometer in space and on the influence of this environment on experimental parameters. This will help to prepare future missions in Space.
Mechanical Requirements
75
6.4 Mechanical Requirements In the following the mechanical requirements of the different (sub)systems are summarized. Most of the components used within this payload are customized or designed for laboratory use. These components have not been qualified for the use under vibrational load and no requirements with respect to vibrational loads or static accelerations are given. For this reason the general approach is to qualify every critical component of the MAIUS-1 payload with an individual vibration test. The component level tests have been performed at frequencies between 20 Hz to 2000 Hz with an intensity of 8.1 grms hard-mounted to the shaker as described in section 8. Moreover, a vibration test at 5.4 grms has been carried out with each subsystem of the scientific payload. Thus all components are tested to at least 5.4 grms , which is already above the expected levels of < 3 grms given in section 5.6. Aside from vibrations, strong acceleration are expected during the sounding rocket flight. Thus all parts of the experiment should be designed to withstand accelerations of at least 13 g. This is the expected level of accelerations during ascent of the rocket (refer section 5.6.1). Component Critical components Structure and housing elements Suspension and hull segments All other components
Vibrational loads
Acceleration level
8.1 grms 8.1 grms 8.1 grms 5.4 grms
13 g 50 g 100 g 13 g
Table 6.2: MAIUS-1 mechanical requirements of components
Moreover all structural components are designed to withstand at least 50 g, which is a load that the payload is exposed to in a typical touch-down scenario. The suspension connecting the hardware of scientific payload with the rocket hull and the segments themselves shall withstand accelerations of up to 100 g. This load is expected if the payload lands on rocky ground. A design meeting the requirements above allows to re-use most of the hardware, even in the worst case scenario of landing on rocky ground. The design of the critical components is validated with detailed FEM simulations. The design of structure elements and system housing parts as well as the FEM analysis and tests of those parts is an important part of this thesis.
PAYLOAD REQUIREMENTS
76
6.5 Thermal Requirements Thermal requirements can be obtained from the data sheets or manuals of commercial components. Commonly an operating temperature range and a temperature range for storage is given in the operating conditions section of a manual. For the customized components the temperature requirements are discussed below. Aside from a required temperature range, a maximum temperature gradient during operation may be given as requirement. System / Component
Operating Temperature Storage Temperature Min [◦C] Max [◦C] Min [◦C] Max [◦C]
ΔT [◦C]
Physics Package Electronic Boards Vacuum Chamber Indium Seals
15 15 10
80 100 100
-40 15 10
80 100 100
5 -
15 15 -
70 70 -
0.1 0.01 5
Laser System ≈36 ≈36 26
Laser Module DFB Laser Module ECDL Heat Sink Electronic System Electronic Boards Coil Current Driver LiFePO4 Cells IDAN OBC
15 15 -30 15
80 80 55 80
-40 -40 -40 -55
80 80 60 125
10 -
15 -30
80 55
-40 -40
80 60
-
Batteries Electronic Boards LiFePO4 Cells
Table 6.3: MAIUS-1 thermal requirements of different payload systems and of some critical components. The exact laser module temperature varies for each laser module.
Table 6.3 summarizes the known requirements for some critical systems and their components. The operation and storage temperature of the electronic boards is limited by the melting point of the solder. The only exception is the chip and coil current driver. To avoid a thermal drift the card temperature shall not rise by more than 10 ◦C. The temperature requirements from the battery cells has been extracted from the cell data sheet. The vacuum chamber temperature shall change by more than 5 ◦C during operation. This guarantees reproducible results of the experiment. Moreover the chamber temperature shall not exceed 100 ◦C to ensure the integrity of the indium seals, which melt at 156 ◦C.
Other Requirements
77
The most sensitive components of the scientific payload are the laser modules. They have to be temperature stabilized to a temperature around 36 ◦C with an accuracy of 0.1 ◦C (DFB) or 0.01 ◦C (ECDL). The exact temperature differs from module to module due to temperature dependencies of the components of the laser. To allow the precise control of the laser module temperature, the laser heat sink has to be kept on a temperature of 26 ◦C and shall not rise by more than 5 ◦C. To ensure a reliable operation of these components a thermal control system for the different systems of the MAIUS-1 payload is developed in this thesis. This system shall allow continuous operation on ground and autonomous operation for roughly 500 s during flight.
6.6 Other Requirements Aside from operational, thermal and mechanical requirements, some other restrictions and requirements of the MAIUS-1 payload are given in this section.
6.6.1 Experiment Chamber Geometry As stated in chapter 1 teh experimental performance is strongly depending on the geometry of the trap and thus also on the setup of coils and laser beams. Due to the limited time for design, production and optimization of the MAIUS-1 experiment it was determined that there should be no major changes in the chamber geometry of the 2D and 3D MOT compared to QUANTUS-2. Moreover the spacing between the different coils and their setup, as well as the beam setup should be adopted from QUANTUS-2. This will allow to benefit from the heritage of QUANTUS-2 in troubleshooting and also during optimization of the apparatus.
6.6.2 Magnetic Fields As mentioned in chapter 1 the atoms are sensitive to magnetic fields if they are in a sublevel m f �= 0. In this case variations of the field of the magnetic trap may cause a loss of atoms or restrict the BEC quality. For this reason the intensity of the magnetic field variations should be ΔB(t) ≤ 1 mG [KL16]. With the given environmental conditions aboard the sounding rocket as defined in section 5.8 a maximum variation of ΔB(t) of 750 mg has to be expected. For this reason a magnetic shield with a shielding factor of at least 1000 is required [KL16] to provide some margin to the desired field strength of 1 mG. For measurements of accelerations with an atom interferometer magnetic field gradients cause acceleration noise. For high precision measurement these gradients have to be reduced to values below 3 μG/m [Agu14]. This does not apply for MAIUS, since no highprecision measurements are performed.
78
PAYLOAD REQUIREMENTS
6.6.3 Payload Pressure The laser system and the physics package require a stable and dry atmosphere inside the payload. The pressure should be kept between 0.8 bar and 1.1 bar during the entire flight. This prevents a change of the properties of the optical components and the chamber windows. Such a change might lead to lower optical power and thus a decrease in performance of the atom interferometer. Moreover this will allow to operate all lab equipment without qualification for the use in vacuum. Especially the laser modules would need to be qualified since they are very sensitive to changes in temperature and pressure.
Part
III
Mechanical Design, Simulation and Testing
7
Payload Setup and Mechanical Design
The MAIUS scientific payload outer hull consists of in five segments with an overall length of 2790 mm and a total weight of 280 kg. As shown in figure 7.1 the hull segments shelter five (sub)systems needed to perform atom interferometry. Each subsystem is mounted to an aluminum instrument platform, which is screwed to the rocket structure by mounting brackets equipped with rubber vibration dampers. During flight the scientific payload will be sealed at the bottom and top and pressurized with artificial air at 1100 hPa to guarantee a stable pressure and defined atmosphere as required by the laser system and optics to maintain the optical properties of the components used in those systems during flight. Inside the sealed area the physics package with the UHV pumping system and experiment chamber is situated at the top close to the center of gravity of the complete payload. The physics package consists of two platforms, which are suspended at the top and bottom as one unit. The pumping system is mounted to the upper side of the first platform. Between both platforms the experiment chamber, optics, two cameras and coils are placed inside a three layer magnetic shielding. Below the lower platform the laser system is mounted to ease the connection and routing of the optical fibers. The electronics such as current drivers or temperature controllers are mounted to both sides of an individual platform below the laser system. The onboard computer is attached to the lower cover of the electronic housing. The platform at the bottom of the sealed area carries the batteries on the one side and the power distribution on the other. Both systems, as well as the laser system and electronics are suited into an individual housing and have been equipped with a thermal control system to meet the requirements listed above. For transport the payload can be divided into two parts above the electronics section. The separation flange is marked with "S" in figure 7.1. The two parts of the scientific payload are stored and transported in custom-made flight cases in an upright position.
PAYLOAD SETUP AND MECHANICAL DESIGN
82
Upper Sealing & Umbilicals
11,85 m
Lasersystem
S
2790,00 mm
Physics Package
S Electronics & On-Board Computer
Batteries, Powerdistribution Lower Sealing & Umbilicals
1m
Ø500,00 mm
Figure 7.1: MAIUS-I vehicle consisting of VSB-30 motor, scientific payload and MORABA systems (left) and overview of scientific payload showing the (sub)systems described in the following sections and the separation flange marked with "S" (right)
Payload Structure and Sealing
83
The transport in an upright position should prevent sheer stress on the rubber vibrational dampers. The payload has been split into two parts, because this will allow using standard trucks as well as passing most doors in buildings, due to a package height below 2 m. Moreover the integration effort at Esrange and the risk of delays due to problems during integration is minimized by having just a few electric and only one mechanical connection to be re-assembled. The mechanic and thermal design of the systems mentioned above, as well as the design of the MAIUS payload structure, sealing and harness is an essential part of this thesis and is described in the following pages. Additional investigations have been carried out on testing, design and simulation of ultra high vacuum components and a low-cost vibration damping system. These systems, the developed simulation tools and the results of tests and simulations are presented in part III of this thesis. Moreover the characterization and simulation of the thermal environment aboard the payload during flight and the design of a suitable thermal control system for flight and laboratory operation will be discussed in part IV of the thesis.
7.1 Payload Structure and Sealing As mentioned above, the payload consists of five segments which are meant to be kept under pressure during flight. In the following section the connection between the different hull segments, the sealing concept and the mounting of the different system platforms to the outer hull is described in detail. Moreover the concept for harness routing and the structural interface of the umbilicals shall be presented.
7.1.1 Outer Structure and RADAX Joints The modules of the MAIUS scientific payload are 500 mm in diameter with a wall thickness of 5 mm. The increase of the wall thickness from standard 3 mm to 5 mm minimizes the impact of aerodynamic heating on the inside of the payload by increasing the thermal capacity of the outer structure. The impact of the wall thickness on the thermal behavior of the system is discussed in chapter 10 in more detail. The length of the modules varies from 500 mm to 620 mm driven by the systems they are sheltering. All modules are made from aluminum EN AW 7020 (AlZn4,5Mg1) with a minimal yield strength of 275 N/mm2 and a minimum specified tensile strength of 340 N/mm2 . Thus the material combines a low specific weight with a comparable high tensile strength.
Ø494,10 B0,20
Ø484,90 B0,05
0,10 Ø475,00 ++ 0,05
Ø460,00 B0,10
0,00 Ø474,90 -+ 0,10
484,60 B0,05
Ø492,90 +- 0,20 0,00
0,00 Ø500,00 -+ 0,20
Ø476,00 B0,10
PAYLOAD SETUP AND MECHANICAL DESIGN
84
B
T 0,05 A
T 0,05 A
M
A
T 0,05 A
Detail B: RADAX mounting ring
RADAX male
RADAX female centering flank / sealing face
R10,0 0
40x M6x1 Helicoil 2d 5,20
20,00
7,50
.8 1,5d x0 M5 licoil He 12,00
15°
30°
adapter end / lining groove
28,00
0 6,0
16,00 31,25
40x P6,50 40x R6,00
Figure 7.2: RADAX flange specifications for the MAIUS payload. A lining groove has been added for sealing purposes. Moreover the tolerances have been reduced to guarantee a proper sealing between the modules as discussed in the text.
Payload Structure and Sealing
85
The different hull segments are connected to each other by standardized RADAX-Flanges, which are used within several sounding rocket programs. RADAX is an abbreviation for radial-axial. The name derives from the screwing which is established by M6 screws applied radial under an angle of 60◦ to the module front edge as illustrated in detail B of figure 7.2. Each hull segment is equipped with male and a female RADAX flange. The male flange provides M6x1 threads reinforced with steel Helicoils with a length of 2 x d (two times the diameter of the thread / 12 mm). The Helicoils strengthen the thread flanks in this connection, which is subject to high loads. The female flange is equipped with countersink through holes according to DIN974-1 with a diameter of 6.5 mm. The number of screws is depending on the diameter of the modules. For 500 mm modules, as used in MAIUS, 40 screws are used. The threads have to be positioned with small tolerances as defined in drawing 7.2, to ensure a proper assembly of the hull segments. The modules are assembled using screws made of stainless steel A2-80 with a tensile strength of 800 N/mm2 . These screws have to be torqued with 10 N m each. The modules are mounted from below with the female side facing upwards as shown in figure 7.1 to prevent the holes from pointing in flight direction for aerodynamic reasons. The modules are centered with the cylindrical adapter end at the male flange as shown at the lower left in figure 7.2. For this reason the flank of the adapter end has to be concentric to 0.05 mm with the screwing circles and the associated centering flank of the female flange. Since the modules have to be sealed and pressurized a lining groove is integrated into the adapter end. An O-ring will be used for sealing the gap between adapter end and the centering flank of the female flange of the next module. To ensure a proper sealing the dimensions and tolerances have been changed in comparison to the standard RADAX flanges. More details on the dimensioning of the lining grooves and the tolerances will be presented in section 7.1.3. The instrument platforms carrying the (sub)systems are mounted to the hull segments by six mounting brackets, which will be described in subsection 7.1.2. Each hull module offers a mounting ring to attach these brackets to the hull segments. The dimension "M" defines the position of the platform within the module and is depending on the dimensions of the components mounted on the platforms. At the ring the wall thickness has been increased to 12 mm as illustrated in figure 7.2, which allows applying radial threaded holes without breaking the sealing. The ring is equipped with a total of 36 (6 x 6) radial tapped blind holes, whose threads are strengthened by using Helicoils with a length of 1.5 x d (7.5 mm). Each bracket is mounted to this ring with five M5 screws. The sixth hole placed aside of each bracket, is a grounding point for electrical grounding of the instruments platform, which is isolated from the hull by the rubber mounts.
PAYLOAD SETUP AND MECHANICAL DESIGN
86
7.1.2 Suspension and Vibration Damping As mentioned above the different (sub)systems are mounted to instrument platforms which are connected to the hull by brackets and a passive vibration damping to reduce (especially) vibrational loads with high frequencies. Each plate is mounted to the hull segment by a total of six brackets, each one equipped with two vibration dampers and a safety bolt as shown in figure 7.3. Cable duct #1
9,00 R22
30°
0 R238,0
R207,00
30°
R212,5 0
Cable duct #2
(a) System platform with vibration (b) Detail view on a mounting bracket with vibradampers and safety bolts tion damper and safety bolt Figure 7.3: Component mounting concept for MAIUS payload
The vibration dampers GP-TYPA-25X10-M6-SH55 are provided by the company STS (Schwingungstechnik Schuster). The type "A" dampers are of cylindrical shape. They are made of natural rubber with a hardness of 55 Shore. The rubber cylinder has a diameter of 25 mm and a height of 10 mm. Two M6 bolts with a length of 20 mm are vulcanized into the cylinder for mounting. Each rubber damper is capable of carrying 80 kg and will allow a stretching of 3 mm before failing. The devices will in particular reduce high frequency vibrations. The damping features are essential for the reliable operation of the payload components. Thus these will be investigated in more detail in section 8.2. The safety bolt will limit the stretch of the rubber dampers to 2 mm to prevent them from damage. After a stretch of 2 mm the safety bolts will carry all loads applied to the platforms without vibration damping. The safety bolts are designed to be capable of carrying the loads of launch and re-entry (of up to 30 g as given in section 5.6). The brackets themselves are mounted to the hull with five DIN 912 M5 x 12 mm screws (class 8.8.) torqued with 5.9 Nm. Each bracket is manufactured from aluminum EN AW 7075, which has been provided by the company AMCO. The supplier specifies the typical yield strength to be 462 N/mm2 and the typical tensile strength to be 533 N/mm2 . The ANSYS material properties have been set accordingly.
Payload Structure and Sealing
87
As defined in section 5.6 a maximum acceleration of 13 g is expected during ascent and a deceleration maximum of 25 g during re-entry. Moreover the shock at touchdown is assumed to range from 50 g to 100 g. In rare cases (e.g. landing on a rock) it might even reach 200 g and more. Accordingly the expected loads on the brackets are depending on the actual weights of the platforms mounted. Table 7.1 summarizes the resulting loads on the brackets and screws. Accel. [g]
Load [N]
Load/bracket [N]
Load/screw [N]
15 30 50 100
4708.80 9417.60 15696.00 31392.00
784.80 1569.60 2616.00 5232.00
156.96 313.92 523.20 1046.40
15 30 50 100
9564.75 19129.50 31882.50 63765.00
1594.13 3188.25 5313.75 10627.50
318.83 637.65 1062.75 2125.50
15 30 50 100
17658.00 35316.00 58860.00 117720.00
2943.00 5886.00 9810.00 19620.00
588.60 1177.20 1962.00 3924.00
Batteries Platform (32 kg/6 brackets) Ascent Re-Entry Touch Down min Touch Down max Electronics Platform (65 kg/6 brackets) Ascent Re-Entry Touch Down min Touch Down max Experiment Platform (120 kg/12 brackets) Ascent Re-Entry Touch Down min Touch Down max
Table 7.1: Bracket loads for all MAIUS systems
These calculations have been performed under the assumption, that the load of the platform is distributed equally between the six brackets. This is a reasonable assumption, since the center of gravity of the system setups mounted to the platforms is designed to be close to the center of the platform. For accelerations along the cylindrical axis, as expected during ascent and touch down, this will result in an equally distributed load. Although the experiment platform is supported by a total of twelve brackets, calculations have been performed for six brackets carrying the total load to do a worst case analysis. Moreover the loads per bracket would be almost identical to those of the electronics platform if all twelve brackets would be loaded. All loads listed in table 7.1 have been included in an ANSYS FEM simulation with a total of 13 load steps. In step 1 the pretension of the screws is set to 6.4 kN. In the following load steps the loads listed in table 7.1 are applied sorted by their size.
PAYLOAD SETUP AND MECHANICAL DESIGN
88
The safety factor is defined as the quotient between the yield strength and the maximum van-Miese comparison stress computed for the bracket. At at maximum load of 19.6 kN per bracket the minimum factor of safety is 1.028 as illustrated in figure 7.4a.
Factor of Safety
Figure 7.4b shows the dependency of the factor of safety on the external loads applied on each bracket. As illustrated by the plot the pretension load of the five screws already results in a minimum safety factor of 1.89 due to the high contact pressure between the screw head and the bracket. 1.8 1.6 1.4 1.2 1 0
10 5 15 Applied load in kN
20
(a) Local distribution of factor of safety at maxi- (b) Minimum factor of safety for different loads mum load 19.6 kN Figure 7.4: FEM simulation results for the brackets under different loads
Assuming that loads are distributed equally between all twelve brackets at the experiment platform, a maximum load of 10 kN per bracket is expected for a touch down shock of 100 g at the electronics platform and brackets. These loads result in a minimum factor of safety of 1.46 which is reasonable to guarantee a safe recovery of all equipment. Additionally the factor of safety against slipping of the brackets has to be calculated for the bracket screwing, which is given as Fp μs n (7.1) SS = F with Fp being the pretension force in the radial screw, μs the coefficient of friction between the bracket and the hull, n the number of screws per bracket and F the load per bracket. The results for the worst case loads at payload touch-down are summarized in table 7.2.
Batteries Platform Electronics Platform Experiment Platform
Accel. [g]
Load [N]
Load/bracket [N]
Ss
100 100 100
31392.00 63765.00 117720.00
5232.00 10627.50 19620.00
6.42 3.16 1.71
Table 7.2: Factor of safety against slipping of brackets at different instrument platforms
Thus the mounting is capable of carrying accelerations or shocks of more than 100 g.
Payload Structure and Sealing
89
Higher loads are possible but not very likely. This is why a design to withstand higher loads is not considered reasonable.
7.1.3 Sealing and Feed Throughs The scientific payload should be pressurized at 1100 hPa using artificial air during flight and on ground. To achieve this a hermetic sealing of the payload with a total of six seals is necessary. Four of those at the RADAX joints and one each at the bottom and the top. All of this seals will be established with rubber O-rings made of HNBR (hydrogenated nitrile rubber) with a hardness of 70 Shore. This material has a temperature range of use from 30 ◦C to 150 ◦C. Moreover the elastomer features high mechanical stability and abrasion resistance. D ( axial )
E ( radial )
Screwing (24 x ISO4762 M4x20)
Lead-in chamfers
12,00
RADAX screwing (40 x ISO4762 M6x16)
D O-ring (d1=447mm / d2=3 mm)
E
g
O-ring (d1=464mm / d2=3 mm)
d2 d1
Figure 7.5: Different sealing type in MAIUS payload. The radial seal will provide a hermetic sealing between the hull segments. The axial seals are used at the top and bottom to close the pressurized volume of the payload.
As shown in figure 7.5 there are two different types of seals within the MAIUS payload. The seals at the top and bottom are axial, while the seals at the RADAX flanges of the modules are radial. For both types the lining groove and the gap has to be dimensioned individually. Design guidelines giving requirements for the geometry and the surface properties is provided by the O-ring manufacturer DICHTOMATIK [Dic13a]. As given in figure 7.5 both the axial and the radial O-ring have a diameter d2 of 3 mm. Since this is a static application with the high pressure at the inside and low-pressure (Space) at the outside, the lining groove depth and width can be determined from the design guidelines. The geometry of the groove is chosen to be rectangular. Therefore the depth of the groove of the radial sealing should be 2.3 mm and the width 3.9 mm. The lead-in chamfer has a size of 2.5 mm. The depth of the groove of the axial sealing is identical, while the width
PAYLOAD SETUP AND MECHANICAL DESIGN
90
shall be slightly larger (4.1 mm). Moreover the transition between the groove flank and base and between the groove flank and the adapter end surface must be slightly rounded to protect the o-ring from damages. The radii are related to the cross section of the O-ring. For a 3 mm cross section the radii are 0.2 mm and 0.5 mm as shown in figure 7.6. For static applications the required surface qualities for the groove flank and groove base are also defined in the design guidelines. As shown in figure 7.6 the surface quality of the groove flank and bottom are chosen to be identically for the MAIUS payload. Moreover the dimensions of the lining groove and their tolerances have been adapted slightly to ensure that the sealing gap g, groove filling N and deformation D are within the limits given in the design guidelines. Ra 1,6 Rz 6,3 � �� � � �� � ��
Ra 1,6 Rz 6,3 4,00 +- 0,10 0,00
3� �� B
3B�� � 3[�� �
� � �
� �� � � �� � ��
0,00 2,30 -+ 0,10
0,2 0
"9 �.
�� 3�
R0, 60 B
R0,2 0M AX
Ra 0,8 Rz 6,3 2,35
(a) Radial sealing
(b) Axial sealing
Figure 7.6: MAIUS lining groove dimension of o-ring sealing
Especially the groove filling and the sealing gap size are depending on the tolerances given in the drawings and on the deformation of the parts involved in the sealing. For this reason these parameters have to be calculated for a maximum and minimum dimension value. The groove filling is defined to be the ratio between the cross section of the O-ring AOR and the cross section of the lining groove Agroove N f ill =
AOR × 100% Agroove
(7.2)
It should be between 70% and 85% according to the design guidelines. With the cross sections of groove and O-ring π (7.3) AOR = d22 × 4 (7.4) Agroove = tgroove × bgroove and the tolerances given in figure 7.6 for the groove dimension, the minimum groove filling for axial and radial sealing is found to be Nmax = 85.17% and the minimum Nmin = 70.49%.
Payload Structure and Sealing
91
The sealing effect of the o-ring is ensured by radial or axial deformation. According to the guidelines the deformation should be between 15% and 30% for static applications and is calculated from d2 − (g + tgroove ) × 100% (7.5) D= d2 Obviously the size of the gap g has a significant influence on the deformation and the sealing effect. The required values for this dimension are given in the design guidelines. For static applications with an operating pressure below 60 000 hPa and a material hardness of 70 Shore the gap dimension should not exceed 0.2 mm. This value is increased to 0.25 mm for a material hardness of 80 Shore. The tolerances of the radial lining groove in figure 7.6 and for the adapter end of the RADAX connections in figure 7.2 will result in a minimal radial gap of grad,min = 0.15 mm and a maximum radial gap of grad,max = 0.25 mm. This should be reasonable due to the low operating pressure. For standard RADAX connection tolerances these values would be significantly higher (grad,min = 0.2 mm and grad,max = 0.5) mm. For this reason the tolerances have been reduced for MAIUS RADAX flanges.
Displacement in mm
While no deformations are expected at the radial seals, the gap size of the axial seals is depending on the deformation of the sealing plate due to the pressure difference and external loads.
0.3 0.2 0.1 0 0
0.1 0.2 0.3 0.4 Position at plate in m
(a) Overview of displacements at bottom seal- (b) Path plot of displacements in y-direction ing along the sealing plate. At bor holes the displacement is 0. Figure 7.7: FEM simulation results for sealing plate deformation
The plate is made of aluminum EN AW 7075 and is fixed with 24 M4 steel screws (property class 8.8.). The screws are tightened with a torque of 3 Nm which results in a pretensioning force of 3.9 kN, which is included in the FEM simulation. Moreover a pressure difference of 1000 hPa and ascent accelerations of 15 g in positive y-direction have been assumed and
PAYLOAD SETUP AND MECHANICAL DESIGN
92
modeled. This is representative for the worst case at the bottom sealing plate, where those loads will add up, because they point in the same direction. Figure 7.7 displays the results of a FEM simulations performed for the sealing plate with these parameters. It shows a maximum bending and lifting of the plate of 0.05 mm at the lining groove position (14 mm from the plate edge). The maximum deformation in y-direction at the center of the plate is about 1 mm. With these results the deformation can be calculated from equation 7.5 resulting in a maximum deformation of the radial seal of Drad,max = 21.6% and a minimum of Drad,min = 15 %. The gap is significantly smaller in the axial sealing. This results in larger deformation Dax,max = 26.67% and Dax,min = 21.66% considering the deformations of the plate and the tolerances of the lining groove dimension. All of these values are within the requirements although often at the edge. However no leaks are expected at the O-ring seals, because of the low operation pressure. Water cooling feed through for laser system Sealed CONEC feed through connector (ST-1 to ST-7) Air inlet for pressurization
Hermetic SOURIAU feed through SB-1 Sealed CONEC feed through connector (SB-2 & SB-3)
Water cooling feed through for batteries & electronics
Hermetic SOURIAU feed through ST-8
Air outlet for pressurization
Umbilical ports (2x water / 1x data)
Umbilical ports (2x water / 1x power) 3-axis accelerometer
3-axis magnetometer
(a) Sealing Top
(b) Sealing Bottom
Figure 7.8: MAIUS sealing plates with multiple feedthroughs for water-cooling, data and power supply.
The experiment requires multiple connections to the outside for power and water supply and data connection to the ground and the service module. Moreover the control and sensor data from and to the motor has to be passed through the sealed payload enclosure. All of these have to be fed through the sealing plates at the bottom and top without violating the sealing. The ethernet and RS422 interfaces to the service module (connector #ST-4 to ST-7) as well as the interface from the service module to the motor (#ST-1 and ST-2) are connected
Payload Structure and Sealing
93
with rubber sealed IP67 graded feedthroughs manufactured by CONEC. These connectors consist of a female D-Sub connector on the atmospheric side and a male connector at the vacuum side as shown in figure 7.9a. The current for activation of the titanium sublimation pump is supplied over a similar connector (#ST-3) with high current contacts rated for a maximum of 30 A as shown in figure 7.9b.
(a) D-Sub 15 feedthrough
(b) D-Sub 3W3 connector
Figure 7.9: Rubber sealed CONEC feedthroughs
The data and power umbilical ports are situated outside the pressurized enclosure, because a sealing of the umbilical port to the cylinder wall would be difficult to achieve. Thus the signals of the power and data umbilical will be fed through the sealing plate first. This is achieved by a SOURIAU bulkhead feedthrough with standard reinforcement sealing achieved by a silicone elastomer. A 37 pin layout 8DB-7-15F35-PS-N equipped with 5 A rated contacts at the top for the data and low current applications. For the charging of the main batteries a 12 pin layout 8DB-7-15F97-PS-N equipped with 4 contacts rated for 13 A and 8 contacts rated for 7.5 A has been chosen. bulkhead fitting
O-ring
jam nut
(a) Drawing of bulkhead fitting with (b) Photo of the sealing plate with connectors, ball tap sealing concept and bulkhead fitting Figure 7.10: MAIUS sealing plate feedthrough concepts
The water for both the laser and the electronics cooling is provided by an umbilical as well.
PAYLOAD SETUP AND MECHANICAL DESIGN
94
The umbilical port has also been placed outside the pressurized volume. The feedthrough is realized with a bulkhead fitting, which has been equipped with a rubber O-ring at the body side of the fitting. From the other side the fitting is fixed with a jam nut as illustrated in figure 7.10a. This will provide the necessary deformation of the O-ring and establish a reliable sealing. Since the fitting itself is sealed and the cooling circles have no open end to the atmosphere in the enclosure this will ensure a reliable sealing. For operation the enclosure should be filled with artificial air without carbon hydrates as required by the lasers and optics. The gas used for pressurization is a mixture of 20 % oxide (purity grade 5.0) and 80 % nitrogen (purity grade 5.0). For pressurization of the enclosure one ball tap is installed in the top and one in the bottom sealing plate. This will allow a flushing of the interior with the gas to ensure that the atmosphere will meet the requirements. After flushing the bottom ball tap is closed and the pressure is set to 1100 hPa absolute pressure, which will be measured at the bottom of the electronics section by a absolute pressure sensor. The slight overpressure inside the enclosure will allow to detect leaks during flight and on ground.
Pressure in hPa
2060
2040
2020
0
10
20 Time in h
30
40
(a) Test setup of upper and (b) Full 40 hour pressure reading during the pressure test lower MAIUS hull segments showing only 55 hPa reduction in pressure. Figure 7.11: Pressure test of hull sealing performed with 2000 hPa absolute pressure
For verification of the design and the sealing methods, the upper and lower hull segments including the sealing plates and feedthroughs have been tested for leaks before integration of the components. The water in- and outlet fittings in the sealing plates have been connected to each other for this purpose. For representative testing the absolute pressure has been set to 2000 hPa assuming that the outside pressure during flight will be close to absolute zero. Thus the pressure difference between the enclosure and the outside in both scenarios is approximately 1000 hPa.
Harness and Umbilicals
95
After pressurization the setup has been observed for 40 hours recording the absolute inside pressure using an absolute pressure sensor with an external power supply and a simple voltage data logger. The test setup and the pressure reading are shown in figure 7.11. Within a period of 40 hours the pressure within the hull segments dropped by 55 hPa. The slope of the pressure plot is almost constant, thus the leakage rate should be constant as well. For this reason the sealing concept is considered qualified. However the assembly of the entire structure will increase the number of seals, which will influence the leakage rate. For this reason a pressure test of the entire payload will be carried out in combination with a thermal test during the first flight simulation campaign in Hanover. Moreover a test of the sealing under vibrational loads will be performed during the final environmental tests in Ottobrunn.
7.2 Harness and Umbilicals For operation of the MAIUS payload a significant number of cables and hose pipes is required to provide the experiment with water for cooling, power for charging the internal batteries and for communication. Launch Tower
Bunker EGSE Client Laser
Payload GSE-II
Payload Umbilical (Data)
(Yellow Box)
Tower Umbilical
EGSE Client Electr.
EGSE Server
EGSE Client System Chiller-II
Payload Umbilical (Water I&II)
(Ministat 125)
EGSE Client Science
Range Umbilical
System I
Harness
System II
Science Center Chiller-I
Payload Umbilical (Water III&IV)
(Ministat 240)
Payload Umbilical (Power)
(Green Box)
GSE-I
EGSE Client Science
EGSE Client Science
Figure 7.12: Concept of MAIUS ground support equipment (GSE) and its connections and locations at Esrange
As illustrated in figure 7.12 it has to be differentiated between internal cables and hoses connecting different systems within the payload and external cables connecting the rocket with the ground support equipment (GSE) or the electronic ground support equipment.
96
PAYLOAD SETUP AND MECHANICAL DESIGN
At Esrange the launch site composes of three buildings used during the MAIUS mission as illustrated. The integration hall, where the payload is integrated for final tests and launch, the Skylark launch tower, where the payload is attached to the motors and from where the rocket is launched and the main building. During launch the payload will be controlled from a bunker within the integration hall close to the skylark tower. Due to the limited space within the bunker some of the scientists are accommodated at a science center in the main building, where they also have access to the scientific data. The launch tower at Esrange offers standard 230 V power sockets to supply the GSE with power. Moreover an Ethernet connection between the launch tower and the bunker is provided by the tower umbilical. The range umbilical will allow to connect the science center with the server in the bunker. All additional wiring has to be managed by the payload team. The internal wiring (harness) and the wiring between the payload and the ground support equipment (umbilicals) will be described in the following.
7.2.1 Cable Ducts and Harness MAIUS is equipped with two cable ducts to route all internal cables situated between 135◦ and 165◦ as well as between 315◦ and 345◦ in the MAIUS coordinate system. The cable ducts span over 30◦ with an inner radius of 212.5 mm and an outer radius of minimum 230 mm limited by the rocket hull structure as illustrated in figure 7.13. While cable duct II will only shelter cables, cable duct II will also house the Swagelok hoses of the water cooling as described in section 12.1, which reduces the space available for cables.
Figure 7.13: Cable duct geometries in MAIUS-1 for internal wiring between the different systems
In total 96 cables with a weight of approximately 18 kg connect the different subsystems within the payload. The cables between the subsystems have been dimensioned in length and diameter according to VDE standards depending on the geometry of payload and the
Harness and Umbilicals
97
use of the cable. The length has been determined using the high detail CAD model of the payload which is also a result of this thesis. Additional 100 mm in cable length have been considered for every RADAX flange a cable will pass. This should allow to open the RADAX connection for inspection of the interior and minor repairs. The conductor diameters vary from AWG10 to AWG26 depending on the power consumption of the appliance. Most cables are equipped with standard or combination subminiature (DSUB) connectors. The number of conductors or pins varies from 2 to 37. All internal cables are protected by rubber insulation rated for temperatures of at least 105 ◦C, which is sufficient since the temperatures at the surface of the outer rocket structure should not exceed these values (refer chapter 10). The cables are fixed with tie raps to a bracket mounted at each instrument platform shown at the right hand side of figure 7.13. This will reduce the free length of the cables and prohibit uncontrolled movement of the harness.
7.2.2 Umbilical Ports The MAIUS payload is equipped with six umbilicals. Two MIL-38999 push-pull connector umbilicals provide the power supply and communication with the payload. Moreover four custom umbilicals made of Swagelok components will allow a constant water cooling of the payload until lift off. 4PVSJBV�SFDFQUBDMF
1PXFS�%BUB�VNCJMJDBM�TIPF 4XBHFMPL�CVMLIFBE GJUUJOH 8BUFS�VNCJMJDBM�TIPF 4XBHFMPL�RVJDL� DPVQMJOH
(a) Picture of data and water umbilical (b) Cut through umbilical ports showing different ports components Figure 7.14: Umbilical ports of MAIUS-1 payload
An umbilical connection is generally established by two parts. The receptacle at the payload side, which feeds the lines through the outer hull outside of the sealed area and the
PAYLOAD SETUP AND MECHANICAL DESIGN
98
push-pull lanyard connector at the ground side attached to the launch facility. The umbilical receptacle is integrated into a umbilical shoe, which is mounted to the rocket structure feeding the lines through the rocket hull as shown in figure 7.14b. The umbilical cable itself is provided with a push-and-pull quick connect connector, which is attached to the launch rail by an laynard steel cable. Thus the plug will be unlocked automatically by the pull when the rocket lifts off. The MAIUS power and data umbilical shoes are identical, since the SOURIAU receptacles have the same housing size. The connectors are mounted to the umbilical shoe by four M3 screws, while the umbilical shoe is attached to the structure by four M4 ISO 10476 screws as shown in figure 7.14a. The MAIUS umbilical cables are equipped with an additional mechanical and thermal protection, made from glass fibre meshwork increasing the temperature rating to 250 ◦C, which might allow reusing the umbilical for future missions.
(a) Water umbilical
(b) Power umbilical
Figure 7.15: MAIUS-1 umbilicals
The upper umbilical will provide power to the backup batteries of the pump controller and will establish an ethernet connection to the ground support computer for data handling and control of the experiment from the ground support computers at the bunker. Moreover the signal of two temperature sensors placed at the electronics and laser heat sink is provided through the umbilical as input for the temperature controller of the chillers. In total 37 pins rated for a maximum of 2A are connected via a Souriau 8D9P-15F35-P-N-L lanyard plug until lift off. The counter part at the payload side is the Souriau receptacle push-pull connector 8D8R-S-15F35-SN.
Harness and Umbilicals
99
The lower umbilical supplies the main batteries of the payload with charging power. The lanyard plug 8D9P-15F97-P-N-L is used to connect the power supplies of the ground support equipment (GSE) with the payload. At the payload the receptacle push-pull connector 8D8R-S-15F97-SN is mounted to an umbilical shoe. As mentioned above in addition to the data and power umbilical, four umbilical ports are used for providing cooling water until lift off. The two ports at the top supply the cooling cycle of the laser system and the two at the bottom supply the cycle of the electronics and batteries. All four umbilical ports are designed identically as shown in figure 7.14b. A water cooling umbilical connector is not available commercially. For this reason one had to be developed within this mission based on industrial quick coupling connectors. These connectors have to be small in size and should be equipped with seals at the body and the stem to prevent water from spilling out when the connectors are disconnected. For simplicity of the design the connection should allow bidirectional flow and the connectors should be disconnected by pulling to allow a passive decoupling by a lanyard as it is done with regular power or data umbilicals.
Slide Slide hook
d
Body valve seal DESO valve seal
Packing seal Stem seal Locking dogs Adapter seal
➡
w
al flo
ction
re Bidi
➡
Figure 7.16: Concept of Swagelok QTM quick coupling. This coupling is rated for 30 MPa and suitable for bidirectional flow [Swa11].
Review of different concepts and suppliers revealed the stainless steel PTFE-sealed quickconnector series (QTM) from Swagelok to be most suitable for this application. Due to the limited space the smallest QTM2 connector with a 3/8" Swagelok tube fitting has been chosen. This connector is capable of handling a maximum flow of 56 l/min and will allow a maximum pressure of 6.89 MPa uncoupled and 31 MPa coupled. This is significantly above the requirements for the thermal control systems as calculated in chapter IV.
PAYLOAD SETUP AND MECHANICAL DESIGN
100
The Swagelok bulkhead fitting SS-600-R1-6 is directly mounted to the umbilical shoe by the bulkhead jam nut providing a 3/8" tube fitting at the inside and a 3/8" tube at the outside. The quick coupling stem SS-QTM2-D-600 is directly mounted to the short 3/8" tube to the outside. This quick coupling stem is the actual interface of the payload. Its counterpart, the SS-QTM2A-B-600 quick coupling body is connecting the payload to the chiller, which are part of the ground support equipment as illustrated in figure 7.12. The water is transported with a Swagelok series W thermally insulated PTFE hose. The hose is protected by a fire jacket made of woven fiberglass with specially compounded aerospacegrade silicone rubber. The fire jacket withstands short-term flame exposure even at temperatures of more than 1000 ◦C. Thus the water umbilical hoses will survive the harsh environment in the launch tower and can be used again. For separation of the connectors a small plate made of aluminum is placed between coupling stem and body. As shown in figure 7.17 plate is only 2.5 mm thick, thus the locking of the coupling will not be affected. As described above the lanyard will be attached to the tower, for this reason the connector will be unlocked during lift off. The seals in the stem and the body will prevent the water from flowing out at both, the rocket segment and the ground segment. Separation plate
Quick coupling stem
2.50
Quick coupling body
Mounting hole for lanyard
Figure 7.17: Water umbilical connectors with separation plate installed. The separation plate will automatically decouple the connection at lift-off.
The unlocking was tested on ground, to ensure that the force for separation of the connectors will not exceed the design loads of the umbilical shoe and the separation plate. For this purpose a force sensor has been attached to the lanyard of the umbilical and was separated manually as shown in figure 7.18b. For comparison the same test has been performed with the commercial MIL-38999 connector, which has been qualified for sounding rocket or missile applications.
Harness and Umbilicals
101
50
Force in N
40 30 20 10 0 0
20
40
80 60 Time in s
100
120
(a) Separation force for six separation tests with the water (b) Test setup for water umbilical umbilical connector Figure 7.18: MAIUS-1 water umbilical separation test
Figure 7.18a shows the results of the tests. In total six (manual) separation tests have been performed with constant data logging. In all tests the separation force was below 50 N. The MIL-38999 connector needs 80 N to 120 N for separation. In particular no blocking or other decoupling problems have been observed at the water umbilical. Thus the concept for separation is considered qualified.
PAYLOAD SETUP AND MECHANICAL DESIGN
102
7.3 Physics Package
420,50
The compact physics package consists of three main parts as named in figure 7.19. The pumping system, which is located outside of the magnetic shielding, the experiment chamber inside the shielding and the three layer magnetic shielding itself. Moreover the laser system is directly attached to the lower instruments platform of the physics package.
Pumping System
Upper mounting bracket
544,00
Magnetic shielding
Experiment Chamber
236,50
Lower mounting bracket
Laser System
Figure 7.19: Overview of physics package integrated in hull segments
The physics package is the only system in the MAIUS payload mounted to two platforms. This is because of the magnetic shielding, which should be suspended at the top and the bottom to avoid any plastic deformation of the shield. Such deformations would decrease the shielding factor by changing the crystalline structure of the metal. Moreover the laser system should be situated close to the experiment chamber, since it is permanently connected to the chamber by sensitive single-mode optical fibers. As shown in figure 7.20 the magnetic shielding and the experiment chamber are located between the two instrument platforms. The magnetic shielding, the experiment chamber and the pumping system are mounted to the upper platform, while the laser system is attached to the lower platform.
Physics Package
103
Both platforms are attached to the rocket structure by 6 mounting brackets each as described in section 7.1.2. The rubber dampers allow a maximum movement of 2 mm before the safety bolts will carry the loads. Bracket and safety bolts are mounted mirrored. Thus the assembly of both platforms might travel 2 mm upwards before the lower safety bolts will limit the deflection or 2 mm downwards before the upper bolts will do the same. The two platforms are connected by four stand-offs with a diameter of 10 mm and a M6 thread at both ends. The stand offs will prohibit a movement of the platforms towards each other. The length of the stand-offs is 534 mm, which provides 10 mm of space between the lower platform and the bottom of the magnetic shielding. This should avoid any loads on the shielding to maintain the shielding factor. The stand-offs are made of stainless steel 1.4404/316L (DIN X2CrNiMo17-13-2) with a yield strength of 320 MPa, a tensile strength of 530 MPa and an elastic modulus of 210 GPa [Deu08].
B Stand-Off (4x)
534,00
20,00
M6x
B 10,00
Mü-metal brackets
Figure 7.20: Physics package mounting with stand-offs needed to prevent movement of the two physics package base plates towards each other and for integration into the rocket hull.
To prevent buckling of the stand-off columns during integration of the physics package in the hull, the maximum allowable axial force has to be calculated from Fmax =
π 2 EIcirc,x (KL)2
(7.6)
where E is the modulus of elasticity, Icirc,x the area moment of inertia, defined as Icirc,x =
πr4 4
(7.7)
104
PAYLOAD SETUP AND MECHANICAL DESIGN
and KL the effective length. The effective length is the product of the actual length of the column multiplied with a column effective length factor K, depending on the conditions of the end support of the column. Since the columns are screwed to the instrument platforms at the top and the bottom, the column support is considered fixed on both ends. Thus the effective length factor is K = 0.5. For the material properties given and the geometry presented in figure 7.20 the maximum force is calculated from equation 7.6 to be Fmax = 14 271 N per column. (Sub)System Experiment Chamber Pumping System Vacuum Controller Patchpanel Laser System Magnetic Shielding Instrument Platforms Cables Total
Mass [kg] 13.5 16.5 2.0 0.5 22.3 35.1 10.4 ≈ 5.0 105.3
Table 7.3: Masses of physics package subsystems and lasersystem
As listed in table 7.3 the overall weight of both instrument platforms and the components mounted to them is 105.3 kg. During assembly, when gravity will be the only mechanical load, the physics package applies a maximum force to a column of Fc,max = 1033 N if one column carries all the mass. The load per column is reduced to Fc,min = 258.3 N if the load is distributed equally between all columns. Thus the factor of safety against buckling is SB,min =
Fc,max = 13.82 Fmax
(7.8)
Fc,min = 55.25 (7.9) Fmax Once integration in the hull is completed, the brackets will carry most of the loads applied e.g. during launch. Nevertheless the columns would withstands accelerations of up to 55 g if the loads are distributed equally between all four columns. Thus a safe operation under mechanical loads as predicted for a regular flight in section 5.6 is guaranteed even if some of the brackets would fail. SB,max =
Physics Package
105
7.3.1 Magnetic Shielding The preparation of atoms for interferometry is very sensitive to fluctuations of external magnetic fields. As shown in figure 5.13 the magnetic environment will change with respect to the local experiment coordinate system due to the movement of the vehicle. To ensure variations with an intensity of ΔB ≤ 0.4 mG [KL16] as required (compare section 6.6), a shielding factor of 1000 or more is needed due to the field intensities of 400 mG to 500 mG. The magnetic shielding of MAIUS consists of three layers. They are manufactured from MUMETALL, which is an alloy of 76.6 %Ni, 4.5 %Cu, 3.3 %Mo and 14.7 %Fe. This alloy offers high magnetic permeability μr between 60000 and 250000 [VAC02]. The high permeability of MUMETALL provides a low reluctance path for magnetic flux, thus external magnetic fields are guided through the metal and around the interior of the shield. MUMETALL is produced by the German company VAC - Vacuumschmelze GmbH. Its mechanical properties are comparable to soft-annealed steal alloys. The tensile strength is specified to be R p0.2 = 130 MPa, the yield strength Rm = 530 MPa and the elastic modulus E = 200 GPa after final annealing procedures [Dem14]. According to the manufacturer the stress within the shield should not exceed the tensile strength to maintain the magnetic properties of the material. A
Mounting to upper instrument platform (23 x DIN 912 M5x30)
Aluminum spacer
Cylindric shield mounting with 32 welded M5 nuts
cable feed-through 1,00
523,00
475,00
1,00 2,00
A: Detailed view Mounting 23x P5,30 DURCH
Degaussing cable feed-through
P360,00
Welded bottom plate 380,00 400,00 420,00
B: Aluminum Spacer
Figure 7.21: Detailed drawing of the MAIUS-1 MUMETALL shield giving dimensions and details of the mounting of the shield caps and cylinders (A) and a view on the aluminum spacers placed between the shield caps (B).
As shown in figure 7.21 each layer consists of an upper cap and a cylindrical mantle with welded bottom plate. A total of 32 M5 nuts are welded to the mantle of the shield. The
106
PAYLOAD SETUP AND MECHANICAL DESIGN
cap of each layer is screwed to the associated mantle by 32 M5 stainless steel screws. The thickness of the cap and mantle of the inner layer is 2 mm, while the outer two layers only offer a wall thickness of 1 mm. The outer shield measures 420 mm in diameter and 523 mm in height at the outside. While 475 mm in height and 380 mm in diameter are available inside the shield. The caps of the shielding are mounted to the upper instruments platform of the physics package by a total of 23 DIN ISO 4762 M5 titanium screws, which have been torqued with 5.7 N m. Moreover radial movement of the shield should be prohibited by four brackets which are clamped to the magnetic shielding. All three shield layers exhibit three violations of a perfectly closed shield. A bore hole with a diameter of 35 mm is necessary to insert a CF16 UHV vacuum flange into the shield, which obtains a connection between the UHV chamber inside the shield an the pumping system outside. A cut-out of 100 mm × 30 mm is needed to guide cables and optical fibers into the shielding. A third feed through has been included in the shield to wrap a cable around the shield, which can be used to degauss the shield. With this technique it is possible to compensate for saturation effects of the shield material, which will occur due to external magnetic fields or smaller deformations. A FEM simulation has been performed to predict the stress in the shield on ground and during the sounding rocket flight and thus estimate the shield performance. The simulation includes two separate load steps. In the first step the torque of the screws is simulated by applying a pretensioning force on each of the 126 screws. In the second load step an external load of 13 g along the cylinder axis is applied. This is equivilent to the loads expected during rocket ascent. Simulation results show that the caps of the shield exhibit the areas with the highest stress. The resulting equivalent van-Miese stress intensity is presented in figure 7.22 for the pretensioning forces of the screws (load step 1) and for the rocket ascent cases (load step 2). Areas of yellow color in figure 7.22 indicate that the van-Miese stress exceeds the tensile strength of MUMETALL of 130 MPa. As illustrated in the figure the maximum van-Miese stress is present at the contact area between the screw hat and the shield bolts. At this position the van-Miese stress exceeds the tensile strength of the material. Thus it is expected that the shielding factor will decrease after assembly of the shield even if no external loads are present. Although the affected area on the shield is comparable small, the predicted reduction of the shielding factor has been validated by measuring the residual magnetic field before and after shield assembly. A increase of the field inside the shielding from (−8/ − 2/ − 4) ± 5 nT in X/Y/Z-axis (where Z is the cylinder axis) to (−66/1/ − 254) ± 5 nT has been measured with an external field of (9333/2498/48502)±5 nT [KL16]. This is a significant reduction of the shielding factor. Fortunately this decrease can be compensated in the full amount by the use of the degaussing cable. Thus no reduction of the torque is necessary.
Physics Package
107
(a) Load step 1: Only bolt pretension forces applied
(b) Load step 2: 13 g acceleration applied in cylinder axis, bolt forces locked Figure 7.22: Simulation results for magnetic shield with different external loads. With simulated bolt pretensioning force of 6.7 kN in M5 screws and 4.7 kN in M4 screws. Yellow color indicates that tensile strength of the material is exceeded.
According to the simulation results the additional acceleration during ascent does not cause a significant rise of the stress in the shield. For this reason no decrease of the shield performance is expected during ascent. The vibrational test of the shield at 5.4grms verified this expectation for vibrational loads. The test has been performed in all three axis and the shield, which had been degaussed prior to the test, showed no reduction in the shielding factor after the test [KL16].
PAYLOAD SETUP AND MECHANICAL DESIGN
108
7.3.2 Vacuum System As stated in section 4 the objective of the mission is to achieve small expansion rates of the BECs to enable long time interferometry. Collisions of particles from the residual gas with the BEC will heat the BEC and thus fasten the expansion. A large number of particles in the background gas will enlarge the collision rate between the BEC and the background gas. For this reason an ultra high vacuum with pressures below 5 × 10⁻¹⁰ hPa inside the science chamber is mandatory. IGP
CPOT
Ti.-Sub. Pump
(a) MAIUS-1 physics package during (b) MAIUS-1 pumping system in flight configuration vacuum preparation inside the ISO5 during vibration test campaign cleanroom at LNQE Hannover. Figure 7.23: MAIUS-1 ultra-high vacuum system and vacuum preparation
To achieve these low pressures a combination of different pumps and an accurate cleaning and baking procedure is necessary. These procedures as well as details on the design and sizing of the UHV system will be presented in section 9.2.6. This subsection will only focus on the mechanical design and features of the vacuum system. During vacuum preparation a turbo molecular roughening pump is used. The roughening pump is connected with one copper pinch-off tube (CPOT) each to the preparation chamber and to the pumping system. Once the base pressure of around 1 × 10⁻⁹ hPa of the turbo pump is reached, the ion getter and titanium sublimation pump are activated and the pinch off tubes are closed using a hydraulic tool. During the pinch-off procedure the copper tube is hermetically sealed by hydraulic pinch-off jaws with a pressure of 70 MPa. This process is irreversible, thus the MAIUS pumping system has to resume pumping independently after pinch-off to compensate for residual out-gassing of components inside the vacuum or very small leaks, which can occur on each sealing.
Physics Package
109
For this reason the vacuum system is constructed from as few parts as possible. Wherever a hermetic connection between two parts was needed, the parts have been welded or brazed if possible. However some connections need to be reversible or can not be welded because of the material pairing. Those connections are sealed by indium or con-flat copper seals. The assembly procedures and the behavior of both sealing types in a (sounding) rocket environment and the impact on the vacuum pressure is one core topic of this thesis and will be discussed in chapter 9. UHV ion getter pump UHV cold cathode gauge Ion getter pump and UHV gauge controller Copper pinch off tube (CPOT)
Physics package patch panel
Titanium sublimation pump
Figure 7.24: UHV Pumping system comprising of an ion-getter pump, a titanium sublimation pump and a cold-cathode vacuum gauge. A copper pinch off tube is used instead of valves to connect a turbo-molecular pump during vacuum preparation.
As shown in figure 7.24 the center of the MAIUS-1 pumping system is a single stainless steel cube equipped with four CF40 ports and two CF16 ports. One CF16 port is establishing the connection to the experiment chamber, while the other one is used to connect the roughening pump with a copper pinch off tube. The port for the connection to the experiment chamber is hidden below the cube. For this reason a straight pipe can be used to connect both parts, which will maximize the effective pumping speeds at the 3D chamber. Since the experiment chamber itself is rigidly mounted to the instrument platform as the center cube, a bellow has to be added to the tube to prevent mechanical stress on the seals due to the mounting situation. The pumping rate needed to maintain the vacuum quality is generated by a commercial titanium sublimation pump ST22 manufactured by VG Sienta and a commercial ion getter pump VacIon 20Plus by Varian / Agilent. Both are connected to a CF 40 port of the center cube. The titanium sublimation pump ST22 has been modified by the supplier to be shorter than the standard pump. Thus it measures only 105.5 mm inside the vacuum and 160.4 mm overall. This modification was necessary because of the limited space on the instrument platform. The pump is installed in a custom-made CF40 stainless steal pipe with a length
110
PAYLOAD SETUP AND MECHANICAL DESIGN
of 125 mm, which is supported by two pipe clamps with a 3 mm rubber layer between the clamps and the pipe to avoid applying loads on the seals. Moreover the pipe is equipped with a M38 × 1.5 thread at one side. This thread is used to install a mesh with 141 bore holes with a diameter of 1.5 mm. This mesh, which is installed at the sealing between the pipe and the center cube, should prevent fragments of the filaments, which get porous due to the sublimed titanium, from floating into the science chamber during microgravity phase if the filaments would break as a result of the strong accelerations during lift off. Moreover the mesh should protect the ion getter pump from titanium particles condensing inside the ion getter pump, which would reduce the pumping rate of the ion getter pump. Unfortunately the mesh will also reduce the effective pumping speed by blocking the molecular flow into the tube. A good estimation and measurement of the pumping speed of the titanium sublimation pump is given in chapter 9. 125,00 Titanium-Molybdenum Filaments
38,00
M38 x 1.5
B 141x Ø1,50 THRU 105,50 160,40
B: Detailed view on mesh
(a) Schematic of a single cell diode or noble diode ion-getter pump [Wel93]
(b) Section view through VG Sienta titanium sublimation pump mounted in a CF40 pipe with mesh installed
The ion getter pump is the only device capable of pumping inert gases, such as noble gases or methane, once the roughening pump is separated from the MAIUS vacuum system. Thus it is essential to reach pressures in the low 10−10 hPa regime. Pumping of (inert) gases is achieved by ionizing the gas molecules and employing a strong electrical potential, which will accelerate the ionized gas towards a solid cathode. At the cathode the ions will either be burried in the cathode material or are chemically or physically absorbed by the cathode material. The noble diode pump VacIon Plus used with MAIUS-1 is equipped with cylindrical cathode elements configured as shown in figure 7.25a. Due to the high voltages applied in the ion pumps and their geometry ion pumps are sensitive to movements of the cathode, which need to be isolated electrically from the pump walls to avoid short circuits. The later constraint makes it difficult to properly support the cathode in the center of the pump. During the qualification process this fact caused a movement of the cathode at high-frequency vibrations.
Physics Package
111
The reduction of the distance between anode and cathode resulted in arching between the electrodes. Arching should be prevented because the pump is temporarily not functional if arching occurs and the arc might cause damage at the electrodes. To guarantee a reliable operation of the ion-pump the vibration damping mentioned in section 7.1 has been developed. A detailed study of this effect and the impact of the vibration damping will be described in section 9.6. Aside from the vibrational damping of the instrument platform, the ion pump has been slightly modified to pass the qualification tests. The small gap between the pump walls and the magnets has been filled with tape to prevent a movement of the pump between the magnets. Moreover the pump has been integrated in a support structure as shown in figure 7.24. The pump with its magnets attached is placed between two 3 mm rubber mats with a hardness of 55 Shore. Thus the pump will have no direct contact to the aluminum of the support structure to reduce the vibrational loads. The support structure will position the pump in an angle of 60◦ to the instruments platform. This is necessary, because of the limited space available and the constraint, that the center cube should be in the center of the instrument platform allowing a direct access to the science chamber. Following the design approach for the cube-science chamber connection a CF40 bellow will ensure that the pump is mechanically decoupled from the center cube to avoid loads on the copper seals induced by the mounting itself. The pressure of the vacuum is monitored by a Pfeiffer IKR270 cold cathode vacuum gauge. Cold cathode gauges are basically small ion-pumps, which ionize the residual gas and measure the current between cathode and anode caused by the ions. The higher the pressure, the more gas molecules are present, the more ions are produced, the higher is the current. Unfortunately movement of the electrodes due to vibrational loads will falsify the measurement. However the gauge is just a tool to have a fast measurement of the pressure for troubleshooting purposes. An very accurate measurement of the pressure in the science chamber can be achieved by measuring the lifetime of the BEC, which is strongly depending on the residual gas pressure in the science chamber [Sei14]. The last component of the vacuum system mounted onto the upper instruments platform of the physics package is an electronic stack, which operates the gauge and ion getter pump. It is equipped with an independent battery to keep the ion pump running, even if the main battery is disconnected, as for example during transport of the payload or arming of the motors in the launch tower.
PAYLOAD SETUP AND MECHANICAL DESIGN
112
7.3.3 Experiment Chamber The experiment chamber consists of the science chamber (3D-MOT), the preparation chamber (2D+ -MOT) and the atom chip holder. All three parts are manufactured from Grade 5 titanium (Ti6Al4V), which is considered highly nonmagnetic and of low magnetic susceptibility. This reduces time varying residual magnetic fields within the shielding. Rubidium Oven Titanium Sublimation Pump
Chip Holder UHV Feedthrough
Preperation Chamber
477,00
Fluorescence CCD Camera Chip UHVFeedthrough
Absorption CCD Camera Science Chamber with Atomchip
Ø387,00
Figure 7.26: MAIUS-1 experiment chamber equipped with coils, telescopes, Rb-oven, two detection cameras
In both the science and the preparation chamber adhesive indium wire is used to mount the windows directly into the associated pockets in the chamber by applying pressure to the window and compressing the indium wire. Indium has been chosen instead of commercial CF optical ports to reduce the size of the chambers and allow rectangular window geometries. The connection between the science chamber and the atom chip holder is not compatible with standard con-flat sizes, thus it is sealed using the same technology. A two-chamber system is common state-of-the-art for BEC creation and used in e.g. the experiments I.C.E or QUANTUS-2 as described in section 3.2 and 3.4. The atoms will be pre-cooled in the preparation chamber, transfered to the science chamber. In here the atoms are cooled to an optical molasses and subsequently caught in a magneto optical trap (MOT) formed by light fields and the magnetic potentials provided by external coils and the multi-layer atomchip. From the caught atoms, the BEC is generated by evaporatively cooling the atoms below their critical temperature. Ultimately light pulse atom interferometry is performed in the science chamber. In the following the setup of both chambers and the concept of a 2D+ -MOT should be described in a more detailed way. For details on the cooling procedure in general refer section 1.2.
Physics Package
113
Preparation Chamber As mentioned above the Rubidium atoms should be pre-cooled within the preparation chamber. The gaseous Rubidium atoms are provided to the preparation chamber by an oven, which vaporizes liquid rubidium. Subsequently the rubidium vapor is caught in a two-dimensional magneto optical trap.
Figure 7.27: Assembly of preparation chamber showing the attached telescopes, coils and laser beam paths for two-dimensional trapping and pre-cooling of the atoms.
For this purpose the 2D+ -MOT offers four rectangular optical ports. As presented in figure 7.27 the light for the MOT is shown in by two perpendicular telescopes through two windows with a size of 30 mm x 58 mm each. The light from the telescope is sent through a beam splitter and a prism forming two parallel beams with the same diameter of 18 mm. These two pairs of parallel MOT beams are reflected by a mirror mounted behind the opposite window. By the use of mirrors, a second pair of telescopes and fibres is not necessary, which reduces the size of the chamber and the laser distribution module significantly. Each of the four optical ports is equipped with a rectangular magnetic coil, with 64 windings of 0.8 mm copper wire equally distributed on 8 layers wound onto an aluminum body. The four coils form a two-dimensional quadrupole magnetic field. The opposing coils have been wired to create a magnetic field with zero-crossing along the symmetric axis of the preparation chamber. The aluminum coil bodies are also used to mount the two MOT-telescopes. Moreover a third telescope, used to apply a retarder beam, is attached to one of the coil bodies next to the mirror. As shown in figure 7.27 the optical port of the retarder has to increased in size (window size of 66 mm x 30 mm) to offer enough space to shine in the additional beam with a diameter of 9 mm next to the mirrored 2D-MOT beams. An additional circular window with a diameter of 22 mm is forming an optical port at the back of the chamber. This port provides access to the pusher beam completing the 2D+ -MOT setup.
PAYLOAD SETUP AND MECHANICAL DESIGN
114
As shown in figure 7.28a a differential pumping stage (DPS) is mounted between the preparation and science chamber. A DPS is basically a baffle with small conductance, which allows high vapor pressure of Rubidium in the preparation chamber to rapidly capture high numbers of atoms but only a low vapor pressure in the science chamber to prevent atom losses because of collisions of the trapped atoms with the background gas. This small conductance is achieved by a conical bore hole with a diameter of 1.5 mm at the inlet side with the higher pressure (preparation chamber) and 8.8 mm at the outlet facing the science chamber. Moreover a graphite inlay is mounted into the pumping stage. This material has a high surface area and absorbs a high percentage of the rubidium atoms if they get into contact with the graphite walls. The performance of the DPS has been optimized by the use of Monte-Carlo-Simulations in [Sei14]. M14x1 thread Silver brazing Differential Pumping Stage (DPS)
M16x1 thread
Graphite inlay Polished surface
Nut for inlay mounting M14x1 Jam nut
(a) Differential Pumping Stage (DPS) overview
(b) Polished DPS integrated in preparation chamber
Figure 7.28: MAIUS-1 differential pumping stage (DPS)
The body of the differential pumping stage is made of oxygen free copper (Luvata OFEOK) and equipped with an external M14x1 fine thread, which is screwed into the associated thread in the preparation chamber. The end, which protrudes into the 2D-MOT forms a 45◦ plane which has been polished to high reflectivity (figure 7.28b). This plane is aligned to the telescope for the retarder beam. Once the mirror surface has been aligned its position is fixed with a M14 jam nut. The retarder beam is deflected from the polished differential pumping stage to point opposite to the pusher beam. Since the hole in the center of the differential pumping stage is of low reflectivity, no light will be deflected in this region. The deflected light will retard
Physics Package
115
all atoms, but those in the cylindric region above the hole in the DPS. Thus the pusher beam will inject a concentrated beam of atoms in the differential pumping stage and along into the science chamber. This will allow to achieve loading rates of the 3D-MOT of up to 3.6 × 10⁹ atoms/s [Sei14], which is beneficial since they will enlarge the number of experiments that can be performed in the time of micro-gravity available. The needed circular σ+ -σ− polarization (refer section 1.2.2) of an opposing pair of 2DMOT beams is achieved by a λ /4-plate placed between the telescope and the window, which will induce a circular polarization of the beam (σ+ -beam). The previously mentioned mirror is actually a λ /4-plate equipped with a anti-reflective coating at the side facing the window and with a highly reflective coating at the side facing away from the chamber. Therefore it will convert the entering σ+ -light into a linear polarized beam, being reflected at the other side and converted to a circular polarization again when passing the λ /4-plate a second time after reflection (σ− -beam). In combination with the magnetic field of the rectangular coils, which create a quadropole field that switches its sign in the center of the chamber a suitable configuration for magneto optical trapping is achieved. The outside of the windows of the optical ports is equipped with the same anti-reflective coating as the λ /4-mirror. At the inside the windows are not coated, because the coating might interact with rubidium [Sei14]. The coating of the windows has been carried out by Laseroptik Garbsen and will ensure that light shone in under an angle of 0◦ (perpendicular to the window) with wavelengths ranging from 767 nm to 1000 nm is not reflected at the windows. The wide spectrum coating will allow using not only 780 nm light for rubidium transition but also other wavelength for future experiments. The windows themselves are made from Schott N-BK7 glass with a strength of 5 mm, which is used due to its coefficient of thermal expansion of α20 ◦C/300 ◦C = 8.3 × 10⁻⁶ K−1 [Sch13]. This is very close to the coefficient of grade 5 titanium (α20 ◦C = 8.9 × 10⁻⁶ K−1 [Thy]). The matched coefficient of thermal expansion of the chamber and the windows will reduce stress in the windows induced by temperature fluctuations. Especially deformations such as buckling should be prevented to guarantee stable optical properties of the windows. For this reason the pockets accommodating the windows are designed to be 1 mm larger than the windows themselves. The given gap of 0.5 mm at each side is sufficient for a mismatch of the coefficient of thermal expansion of Δα = 0.6 × 10⁻⁶ K−1 . The mismatch will lead to a negligible reduction of the gap by a maximum of 0.000 396 mm (window with l0 = 66 mm) if the temperatures will stay in the requirements of ±5 K (ΔT = 10 K) as defined in section 6.5. At the back end of the preparation chamber two CF16 ports and two CF10 ports offer additional interfaces. The rubidium oven is attached to one of the CF16 ports, while the second port is used to connect the roughening pump via a copper pinch off tube during vacuum preparation as described in section 7.3.2. The CF10 ports are not used and closed with blind flanges. They may be used in future experiments for additional atom sources.
PAYLOAD SETUP AND MECHANICAL DESIGN
116 Science Chamber
The science chamber is used for the preparation of BECs and to perform atom interferometry. The needed magnetic and light fields ar applied by seven telescope, a set of six external coils and the printed circuits of an atomchip as described in section 7.3.4. Front window
z-coil Flange to atomchip holder
R32, 00
86,00
102,00
CF16 flange
Preparation chamber interface
X
X 86,00 Z
Y
Figure 7.29: Science chamber geometry with a pair of magnetic coils wound onto the chamber
As shown in figure 7.29 a pair of coils (z-coils) is directly wound onto the chamber, which is requiring a cylindric shape at the front and the rear of the chamber. The maximum outer diameter of this cylindric part is 102 mm. The inside of the chamber is of cylindric shape as well measuring 64 mm in diameter. Between the coils the chamber is offering eight planar faces of the same width forming an octagon. Six of these faces are equipped with circular optical ports with a diameter of 30 mm. The two faces along the y-axis are used to establish a connection to the preparation chamber and to the pumping system outside of the magnetic shielding. At the front of the chamber a large view port with a diameter of 86 mm is installed. At the opposing side a custom made flange will establish the connection to the atom chip mount. This flange is sealed using indium wire to keep the chamber design small. Moreover commercial con-flat seals are not available in a suitable size. All windows of the optical ports are sealed with indium as well for the same reason. As the windows of the preparation chamber, the windows of the science chamber are manufactured from Schott N-BK7 glass. While the 30 mm windows are made from glass with a thickness of 5 mm, the large window is manufactured from material with a strength of 10 mm. All preparation chamber windows have been coated from both sides with the Laseroptik 767 nm-1000 nm 0◦ coating also used in the preparation chamber.
Physics Package
117
The laser light for 3D trapping is shown in through the front window under an angle of 45◦ and through the two smaller ports on the side of the chamber along the x-axis. The light shown in through the front window is mirrored at the chip surface. Since the mirrored beams are perpendicular to each other, they cover two axis of freedom. The third dimension is covered by the telescopes along the x-axis. The MOT light is shown in using the same telescopes as for 2D trapping. As shown in figure 7.30B these telescopes are equipped with a λ /4-plate placed after the fiber coupler, which is causing a circular polarization of the light as needed for magneto optical trapping (refer section 1.2.2). A combination of a converging and diverging lens will produce a collimated beam with a diameter of 18 mm in a shorter telescopes compared to a single lens configuration.
Figure 7.30: Three types of telescopes used in MAIUS-1 for the magneto-optical trap (MOT), the interferometry and for the pusher and retarder beam at the 2D-MOT.
Within the atom interferometry and detection telescopes (Ref. C in figure 7.30) one aspherical converging lens is used instead to reduce aberration. Thus the telescopes are longer and the collimated beam measures only 12mm in diameter. The interferometry and detection telescopes are attached to the remaining optical ports as shown in figure 7.31 forming two perpendicular axes which are rotated by 45◦ to the x-axis. All telescopes have been designed and qualified for sounding rocket use by the Leibniz University of Hanover [Lac12] [Sei14]. Aside from 7 telescopes and the atom chip mount, two cameras and optics for detection and two pairs of coils are mounted to the science chamber as illustrated in figure 7.31. Two different detection techniques are used in the MAIUS-1 setup. Therefore two cameras are required. The PCO 1400 camera is used for both imaging techniques. For the absorption imaging method a light pulse is shown in through the detection telescope, this light pulse will create a shadow image of the atomic cloud on the CCD of the camera.
PAYLOAD SETUP AND MECHANICAL DESIGN
118
Since the atoms of the cloud will absorb photons of the detection light pulse, the BEC will be destroyed when taking an absorption image. The light not absorbed by the atoms is sent through the opposite viewport into a system of two lenses and two mirrors ending at the absorption camera mounted to the base plate of the chamber mounting. x-coils
Titanium bellow
3D-MOT telescope #3
Detection mirror #1 Detection lens #2
Interferometry telescope #2 Absorption camera
fluorescence detection (CCD camera & optics)
Detection mirror #2 Detection lens #1 3D-MOT telescope #2 3D-MOT telescope #1
Interferometry telescope #1
Detection telescope z-coils
Y y-coils Z
3D-MOT telescope #4
Y
X
Figure 7.31: Fully assembled science chamber. Seven collimators, three pairs of coils and two cameras are attached to the science chamber.
The lenses used offer a focal length (f) of 60 mm. The first lens is positioned 60 mm from the center of the chamber. Thus the BEC is in the focal point of the first lens, while the CCD of the camera is in the focal point of the second lens. The distance between the first and the second lens was chosen to be 120 mm (2f). Thus the total length of the optical path is 240 mm. The beam hat to be mirrored twice to make the chamber setup compact and to fit it into the magnetic shielding. A second camera of the same type will take fluorescence images of the atoms. This method is measuring the photons emitted by the atoms of the BEC, which are illuminated by light from either the detection or the interferometry telescopes. The camera is mounted in front of the large view port with a distance of 53 mm between the CCD and the atoms of the BEC. The light is projected by a single aspheric lens with a focal length of 26.5 mm onto the CCD of the camera. In addition to the previously mentioned z-coils, which are wound directly onto the science chamber, two more pairs of coils are needed to trap the atoms in all three directions of space. These coils are mounted to the science chamber, the atom chip holder and the chamber mounting in a Helmholtz configuration as shown in figure 7.31. The body of these coils is made from fiberglass (ROTEK GFK-HGW2372.4). This material is offering low density, high tensile strength and most importantly it is non-conductive. Non-conductivity will allow shorter switching times of the coils because no eddy currents will be induced in the coil body.
Physics Package
119
All three coils are wound manually using a copper wire with a diameter of 0.95 mm, which is electrically isolated by a layer of kapton coating. The diameter of the different coils, the windings, the measured and calculated resistance and the expected power consumption at the maximum output of the current driver (5 A) is given in table 7.4. Pair of coils Inner diameter in mm Inner dimension in mm Windings Resistance (meas.) in Ω Thermal Power (Imax = 5 A) in W
X
Y
156 N/A 21 0.4 10
120 N/A 102 1.0 25
Z
2D
94 N/A N/A 40 x 76 30 64 0.5 0.53 12.5 13.25
Table 7.4: Specifications of the science and preparation chamber coils. Resistance measured by a multimeter. Induced thermal power calculated for typical and maximum currents.
Although the calculated maximum dissipated heat is high, no active cooling is necessary to keep the chamber temperatures in the required ranges, because the typical operation currents of the coils are smaller than 5 A. Moreover the duty cycles are typically in the order of 100 ms to 1000 ms, thus no significant heating of the chamber will occur. A detailed thermal simulation of the science and preparation chamber including the heating by the atom chip and the oven has been performed in this thesis. The simulation setup and the results are presented in section 12.3. Mechanical simulations have been performed to analyze the connection between science and preparation chamber. These two parts are brazed using a silver foil. In the predecessor experiment this connection was sealed using an indium wire as well. Unfortunately the sealing failed during the first vibration test. The mass of the preparation chamber in combination with a long lever between the center of gravity of the preparation chamber and the sealing caused high loads on the small area of indium, which resulted in a breach of the seal. However the sealing of the windows and between the atom chip holder and the science chamber was successfully qualified for sounding rocket use (refer section 9.6). The brazing process, which was developed by the Günter-Köhler-Institut (IfW) Jena, is using a 100 μm thick brazing foil made of pure silver. The foil was cut to fit the contact area between both parts. This will create a brazed joint covering the whole contact area, which will reduce the risk of virtual leaks. Such leaks would occur if small gaps filled with air will remain at the joint and the air is slowly conducted in the vacuum chamber. The danger of virtual leaks was one reason for not using welding to establish this connection. The mechanical properties of a silver brazed joint were studied by the IfW to ensure that the joint will withstand the mechanical loads aboard the sounding rocket. For this purpose two circular titanium tensile test probes with a diameter 4.51 mm and a length of 40 mm were prepared with the same process parameters as used for brazing the science and preparation chamber.
120
PAYLOAD SETUP AND MECHANICAL DESIGN
Sample 2
Stress in MPa
Sample 1
Strain in mm
5.00mm
4.51mm
40.00mm
(a) FEM simulation setup and results of the (b) Results of a one-dimensional tensile test of preparation chamber at 100g a silver-brazed circular probe performed at IfW Jena [Hor12] Figure 7.32: FEM simulation and tensile test results for the brazed connection between science and preparation chamber
Figure 7.32b shows the probe after the test and the test results. An average tensile strength of Rm = 456.25 MPa was measured in two test runs [Hor12]. The yield strength is estimated to be 300 MPa from the change in the slope of the curves in diagram 7.32b. The overall mass of the preparation chamber including telescopes, windows, oven and coils is 2.98 kg. The resulting force of this mass at an acceleration of 100 g (hard touch down) is 2924.5 N. To simulate a worst case scenario the force application point was chosen to be at the top of the preparation chamber as illustrated in figure 7.32a. Moreover a fixed support has been simulated at two telescopes and the connection to the atom chip holder. This is a simplification of the actual mounting of the experiment chamber as it is described in section 7.3.6. As expected the maximum stress is induced at the connection between preparation and science chamber. The von-Miese equivalent stress intensity is simulated to be 205 MPa, which is significantly below the tensile and yield strength of the material. Simulations at 13 g acceleration (ascent peak loads) resulted in a stress intensity of 26.8 MPa. Finally the brazed chamber has been successfully vibration tested without shock mounts at 8.1grms . Thus a failure of the brazed joint during ascent and even during touch down is very unlikely.
Physics Package
121
7.3.4 Atomchip The atomchip is a key feature for reducing the size of the experiment chamber. It is used to generate inhomogeneous magnetic fields, which are superimposed to the fields of the regular magnetic coils. Aside from its small size the advantages of an atom chip are its low power consumption and fast switching times of the generated magnetic fields compared to other methods [Ste09]. The chip is capable of forming various magnetic trap geometries by applying current to the different circuits of the chip layers. A detailed description of the chip performance and its structures is given in [Sei14]. Custom-made titanium sublimation pump
Science chip
Base chip
Mesoscopic structures
Titanium pipe with filter
Indium sealed flange
Cooper mount
Atomchip cooper mount
CF40 UHV ceramic feed throughs
(a) Atomchip with its three layers (b) Atomchip holder with titanium sublimation pump and an microwave antenna integrated and UHV feedthroughs in the base chip layer. Figure 7.33: Atomchip assembly of MAIUS-1
As shown in figure 7.33a the chip consists of three different structures, which decrease in conductor diameter and are mounted to each other with UHV suitable glue with a high thermal conductivity (Epotek H77). While the lowest layer consist of mesoscopic structures (0.6 mm copper wire), the science and the base chip are fabricated from aluminum nitrate substrate with printed circuits made of gold. The printed circuits are of rectangular shape with a height of 0.01 mm and a width of 0.5 mm at the base chip and 0.05 mm at the science chip. Additionally three RF antennas are included in the base chip setup to apply RF signals during evaporation. The science chip is equipped with a layer of high reflectivity forming the mirror for the MOT beams as described in section 7.3.3.
PAYLOAD SETUP AND MECHANICAL DESIGN
122
The measured resistances of different structures of the chip is given in table 7.5. Moreover the thermal power generated in the chip at maximum currents is given for different circuit structures. The heat flux generated by the chip and the coils described above is part of the thermal simulation of the experiment chamber presented in section 12.3. Chip Structure
Resistance (mes.) in Ω
Current (max.) in A
Power (max) in W
Meso. U Meso I/H Base outer Z Science outer Z
0.125 0.070 0.150 0.700
10 10 6 2
12.5 7 5.4 2.8
Table 7.5: Resistance (measuread) and power consumption of the mesoscopic (U/I/H) and the base and science (Z) atomchip structures.
The conductors of the chip will dissipate their heat rapidly to the copper mount, because the aluminum nitrate substrate as well as the glue offers high thermal conductivity. Thus the chip itself will not heat significantly. The copper mount is made of oxygen-free copper (Luvata OFE-OK), which offers a high thermal conductivity of 391 W m−1 K−1 [Luv14]. To ensure that the produced heat is conducted to the titanium atom chip holder, the dimensions of the lower cylindrical part of the copper mount and the associated bore hole are designed to be a cylindrical interference fit. Once the atomchip is fitted and screwed to the holder, the assembly is mounted to the science chamber with the atom chip protruding into the science chamber. The connection between the atom chip holder and the science chamber will be sealed using indium wire. As shown in figure 7.33b the structure opposite to the flange is of cubic shape. This cube is equipped with a total of five CF40 ports. Four of those are reserved to highly non magnetic UHV feedthroughs (SRI SD5001-9s and D5002-2-15) to connect the atom chip structures with the current drivers. The connection between the feedthroughs and the chip is achieved using vacuum-suitable wires, which are glued to the chip circuit-ends with electro-conductive glue. The fifth port is occupied by an additional customized titanium sublimation pump, which should especially compensate for the large surface of the cables between atom chip and feedthroughs. This surface area might lead to a rise in pressure although the cables are designed to have a low out-gassing rate. The filaments and thus the performance of the customized pump is identical with the pump described in section 7.3.2. The feedthroughs of the commercial pump may induce magnetic fields due to small amounts of iron and brass used in the contacts. Because the pump is positioned inside the magnetic shield and close to the atoms, this feedthrough has been replaced by a non-magnetizable feedthrough.
Physics Package
123
7.3.5 Rubidium Oven The alkali metal isotope Rubidium 87 is used in the MAIUS-1 atom interferometer. Natural rubidium is composed of the two isotopes 85Rb (72.2 %) and the slightly radioactive 87Rb (27.8 %). Isolating 87Rb would be very expensive, thus rubidium is usually sold in the natural compound in glas ampules. Because rubidium is very reactive, especially with water, these ampules are filled with a noble gas as helium or argon. The metal is sold in a solid form at room temperature, as its melting point is 39.31 ◦C [Ste03]. Rb-ampule
Stabilizing housing
CF16 metal gasket CF16 bellow Upper ampule holder
Sintered filter
Screw for cracking Mounting for filter
uncracked / uncompressed Lower ampule mount with rough filter
Blind flange Flange with radial and core threads
40,00
Heating wires
cracked / compressed
131,50
Figure 7.34: Rubidium oven using glass ampules filled with Rubidium, which is available of the shelf. The ampule is cracked in the vacuum by compressing the oven bellow. The figure shows the uncracked and cracked state of the oven.
To provide Rubidium for atom physics experiments, either a dispenser or an oven can be used. Dispenser dispense rubidium which is bound in chromate alloys by applying high currents, which heat the alloy. Unfortunately a lot of other atoms are dispensed along with Rubidium 87 and 85 isotopes during this procedure. These atoms will reduce the performance of the MOT and have to be removed from the system, which is especially difficult in MAIUS-1, because of the differential pumping stage reducing the conductance between the preparation chamber and the pumping system. Due to these disadvantages a Rubidium oven has been chosen as atom source in MAIUS1. Since no commercial solutions are available, the oven had to be designed from scratch. The most difficult part is to fill the Rubidium into the oven. Due to its high reactivity it may react with the water in the surrounding air if removed from its ampule. Filling the oven in an argon atmosphere (e.g. in a glove box) would be a possibility. This would require a
124
PAYLOAD SETUP AND MECHANICAL DESIGN
valve to hermetically seal the oven and open it once the oven is attached to the chamber and vacuum has been prepared. Obviously this is a complex and expensive procedure and the use of a valve would result in a rather bulky setup. Therefore opening the ampule in a container under vacuum, which is already attached to the preparation chamber is considered the easiest and safest way. As shown in figure 7.34 the oven design comprises four CF16 titanium parts. The center piece is a bellow forming the oven chamber. To both sides the bellow is followed by a CF16 flange, which is equipped with a thread at its core to mount the ampoule holders. Moreover these flanges are equipped with radial blind tapped holes to mount the bellow to the stabilizing housing. The setup is closed by a blind flange to the one side and attached to the preparation chamber on the other side. The rubidium ampule is mounted between the lower and upper ampule holder, while the system is under atmosphere. Afterwards the oven is attached to the preparation chamber and evacuated. The stabilizing housing will keep the flanges in their position and ensure that the bellow is not compressed due to the pressure difference. Once the oven should be activated the radial screws at the upper flange are removed, which will cause the bellow to compress. By turning the screw at the back of the housing clockwise additional force can be applied to crack the glass ampule. The stabilizing housing will assure that the force is only applied axially and no momentum is acting on the seals. Once the rubidium has been released, it is heated and vaporized by a resistance heater. The heater consists of 0.25 mm copper wire, which has been wound onto the bellow in two layers. Because the second layer is wound in opposite direction with the same number of windings, the magnetic fields induced by the first layer are compensated by the second one. The measured resistance of the wire is 8.77 Ω. Thus the oven will be heated with 2.85 W if operated at a typical voltage of 5 V. This heat input has also been considered in the thermal simulation of the science chamber in section 12.3. To prevent the liquid rubidium from floating into the preparation chamber a sintered filter (ggt Gleittechnik Ag CA200) has been included in the flange between the bellow and the preparation chamber. To qualify the functionality of the oven the partial pressure of rubidium has been measured with a mass spectrometer prior to the installation of the oven at the chamber in a test setup. Heating the oven to 65 ◦C results in a rise of the partial pressure of Rubidium from 1 × 10⁻¹⁰ hPa (20 ◦C) to 4 × 10⁻⁷ hPa (65 ◦C). The performance was identical after the test chamber was tested under vibrational loads. Moreover no rubidium particles have been observed in the test chamber. Thus no liquid rubidium entered the chamber before or during the vibration test. Finally the oven was put into operation successfully in the MAIUS-1 apparatus on ground [Sei14].
Physics Package
125
7.3.6 Mounting of Science and Preparation Chamber Mounting of the experiment chamber is difficult because of the complexity of the system and the large number of instruments attached to it. The mounting has to be rigid and should provide access to all sides of the experiment chamber. Moreover the chamber should only be mounted through the top caps of the magnetic shielding to the upper instruments platform, because the magnetic shield should not carry any loads (refer section 7.3.1). 11x P5,30 THRU for mounting baseplate to instrument platform
Fluorescence stand
Interferometry stand
Upper and lower y-coil mount Rear stand (and extension bracket) y-coil 6 x P4,50 THRU DIN 74 for camera bracket
Strengthening ring
Absorption stand Baseplate
Mounting of bracket 4x M4x12 ISO 10642
Instrument platform
Mounting of Baseplate 11 x M5x40 ISO 4762
Figure 7.35: Support structure for mounting of experiment chamber and associate instruments to the upper instruments platform. The lower y-coil is integrated into the mounting to make the setup more compact.
To avoid additional holes in the magnetic shield 11 M5 ISO 4762 titanium screws with a length of 40 mm are used for simultaneous mounting of the shield and the baseplate of a support frame to the upper instruments platform of the physics package. As shown in figure 7.35 four stands, five brackets, a coil, a strengthening ring and a baseplate are forming this support frame for mounting the experiment chamber. All stands and an additional bracket for mounting of the absorption detection camera (not shown) are screwed to the baseplate from below with ISO 10642 countersink screws. Moreover a mirror mount being part of the absorption detection optics is mounted directly to the baseplate. The baseplate is made of aluminum and 6 mm strong. The strengthening ring is manufactured from aluminum as well. It consists of two parts, which have been anodized. This should prevent induction of eddy currents, which would enlarge coil switching times. The four aluminum stands are all of similar shape. The U-profile should enlarge the bending stiffness of the stands. All of these stands have the same footprint with a width of 70 mm and a depth of 28 mm as shown in figure 7.36. Four M4 threads strengthened with Helicoils are used to mount the stand to the baseplate. The strengthening ring is fixed in its position by two M3 screws mounted from inside the stand. Subsequently the 6 M3
PAYLOAD SETUP AND MECHANICAL DESIGN
126
threaded holes at the top of the stand are used to mount the coil and the side brackets to the stands from the top. The remaining M3 threaded holes at the sides are used to mount cables of photodiodes and coils to the structure. All but the rear stand are equipped with an oval hole as shown in figure 7.36. This hole measures 20 mm in radius and 70 mm in width. This size is sufficient to mount and adjust the telescopes even if the chamber is already integrated into the frame.
6H - ing) t 5 . x0 oun 3 m M 5x able s oil (c le ic H .7 ) 0 x te M4 pla x 4 ase (B
70,00
,00 R20
28,00
8,00
70,00
97,00
g nin
rin
g)
he r) gt n be U re m R TH g st 6H cha 0 / in 2 3, nt .5 - coil P ou 0 g x (m M3 tin 6x oun (m
3,00
Figure 7.36: Detailed drawing of the interferometry stand with dimensions. The big 20 mm cut-out is to access the 3D telescopes for maintenance or adjustments
The rear stand is equipped with an extension bracket, which is used to mount the experiment chamber to the stand. The rear mounting of the experiment chamber is shown in detail in figure 7.37. The connection is achieved by a total of eight M3 ISO 4762 screws, which are mounted to threaded holes in the atom chip holder being part of the experiment chamber. Four of the screws are used for the connection of the extension bracket and the atom chip holder, while the other four are mounted through the rear stand. The remaining three screws in the rear stand are attaching the strengthening ring to the stand. In addition to the rear mount, two side mount brackets will support the experiment chamber. These brackets are mounted to the interferometry and absorption stand through the lower y-coil and the strengthening ring by five M5 ISO 4762 screws. The connection to the chamber is achieved by four additional M3 screws, which are mounted through the telescopes as shown in figure 7.36. The fluorescence stand is longer than the other three stands. It carries the fluorescence camera and its optics, which are positioned in front of the front window with the center of the lens aligned to be in line with the middle of the atom chip. This allows to capture good
Physics Package
127
images, since the center of the magnetic trap (and thus the atoms) will be in the middle of the chip at the beginning of the sequences as well. Moreover the stand is equipped with two additional brackets to support the upper and lower y-coil. The lower bracket is equipped with seven 3.2 mm through holes to mount the bracket and the y-coil to the associated threads in the strengthening ring. The lower coil is mounted to all four stands in addition, since the coil and the strengthening ring will carry the mass of the experiment chamber. The upper coil is not carrying those loads. Thus it is only attached to the atom chip holder by four M3 screws (y-coil mount #2 in figure 7.37) and to the upper bracket of the fluorescence stand by seven M3 screws (y-coil mount #2). Y-coil Mount #2
X-coil Mount #1
Y-coil Mount #1 X-coil Mount #2
Rearmount
Sidemount
X-coil Mount #3
Figure 7.37: Details of the complex mounting of two chambers and its accessories. The science chamber is mounted at three points, the two side and rear mounts. The coils are either directly screwed to the chamber or to the support structure.
The x-coils are of lower mass and are only carrying a light aluminum structure for alignment of the 45◦ -MOT telescopes, thus they are only mounted by five M3 screws at three different points as shown in figure 7.37. As mentioned in section 6.4 it is important that the position of the telescopes or coils will not change after launch to maintain a setup identical to the one on ground. This means that no plastic deformations should occur in the support frame. For this reason all aluminum parts of the frame are made from CERTAL (EN AW 7022) combining high tensile strength (555 MPa) and yield strength (495 MPa) with a low density. The frame has been designed to withstand loads of up to 50 g without plastic deformation using FEM simulations.
128
PAYLOAD SETUP AND MECHANICAL DESIGN
7.4 Laser System The laser light used for laser cooling, atomic state preparation, atom interferometry and detection is generated within a diode laser based system integrated in a compact housing. Despite the limited volume the housing shelters multiple subsystems. As given in diagram 7.38 these are eight micro-integrated diode laser modules (A-C), a distribution and switching unit (D) based on free-space Zerodur optical bench technology, a Rubidium stabilization unit (E) as well as two fiber splitter systems (F-G).
Figure 7.38: Functional diagram of MAIUS-1 laser system showing four science lasers (A), two (cold) redundancy lasers (B), two technology demonstration lasers (C), the free-space splitting and distribution board (D) and two fiber splitters (F&G). The connection between those components is realized with polarization maintaining fibers [Kru].
The guidance of laser light inside the laser system housing as well as to the physics package is realized with polarization maintaining optical fibers. This guarantees optimal overlapping of laser beams of each frequency as well as reliable and efficient guidance of laser light even in the harsh rocket environment.
Laser System
129
7.4.1 Laser Modules The laser modules used in MAIUS are based on a versatile platform comprising semiconductor, micro-optics and electronic interfaces altogether assembled onto very robust micro-optical benches (MIOBs). These modules are explicitly designed for rubidium BEC and atom interferometry experiments aboard sounding rockets and feature single distributed feedback (DFB) based master oscillators (MO) or master oscillator power amplifier (MOPA) setups. B-B B
Micro optical bench (Miob)
Fibre coupler
42,00
B
Peltier Element
Cooper Mount
104,00
Figure 7.39: MAIUS laser modules consisting of a copper mount, the micro optical bench with the laser diode and a tapered amplifier as well as a fiber coupling. A peltier element stabilizes the temperature of the entire setup.
For operating the MAIUS experiment, four science laser modules are foreseen. The master laser is a DFB laser diode only, whereas the three light sources for 2D/3D MOT, Bragg interferometry and detection are DFB-based MOPA modules with a tapered amplifier section featuring free-space output powers of about 1 W at 780 nm. The remaining four modules comprise two redundancy MOPA modules and two micro-integrated extended cavity diode laser (ECDL), which have been added as technology demonstrator for future satellite-based missions targeting at high precision tests of general relativity [Agu14]. The micro-optical bench is glued onto a aluminum nitride plate which combines low thermal expansion with high thermal conductivity. The light emitted by the amplifier on the MIOB is shown into a Zerodur based fiber coupler, which is adhesively bonded onto the aluminum-nitride plate as shown in figure 7.39. The AlN plate is clamped onto a copper mount measuring 104 mm x 42 mm. The master oscillator frequency is adjusted by modulating the current sent through the DFB laser oscillator. Additionally, the frequency strongly depends on the temperature of the oscillator. Moreover the coupling efficiency of the fiber coupler might decrease due to temperature changes of the laser module assembly. Thus the aluminum-nitride plate and the MIOB need to be temperature controlled with an accuracy of ±0.1 K. For ECDL lasers the volume holographic bragg grating (VHBG) of the laser needs to be controlled with an accuracy of ±0.01 K. To achieve this high accuracy the copper mount and thus the aluminum-nitride plate is temperature controlled by a "TCH" peltier element provided by the German company Dr. Neumann. For the two ECDL laser modules an additional micro peltier element is added
PAYLOAD SETUP AND MECHANICAL DESIGN
130
to the setup to control the VHBG temperature. The ECDL and DFB laser modules will typically dissipate around 6 W into the payload. The efficiency of the peltier and thus the overall dissipated heat is depending on the difference between the set-point temperature on the laser chip and the heat sink temperature. This aspect will be discussed and included in the overall thermal simulation presented in section 12.4.
7.4.2 Distribution and switching unit The distribution and switching unit manipulates the laser light delivered by the laser modules such that it can be efficiently used for laser cooling, manipulation and detection of atoms. This includes splitting the lasers output beams into an appropriate number of beams as well as intensity modulation and frequency shifts. Shutter
Fibre coupler
Acousto-optic Modulator (AOM)
Mirror
68,50 50,00
180,00
Zerodur Baseplate
210,00
Figure 7.40: Zerodur-based distribution- and splitting-module of MAIUS-1
To achieve this, the module features free space polarization optics, shutters and acoustooptic modulators (AOMs) mounted on a Zerodur board. Schotts Zerodur is used because it offers a coefficient of thermal expansion close to zero (≤ 0.020 × 10⁻⁶ K−1 [Sch13]). Thus no temperature induced change of the position of the optical components will occur, which is important to ensure that the distributed light intensities will not vary with temperature. As shown in figure 7.40 the Zerodur base plate measures 180 mm x 210 mm x 50 mm. It is mounted to the heat sink by 11 M5 ISO 4762 screws. To compensate for unevenness or other imperfections (as e.g. burr) of the heat sink surface, a rubber mat is placed between the Zerodur board and the laser system heat sink. This will avoid high punctual loads on the glass, which might cause mechanical failure of the glass if the screws are torqued. For the same reason plastic washers are placed between the glass sink holes and the screw hats. Due to the rubber mat and the small thermal conductivity of Zerodur of 1.46 W m−1 K−1
Laser System
131
the AOMs (Crystal Technology AOMO 3080-122) and shutter (Faulhaber AM 1524-V-635-05) are not thermally connected to the heat sink. The dissipated heat of the AOMs (1W) and the shutters (0.9W) will be stored in the Zerodur itself. The heat input by these components to the heat sink is negligible, because of its short operation times. However these components are also included into the thermal simulation presented in section 12.4.
7.4.3 Spectroscopy Unit The components of the spectroscopy unit (Rb-Beat module) are mounted to a small Zerodur optical bench with free space optics. This module will ensure that the master laser is locked to an atomic transition of Rubidium, which is crucial for the success of the experiment, because the three slave lasers are locked with reference to the master laser. Photodiode
35,00
Zerodur Baseplate
40,00
Rubidium Cell
20,00
Fibre Coupler
105,00
Figure 7.41: Zerodur-based spectroskopy module of MAIUS-1
The locking of the master laser is achieved by frequency modulation spectroscopy as described in detail in [Dun13] using a Rubidium vapor cell and two fast photodiodes. Expressed in simplified terms the laser light of the master laser is guided onto the board through the fiber coupler and sent through a glass cell filled with rubidium vapor, while the laser frequency is modulated. As soon as the transition frequency is approached light is absorbed by the rubidium atoms and a signal can be detected on the photodiodes indicating the desired laser frequency. These photodiodes are mounted with two small printed circuits boards to the sides of the Zerodur baseplate as shown in figure 7.41. The vapor cell has to be kept at room temperature (20 ◦C to 30 ◦C) and to be protected from magnetic fields. To ensure the latter, the cell is wrapped into MUMETALL foil. No heating is necessary due to the sufficient background vapor pressure of Rubidium at room temperature. The vapor cell, the fiber coupler and the remaining optical components are adhesively bonded to the Zerodur baseplate. This Zerodur board measures 40 mm x 105 mm x 20 mm and is mounted with six ISO 4762 M5 screws using the same technique as for the larger Zerodur board.
PAYLOAD SETUP AND MECHANICAL DESIGN
132
7.4.4 Laser Housing The laser system is integrated in a compact housing measuring 274 mm x 340 mm x 226.50 mm. The housing is equipped with double walls. The air between the two aluminum parts of the walls insulates the interior of the housing from the atmosphere inside the payload and thus protects the sensitive laser modules and optics. This is necessary, because the dissipated heat of the electronic system and aerodynamic friction will heat the air inside the payload during flight (refer chapter 11). Electronic interface PCB
Rb-Beat module Photodiodes
Electronics
Splitting and distribution module Thermally insulated housing
226,50
optical fibre feedthrough
Water cooling in- & outlet
274,00
340,00
Laser module (in housing)
Figure 7.42: Laser system components integrated in housing. The components are mounted to a solid water-cooled aluminium heatsink. The walls of the housing consist of two parts with a air-filled gap in between for insulation purposes.
The two smaller walls of the housing are close to the cable ducts of the payload. For this reason all interfaces have been integrated into those walls. The electrical interface to the laser modules is formed by a printed circuit board, which is integrated in the wall behind each laser module. The electrical interface of the remaining components such as thermal sensors, photodiodes, AOMs or shutters is implemented with standard DSUB connectors. High frequency signals are fed through the walls by SMA feedthroughs, which are electrical insulated from the walls to avoid interferences. All cables connected to these interfaces are guided to the electronic system or batteries. Moreover two holes with a diameter of 14 mm that are equipped with a rubber protection form a feedthrough for the optical fibres routed to the physical package. Last the two copper pipes of the heat sink are fed through the wall. The copper pipes are connected with a Swagelok hose by an elbow connector. The hose will establish a connection to the upper umbilical, which will provide water for cooling of the heat sink until lift-off. The massive aluminum heat sink is forming the center of the housing. All components mentioned above are mounted to this heat sink. The heat sink consists of two parts with a total mass of 7.30 kg, which are connected by 21 ISO10642 countersink screws. As shown in figure 7.43 the copper pipe is pressed between these two parts of the heat sink, which will ensure a good thermal contact.
Electronics System
133
250,00
Mounting of Plates (21x ISO10642 M5x25)
37,00
Plate with Lasermodules
316,00
Plate with Zerodur components
Mounting to Housing (18x ISO4762 M5x25)
Water Cooling (Cooper Pipe Ø10x1mm)
Figure 7.43: Heatsink design and water-cooling routing of MAIUS-1 laser system
The water cooling cycle will control the temperature of the laser heat sink to ±1 K. During flight the solid aluminium heat sink is capable of storing the heat generated by the components attached to the heat sink. The temperature of the heat sink rises by a maximum of 3 K as demonstrated in the simulation presented in section 12.4.
7.5 Electronics System The purpose of the electronics is to provide power and control to all components necessary for the realization of a Bose-Einstein condensate and for performing matter-wave interferometry. In order to reduce the size and mass of the payload most of the electronics are noncommercial components but have been developed by the Leibniz University of Hanover. A wide variety of electronic cards have been developed for the MAIUS mission and its predecessor the QUANTUS-2 drop tower experiment. For operation of the laser system temperature controller, current drivers, shutter drivers, frequency controllers, temperature and photodiode monitoring cards and even direct digital synthesis (DDS) boards have been realized. For physics package operation a high voltage (5 kV) pump controller, a gauge monitoring card and low noise atom chip and coil current drivers have been produced. An ethernet interface card is used for communication between the hardware and the onboard computer, which is a commercial IDAN system provided by RTD Embedded Technologies, Inc.
PAYLOAD SETUP AND MECHANICAL DESIGN
134
All of these electronic boards have a uniform size of 100 mmx100 mm and a standardized bus. The electronic boards are stacked in functional groups as shown in figure 7.45. Six of these stacks with a total of 58 boards are included into the electronic system. The height of these stacks is limited to 12 cards. Atomchip fuse box Payload separation patch panel Upper heatsink Water cooling in- & outlet Backup batteries
16,00
705,10
Electronic stacks
Lower heatsink
Current sensors Onboard computer
Figure 7.44: Overview on electronic system showing the water-cooled heat sinks at the top and bottom. Most of the electronic is in the TBUS-format developed by the University of Hanover. Those components are combined to functional stacks inside the electronic system housing.
Aside from the six electronic stacks, a modified commercial Ethernet switch, a reference oscillator card and 28 commercial radio frequency components are included in the housing. Moreover two types of batteries are placed inside the enclosure. The larger backup battery consists of three lithium iron phosphate (LiFePo4) cells of the type Headway 38120SE (3.3 V, 10 Ah). In addition to this a stack of seven boards with single-cell A123 ANR26650M1B (3.3 V, 2.5 Ah) LiFePo4 batteries, for supply of the chip and coil current drivers are part of the electronic system. These single cell batteries are electrically isolated from the remaining batteries to reduce the noise in the current driver output. Some late modifications in the payload concept, made it necessary to add components to the system after the housing was already in production. Thus a fusebox to protect the atomchip from currents above its rating and some inline current sensors were added outside the housing enclosure to the two heatsinks as shown in figure 7.44. Originally only the on-board computer should be mounted outside of the electronic housing to establish proper thermal contact to the lower heat sink to conduct the 19.1 W of dissipated heat. Due to the large amount of electronics needed and because of the dissipated heat, which requires a high heat sink mass for storing the heat during flight operation, the electronic system is the second largest system regarding mass and volume in the MAIUS scientific payload. The electronic system has a total mass of 66.2 kg and a length of 705.10 mm.
Electronics System
135
7.5.1 Mounting of Electronic Stacks The required stacked architecture makes it difficult to find a good mounting concept for the electronic boards. Especially the accessibility for maintenance or modifications is limited compared to slot-in solutions, which are often used for electronic boards. Unfortunately a re-design of existing boards was not possible due to the limited time in the project. Thus a mounting concept was elaborated for the existing card design. Laser current driver Threaded Bar M3x0.5
C Heat Pipe mounted to Backplane
Chip current driver
245,00
TO-220 Power SemiConductor Package PCB with high-power electronics Photodiode card LAN Board Power Supply Mounting Brackets for PCBs
C 220,00
14,00
Figure 7.45: Mounting concept for electronic card stacks and thermal interface to high power components on the cards
Figure 7.45 shows the mounting for two stacks with the maximum height. The boards offer four holes with a diameter of 3.2 mm for mounting with M3 threaded bars to a baseplate, which has been common practice in the predecessor experiment QUANTUS-2. Spacer between the boards and a jam nut at the top prevent vertical movement of the cards. For the MAIUS electronic system every second spacer is replaced by a printed circuit board (PCB) mounting bracket, which is mounted to a solid backplane from the outside as shown in the section view of figure 7.45. This increases the mechanical stability of the mounting significantly. The backplane also offers a good thermal interface to the remaining structure, which is serving as a heat sink for all electronic boards. While some boards dissipate so little heat, that they do not require a heat sink at all, some need a good thermal connection to ensure that the heat is conducted into the backplane and the temperature requirements are met. The chip current drivers are equipped with copper heat pipes, which will allow a transport of the heat dissipated in the high-power components on the printed circuit board to the backplane. Other cards use a different approach. The high-power electronics of the laser current driver and the power supply have simply been removed from the (main) PCB and have been attached directly to the backplane to ensure a good thermal connection.
PAYLOAD SETUP AND MECHANICAL DESIGN
136
7.5.2 Electronics Housing The electronics system housing consists of an upper and lower part, which are almost identical with respect to the structure elements. Each part consists of a circular baseplate, four solid walls, four side covers and a heat sink. The circular baseplate is measuring 458 mm in diameter, as the regular instrument platforms. It is also equipped with the same features as cable duct cut outs and mounting holes for rubber dampers and safety pins. Because of the large amount of cables, which will be connected to the electronic system the cable duct is spanning over 38◦ . Thus it is slightly bigger than the regular cable duct. The upper and lower baseplate are connected by 18 M5 ISO10642 countersink screws after mounting of the wall segments. A cable feedthrough will allow wiring between electronic components of the upper and lower part. The four solid walls are screwed to the baseplate with a total of 16 M5 ISO10642 countersink screws. The side covers are screwed to the associated pockets in the solid walls and will close the housing. The eight walls form an irregular octagon shape as shown in figure 7.46. All of the wall segment measure 245 mm in height and are made from aluminium EN-AW 7075. 115,00
Cable Feedthrough
Backplane (212,00)
Heat Sink
38° Patchpanel Wall
Side Cover
Backplane
245,00
Patchpanel (211,50)
S (11 ide C 6,0 ov 0) er
Baseplate
8,00
Backplane
2,50
14,00
10,00
R2 29 ,00
Figure 7.46: Top and section view on electronic system housing. Detail view on three different wall types.
Two of the solid walls are used as a patch panel for interface connectors to other payload systems. The patchpanel walls measure 211.5 mm in width and 10 mm in thickness. These walls are only frames equipped with sheet metal plates with the connector break-outs. This way all patch panel walls are identical, although the connectors differ from panel to panel. Moreover the sheet metal can be replaced easily if a connector needs to be changed.
Electronics System
137
The backplane walls are made of aluminium with an increased thickness of 14 mm. Moreover they are solid and equipped with mounting holes for the brackets holding the electronic boards. These walls measure 212 mm in width. The increased mass is beneficial, since these walls are one part of the electronic system heat sink. The side cover walls are mounted between the patch panel and backplane wall segments. Originally they should just close the housing to prevent air heated by the electronic components getting into direct contact with sensitive instruments outside the electronic system. Due to the large number of components and the lack of space some low power commercial radio frequency components have been mounted to these walls as well.
Heating of Air
Cooling of Air
Figure 7.47: Heatsink and thermal control concept of electronic system. This figure shows the routing of the water cooling pipes and the expected circulating airflow caused by the fans.
As shown in figure 7.46 the heat sinks are mounted on top of the backplane and patchpanel walls with 16 ISO 10642 countersink screws. At the upper heat sink 12 brackets carrying 13 different connectors form a patch panel. This patch panel will allow a separation of the payload for transportation above the electronic system as already mentioned at the beginning of this chapter. The heat sinks themselves consists of three aluminum parts each as shown in figure 7.47. As in the laser heat sink a copper tube with an outer diameter of 10 mm and a wall thickness of 1 mm is pressed between the heat sink cover and the heat sink body. The copper pipes of both electronic heat sinks are connected with the lower umbilical ports via Swagelok hoses. Thus the heat sink is water-cooled to 20 ◦C until lift-off. In addition to this the heat sink body is equipped with a radial-axial fan EbmPabst RER 125-19/12NG. This fan is capable of transporting a maximum air flow of 110 m3 h−1 . The
PAYLOAD SETUP AND MECHANICAL DESIGN
138
air enters the fan at its center (axial) and exits to the sides (radial). The heat sink is designed, to have an air channel with two exits and a cover, guiding the air of the fan to the side of the heat sink. The channels are equipped with heat fins, that will enlarge the surface in contact with the air. Since the whole heat sink is temperature stabilized, the air heated by the electronics will be cooled in these channels. At the side of the heat sink the air will be deflected downwards along the backplane cooling the high power electronics. Prior to lift-off the fan has to be switched of because the rotation of the fan would cause a momentum on the payload disturbing the micro gravity environment. An active fan would result in a rotation rate of the payload of 0.024 rad/s for a payload mass of 280 kg, a fan blade mass 0.32 kg and a nominal rotation of the fan of 2650 min−1 . Even if the fan is deactivated as stated above, the rocket spin during ascent will transfer some rotation energy in the fan. The amount of energy is depending on the quality of the roller bearing of the fan. For a coefficient of friction of the bearing of 0.01 the resulting rate of the payload at the beginning of the microgravity phase is in the order of 4.4 × 10⁻⁷ rad/s. While the rotation rates caused by an active fan are significantly larger than the rate control threshold or the requirements defined in section 6.2, the rates caused by a fan movement induced by the rocket spin are negligible. Thus the fan can be used for thermal control. Component
Mass [kg]
Quantity
Sum [kg]
Backplane Heat sink (3 parts) Baseplate
1.95 8.0 3.0
4 2 2
7.8 16.0 6.0
Total
29.8
Table 7.6: Mass of aluminum structure elements of the entire electronic housing. This mass is used to store the dissipated heat of the electronic system during flight.
After lift-off the dissipated heat has to be stored only in the aluminum structure of the housing comprising of the two baseplates, four backplanes and the three parts of the two heat sinks. As listed in table 7.6, these parts have a total mass of 29.8 kg and thus a high overall thermal capacity. A detailed discussion and simulation of the thermal control system of the MAIUS electronics is presented in section 12.5.
Batteries and Power Distribution
139
7.6 Batteries and Power Distribution The instrument platform situated at the bottom of the payload shelters the main batteries of the payload on the lower side and the power distribution unit (PDU) on the upper side as shown in figure 7.48. Water cooling in- & outlet
Power distribution unit Charging electronics
Battery Package
Cable feed through to power distribution
25 LiFePO4 cells
Figure 7.48: The MAIUS-1 power distribution unit is mounted to the top and the battery pack to the bottom of a shared instrument platform as shown on the left. A view inside the battery pack with the circular arrangement of cells and charging electronic is shown on the right
The main battery pack consists of 25 lithium iron phosphate (LiFePO4) cells of the type Headway 38120SE (3.3 V / 10 A h), which are combined to groups of 1, 2, 4 and 6 cells in series providing 7 different voltages with a capacity of 10 A h each. The voltages provided are +1C (3.0-4.2V), ±2C (6.0-8.4V), ±4C (12-16.8V) and ±6C (18-25.2V). Charge control electronics will ensure that the cell loads are balanced and will monitor the voltages and currents directly at the cells. The battery cells and charging electronics have been integrated into a cylindric aluminum housing as shown in figure 7.49. The cylinder measures 400 mm in outer diameter and offers 20 M4 threads at the bottom and top. Using the lower threads the cylinder is mounted directly to the instruments platform, while the upper threads are used to attach the cover plate to the cylinder. The cells are mounted between two mounting rings made from Polyoxymethylene (POM). These rings are equipped with pockets receiving the cell body, while the battery terminals are fed through the ring. The terminals are connected to a cell protection mounted to the radial face of the mounting rings as shown in detail D in figure 7.49. The threads for mounting the printed circuit boards to the mounting ring are strengthened with Helicoils to increase the bearing capacity.
PAYLOAD SETUP AND MECHANICAL DESIGN
140
The terminal may also be connected to its neighboring cell(s) with a solid bridge. The orientation of the cells is altering such that positive and negative terminal can be connected by a bridge. The number of cells bridged in series is depending on the desired voltage of the group. A solid protection cover ring, which is also made from POM, is screwed to the mounting ring once all 25 batteries and their protection boards are assembled. This cover assures, that no short is produced by contact of the terminal or a bridge with the housing. Cable Feed Through
Detail D (Projected View)
138,00
Circular Water Cooling Cooper Pipe
173,00
321,00
Fan EbmPabst RER 125-19/12NG
D
Mounting Ring (Lower) Protection Cover Cell Protection
Ø400,00
Figure 7.49: Batteries and power distribution unit section view with mounting of cells
The heat produced by the batteries and the associated electronics is dissipated by a water cooling pipe. The pipe, which is identically to the pipes used in the electronics or laser system (10mmx1mm) is pressed into a notch milled in the instruments platform. It is fixed in position by several clamps. As in the other water cooled systems water cooling will be provided during lab operation and until lift-off (refer chapter 12). In addition to the water cooling a fan of identical type as used in the electronic system will cool the cell protection boards and charging electronics by convection. This fan will aspirate the air from the center of the housing and blow it through the space between the housing cover and the fan cover towards the cells. The air flow will be diverted downwards by a radius in the lower protection cover cooling the boards mounted to the cells. The PDU is connected to the batteries by several wires routed through the internal cable feedthroughs in the center of the instruments platform. It offers 20 boards with an output providing all voltages on a single DSUB 8W8 connector. Each board can be switched individually, powering the different parts of the experiment. The boards also provide fuses for all outputs. A micro controller powered and controlled by the MORABA service module via a RS422 interface is controlling the output boards. The service module is capable of switching the power of the entire payload except for the pump controller as mentioned above.
Batteries and Power Distribution
141
Contrary to the remaining boards developed for MAIUS, the PDU boards are mountable in a slot-in housing, which results in a good accessibility and compact size of the entire module. Batteries, PDU, its internal harness and its structure add up to a total mass of 32 kg and demand only 321 mm in height.
8
Qualification of Systems and Components
The important difference between MAIUS-1 and other atom interferometers is the qualification for the use on a sounding rocket. The MAIUS-1 payload is the first atom interferometry experiment to be flown and operated in the harsh environment of a sounding rocket. As presented in figure 5.9b the rocket environment is characterized by strong vibrations with an RMS value of 1.8 g and accelerations of 12.1 g along the payload cylindric axis due to the thrust of the rocket and 7.2 g in radial direction due to the spin of the rocket. In order to ensure a reliable operation of the five payload systems shown in figure 7.1 despite these environmental conditions, the used instruments and components had to be tested under similar loads. Moreover the mechanical design of all five systems developed in this thesis has been qualified in so called "system level" tests. The methodology of this qualification process and its results are described in the following sections.
8.1 Methodology At an early stage of the MAIUS-1 payload design key technologies and associated commercial or custom-made components for all (sub)systems have been selected for future use on the sounding rocket mission in an technology review. Most of these were designed for the use in the laboratory, thus only few manufacturer have qualified their products for the operation under vibrational loads. For this reason the first shaker tests in the course of the MAIUS project have been used to qualify several commercial components as fiber switches or vacuum pumps. These have been tested "hard-mounted" (with a rigid connection to the electrodynamic shaker) at the qualification level as described in table 8.1. Once the components were successfully qualified, a proper mounting was designed for the functional group around the component. Subsequently either an additional test of a group
QUALIFICATION OF SYSTEMS AND COMPONENTS
144
of components was performed or the entire system was tested. The optional test of a group of component was carried out, if one of the components is especially sensitive to vibrations or the group is complex in its architecture. This has been the case for the MAIUS-1 pumping system. While functional groups were tested hard-mounted at qualification level, system-level tests have been performed using the acceptance test profile. NO
Preliminary Design of the Payload
Detailled Design of the Payload
NO
Preliminary Design of the System
Detailled Design of the System
Production / Assembly of the System
Qualification Testing Functional Groups (hard-mounted)
Acceptance Test of the System (Flight Configuration)
YES
Concept
Technology Review Of Components
Qualification Testing of Components (hard-mounted)
Passed
Passed
YES
Assembly of Payload
Acceptance Test of the Payload (Flight Configuration)
Passed
YES
Launch
optional
NO
Flight Test of the System (Flight Configuration) optional
Figure 8.1: Qualification and design methodology in the MAIUS-1 project
In a system level tests the system is fully integrated and mounted to its instrument platform. The platform is connected to a shaker adapter using six mounting brackets including vibration damping as described in section 7.1.2. Thus the hardware is exposed to a damped load. For these tests a shaker adapter similar to the rocket hull segments was constructed. The cylindric adapter with a length of 500 mm is designed to have the same wall thickness and the same mechanical interface to the brackets as the original hull segments. The system level tests are the decisive tests for the qualification of the (mechanical) design of a system. If they are not passed, the design of the system has to be changed and the system level test has to be repeated as shown in the flow diagram 8.1. Once the different systems have been qualified, the entire payload including the MORABA systems will be tested at the final environmental test campaign in Ottobrunn, Germany. This test will be carried out fully integrated at the acceptance level and will be followed by a shipment of the payload to Esrange for the launch campaign.
Methodology
145
8.1.1 Test Facility and Test Profiles The component and system level vibration tests described in this chapter have been performed at ZARM-FAB vibration test lab in Bremen using a Brüel & Kjaer LDS V875 HBT 600 vibration test facility. The data acquisition and control unit used was m+p VibRunner and the control and measuring system m+p VibControl/NT. The test items were mounted with individually designed adapter plates to the interface of the electrodynamic shaker. The pilot accelerometer(s), fixed in the corresponding excitation direction on the adapter are used for closed loop control of the input level during all test runs. The specified excitation levels have been applied along all main axes. Frequency [Hz]
PSD [g2 /Hz] Qualification Level Acceptance Level
Flight Level
20-399 400-599 600-1299 1300-2000
0.0045 0.0675 0.0045 0.0675
0.002 0.03 0.002 0.03
0.0003 0.004 0.0003 0.004
RMS Value
8.1 g
5.4 g
2.0 g
Duration
60 s
60 s
60 s
Table 8.1: Vibration test level for MAIUS-1
All test runs in X- and Y- axis were carried out on the horizontal slip table. The Z-axis was tested in the vertical operation direction of the shaker. The usual test duration has been 60 seconds. Before and after each random test run, sine resonance search tests at low level (0.25g) with a sweep rate of 2 oct/min were carried out to evaluate the significant eigenfrequencies in every excited axis. All deviations of the pre- and post-test sine resonance search test runs would indicate structural failure resulting from the vibration test. The individual tests have been carried out as random vibration test in the frequency range between 20 Hz and 2000 Hz. The power spectral density has been set according to the values presented in table 8.1. This results in an root mean square (RMS) of the vibration level of 8.1 g RMS (Qualification level), 5.4 g RMS (Acceptance level) and 2.0 g RMS (Flight level). The results of the system level test shall be presented in the following subsections. To represent the results of the qualification process in a clear way it was abstained from presenting the results of the component level tests. All tests have presented herein have been carried out at acceptance level with a duration of 60 s per axis if not stated otherwise.
QUALIFICATION OF SYSTEMS AND COMPONENTS
146
8.2 Vibration Testing of Rubber Dampers As described in section 7.1.2 instruments of the apparatus are mounted to four platforms, attached to the payload hull by brackets and a passive vibration damping to reduce vibrational loads, especially at high frequencies. Each instrument platform is mounted to the hull segments by a total of six brackets, each equipped with two shock mounts. This suspension has been tested and the performance of the damping characterized during several system level tests.
Damped Sensor
Undamped Sensor
3-Axis Acceleration Sensor
Control Sensor
Control Sensor 2 Control Sensor 1
(a) Test setup for testing of the vibration dampers with the MAIUS-1 pumping system. The system with a mass of 17 kg is mounted onto 12 rubber dampers.
(b) Test setup for testing of the suspension (dampers, brackets and safety bolts) with the MAIUS-1 battery system. The system with a mass of 32 kg is mounted using six flight suspension brackets with a total of 12 dampers.
Figure 8.2: Test setup for vibration damper and suspension characterization
The shock mounts STS GP-TYP A 25x10 M6 SH55 by Schwingungstechnik Schuster consist of two M6 bolts, which are vulcanized into a rubber cylinder with a diameter of 25 mm and a height of 10 mm. The rubber has a shore hardness of 55 Shore A. Figure 8.2a illustrates the setup of the MAIUS-1 pumping system test.The pumping system instrument platform is mounted to the shaker adapter plate using 12 rubber dampers. Although the main purpose of tests with this setup is to qualify the pumping system components, it also allows to test and characterize the vibration isolation performance. As shown in figure 8.3 the main resonance frequency of the vibration is 120 Hz at a load of 1.5 kg per damper. The curve has been obtained from the z-axis sensor mounted on the damped instrument platform during the z-axis sine resonance sweep at 0.5 g. That means at resonance the recorded load was five times higher than the applied sine load.
Vibration Testing of Rubber Dampers
147
Acceration in g
3
2
1 0.5 0
101
102 Frequency in Hz
103
Figure 8.3: Acceleration level recorded at the instrument platform during a z-axis resonance sweep at 0.5 g of the pumping system. The test setup is shown in figure 8.2a. The resonance frequency of the dampers is marked as 120 Hz.
The resonance frequency of the dampers is expected to shift to lower frequencies for larger masses. Moreover the lateral resonance frequency will be below the one along the cylindric axis. Since all MAIUS-1 systems are heavier than the pumping system all resonance frequencies are expected to be below 120 Hz The same setup depicted in figure 8.2a has been used to investigate the performance of the dampers under random vibrational loads. Tests have been performed applying all three profiles introduced in section 8.1.1. Figure 8.4 shows the normalized acceleration level recorded by the sensors in x-, y- and z-axis during test runs in all three axes. This normalized acceleration level has been calculated by dividing the acceleration ames recorded by the damped sensor on the instruments platform through the acceleration aapl measured from the undamped control sensor. The latter is representing the actual applied load. Thus a normalized acceleration level below 1 is representing a damping of the applied vibrations. As expected the main resonance of the dampers along the cylindric axis is shifted to lower frequencies for x- and y-axis tests (83 Hz and 102 Hz), while the highest resonance frequency was recorded during the z-axis test at 135 Hz. The difference in x- and y-axis is most likely a result of the asymmetric load distribution on the instrument platform. A second resonance of the dampers was found around 40 Hz, which is the lateral resonance of the dampers. Therefore the resonance is stronger in x- and y-axis tests. Despite the resonance peaks of the dampers, the vibration isolation is performing well and is especially effective above 100 Hz.
QUALIFICATION OF SYSTEMS AND COMPONENTS
148 Sensor X
Sensor Y
Sensor Z
100
Normalized Acceleration ames /aapl
10−2 10−4
100 10−2 10−4
100 10−2 10−4 102
103
102 103 Frequency in Hz
102
103
Figure 8.4: These figures show the quotient of the measured acceleration at the MAIUS pumping system instrument platform ames and the applied acceleration aapl . The data is depicted for the test runs in x-, y- and z-axis (top to bottom) and for sensors mounted in all three axes as labeled. In all test runs the accelerations are damped for high frequencies and show the previously mentioned rise at the eigenfrequency of the damper at around 100 Hz.
Although the recorded load at the resonance is up to 20 times higher than the load applied by the shaker the root mean square (RMS) of the vibrational load is lowered dramatically by the dampers. During tests of the pumping system at 3.03 g RMS, a value of 0.52 g was measured at the damped instruments platform. During acceptance tests the load RMS value was reduced to 0.86 g and during qualification level to 1.25 g. These results are reproducible and have not changed unexpectedly during any of the system level tests. Exemplary the results of the battery system vibration test campaign are shown in figure 8.5. As shown in figure 8.2b the entire suspension including brackets has been used in this test, which has not effected the performance of the vibration isolation. To be able to detect also resonances caused by the cylindric shaker adapter and to get a characteristic measurement of the vibration isolation performance, a third sensor has been
Vibration Testing of Rubber Dampers
149
placed at the top of the cylinder next to the mounting bracket as shown in figure 8.2b. The plots present the acceleration in g2 /Hz with the black curve presenting the applied load by the shaker, the orange curve the measured data from undamped sensor at the top of the cylinder and the blue curve the data from the damped sensor. Sensor X
Sensor Y
Sensor Z
100 10−3
Accelerations in g20 /Hz
10−6 100 10−3 10−6 100 10−3 10−6
102
103
102 103 Frequency in Hz
102
103
Figure 8.5: These figures show the results of the test of the damping system with the MAIUS battery module. The vibration response to the excited signal (black) of the sensor mounted to the damped battery module platform (blue) and the undamped cylindric shaker adapter (orange) is depicted for the test runs in x-, y- and z-axis (top to bottom) and for sensors mounted in all three axis as labeled.
The plot is showing some strong fluctuations in the upper frequency band in all test runs, which are most likely caused by resonances of thin aluminum cover plates of the tested system. These peaks do however not match with any resonances of the cylindric adapter or the battery system housing, which have been computed using FEM analysis during the design process. Nevertheless the load measured on the instruments platform is still below the excitation level, with the exception of the z-axis sensor measurement during the yand z-axis test, which exceeded the applied level shortly at roughly 1800 Hz. The vibration isolation is performing well and is considered suitable for the use in the MAIUS-1 payload.
QUALIFICATION OF SYSTEMS AND COMPONENTS
150
8.3 Qualification of Batteries and Power Distribution
Output Voltage over nominal Voltage
The main battery and the central power distribution unit as described in section 7.6 has been mounted into the cylindric shaker adapter in flight configuration as shown in figure 8.6. The output voltage of four channels of the power distribution was recorded with 10 kHz, using a National Instruments data logging system. Since each card provides all voltages of the batteries at its connector, the measured data allows to detect any malfunction in the chain from the single cell to the output card connector.
1.5
1
0.5
−10
0
10
20 30 Time in s
40
50
60
Figure 8.6: Voltages at the output of the card 16 of the power distribution unit during the z-axis random vibration test.The light grey area indicates the time during the random vibration test run. The data was recorded at 10 kHz and averaged over 1000 data points
Figure 8.6 displays the six voltages provided at card 16 in the PDU normalized to their nominal voltage. Depending on the battery charge status, some of the voltages deviate from their nominal value. However no fluctuations have been observed during the random vibration test run, which is indicated by the light gray area, starting at 0 s and lasting 60 s. This is in accordance with the measurements maintained from the other three cards monitored during the test run. In addition to the direct monitoring of the voltage with a data logging system, the internal house-keeping data of the battery system was recorded from the Ethernet interface of the system. This does not only allow a direct control of the battery voltage, but includes a test of the internal house-keeping and monitoring hardware. The internal housekeeping data did not show any abnormalities neither. Moreover visual inspection of the system revealed no damage of the electronics, batteries or the structure. Thus the system and its mechanical design, which is a part of this thesis have been qualified for the use in MAIUS-1.
Qualification of Electronic System
151
8.4 Qualification of Electronic System As described in section 7.5 the electronic system is very complex and consists of a high number of sensitive electronic components and even more electrical connections. For this reason a test of the fully integrated system in flight configuration is indispensable. With the technical means given it was not possible to record all output signals of the system. The current drivers for the lasers are considered to be one of the most critical components, since a peak in the voltage or current for the laser power supply could destroy the laser. For this reason 16 output channels supplying the laser system have been monitored before, during and after the acceptance level test runs as well as during the resonance sweeps.
Output Current in mA
120
110
100
90
−10
0
10
20 30 Time in s
40
50
60
Figure 8.7: Current output of drivers for the master oscillator (blue), tapered amplifier (red) and rigid waveguide (green) output channels at the 22 Ohm resistors simulating the lasers during the z-axis random vibration test. The light grey area indicates the time during the random vibration test run. The data was recorded at 10 kHz and averaged over 1000 data points
During the test the lasers have been simulated with commercial 22 Ohm resistors, which have been connected to the patch panel of the electronic system. The output current of each current driver has been set to 100 mA and the voltage at the resistor has been measured with a PXI system at a sample rate of 10 kHz. Figure 8.7 is the plot of three output channels of a current driver. These three channels are foreseen to operate one of the MOPA lasers of the experiment, as they are described in section 7.4. The channels are assigned to the master oscillator (blue), the tapered amplifier (red) and the ridge waveguide (green). Again the gray area indicates the random vibration test run at 5.4 grms with a duration of 60 s. As presented in figure 8.7 there has been no variation of the output current, during the test run. The maximum variation within 1000 recorded data points (0.1 s) over all 16 channels and three test runs was recorded at a single data point with 5 mV which equals a variation in the current of 0.227 mA (0.23 % of the output signal). This is uncritical for the
QUALIFICATION OF SYSTEMS AND COMPONENTS
152
laser operation. The difference in the absolute currents might be caused by differences in the resistance of the three used resistors or unappropriated calibration of the current drivers. Moreover functional tests of the entire system as well as visual inspection showed no degradation or malfunctions. Thus the electronic system and the mechanical design, which has also been part of this thesis are also considered qualified for the use aboard the sounding rocket.
8.5 Qualification of Laser System The lasers are an essential component for trapping, cooling and manipulating atoms. Those lasers need to fulfill high requirements with regards to the frequency and power stability of the light provided.
Normalized Output Power
The frequency of the laser light is actively controlled by the frequency stabilization during the flight of the rocket, which has recently been demonstrated with the LASUS experiment on the TEXUS-51 sounding rocket payload. The output power of the laser system however is depending on the alignment of the optical components used in the laser system. Plastic and elastic deformation of e.g. a mirror mount during the shaker test, would thus lead to a loss in optical power.
1.2
1
0.8
−10
0
10
20 30 Time in s
40
50
60
Figure 8.8: Normalized laser optical power at 780 nm of one laser module measured at different places in the optical path of the laser system during an acceptance level vibrational test. The power has been recorded at the laser module rear output (red), at two inline photodiodes (orange, green) and at two optical fibers (black, blue). The gray area indicates the duration of the vibrational test.
As described in section 7.4 the laser system is protected by a closed housing. This housing is mounted to the shaker adapter in flight configuration. That means, that the housing is hanging below the instrument platform inside the cylindric shaker adapter as shown in figure 8.8. During the test the 2D MOPA laser (marked No. 4 in figure 7.38) has been in operation. The laser has been supplied via the SMA sockets at the patch panel in the housing wall.
Qualification of Laser System
153
Via a D-Sub connector the signals of three photo diodes have been fed out the housing and recorded with a PXI system. The data has been recorded with 5 kHz to ensure that short fluctuations in the light power are detected. In the post processing the data was again averaged over 1000 data points. With these photo diodes the optical power is monitored at several points along the optical path from the laser to the fibers being the interface to the experiment chamber. Directly at the laser module a photo diode at the rear output port (red curve) is used for demonstration of the functionality of the laser diode itself, while an inline photo diode after the first isolator (green curve) ensures that the light generated on the optical bench of the laser module is coupled into the fiber successfully. Another inline photo diode (orange) is monitoring the power after exiting the switching and distribution board. In addition to this, two of the four fibres exiting the laser system housing are connected to two power meters, monitoring the optical power that would be supplied to the collimator at the 2D MOT chamber. The power at fibre 3 (black) is measured using a Thorlabs PM100D, while a Coherent Fieldmaster GS is used to record the power in fibre 1 (blue). Figure 8.8 shows the normalized optical power at the measurement points mentioned above. While the measurements at the fibres and the rear output of the laser module showed no abnormalities during or after the vibrational test, the signal of the inline photo diodes deviate from the other values and the set power. Anyhow the signal stabilized during the vibration test. Moreover the optical power reading at the fibers, which are located behind the inline photodiodes, did not detect these fluctuations. Thus this is expected to be a measurement artifact. In addition to that the qualification criterion has been a stable optical power at the experiment (at the fibre), which has been fulfilled. Moreover all components of the system performed reliable before and after the test and again no damage could be found during visual inspection. Thus this system is also considered qualified including the mechanical design aspects of the housing, which have been a part of this thesis.
QUALIFICATION OF SYSTEMS AND COMPONENTS
154
8.6 Qualification of Physics Package The hardness of the experiment against launch loads has proven to be especially challenging for a vacuum system. A total of 18 vibration tests have been carried out, since June 2011 in the course of the project and as part of this thesis to evaluate the durability and the applicability of key vacuum technologies and to investigate the impact of vibrational loads on the vacuum quality. During those tests several commercial vacuum components failed under the vibrational loads. Even when commercial pumps and gauges capable of surviving the loads of a sounding rocket launch were found, there was still a pressure rise observed during each vibrational test. Additional vibrational and static tests as well as intensive design effort led to the advanced vacuum system design presented in section 7.3.3 and 7.3.2. The road to this design will be presented in chapter 9. In the following the final qualification of this system is described. As qualification criterion a pressure level below 5 × 10⁻¹⁰ hPa 47 s after the vibrational tests was identified. This is the time span between t0 , which is the time T+44s of the MAIUS time event list (refer section 5.5) when the second stage is burned out and T+91s representing the begin of the experiment phase after the attitude acquisition is completed.
Pressure in hPa
10−8
10−9
10−10
0
60
120
Time in s Figure 8.9: Pressure in the vacuum system during and after the vibration tests at acceptance (blue) and flight (orange) level. The horizontal dotted line is the desired pressure level of 5 × 10⁻¹⁰ hPa and the vertical dotted line represents the time available for regaining the pressure of 47 s.
The tests were performed at the acceptance as well as the flight simulation level. During the tests the pressure is measured with the vacuum sensor located in the top of the vacuum system. During both tests the vacuum pressure showed some degradation while vibrations are present. As shown in figure 8.9 the pressure rises from initially 1.8 × 10⁻¹⁰ hPa to 7 × 10⁻⁹ hPa while vibrations are applied. Afterwards the pressure recovers quickly and drops below the critical mark of 5 × 10⁻¹⁰ hPa after 40 s.
Qualification of Physics Package
155
The test at flight level resulted in a pressure rise to −9 1.9 × 10 hPa. The pressure dropped below the critical mark only 5 s after the end of the test. Since the vibration level was measured to be in this regime a comparable performance is expected during the campaign. Although the desired pressure level was not reached within 31 s in the acceptance test, the additional 9 s are still in the extended period defined above and it would be possible to perform experiments, which require only a lower vacuum quality if the vibrational level would be higher as 2 g RMS during ascent. Therefore the vacuum system is qualified for the use on a sounding rocket. It is the first ultra-high vacuum system operating at such low pressures to achieve this qualification. In chapter 9 the reasons for the pressure rise and ways to reduce it will be investigated.
9
Design of an UHV System for the Use on a Sounding Rocket
The pressure inside the vacuum chamber is an important factor to achieve the scientific goals of the mission. As previously mentioned the pressure inside the scientific chamber has to be below 5 × 10⁻¹⁰ hPa to reduce the collision rate between the residual gas and the atomic cloud to a sufficient low level [Sei14]. The design of the scientific and preparation chamber as presented in section 7.3.3 is based on the QUANTUS-II design, to ensure that experiment parameters and results obtained from drop tower experiments can be used as a baseline for the sounding rocket experiments. Thus only minor changes have been applied to this part of the vacuum system, to ensure the stability in the harsh sounding rocket environment. While the chamber geometry was set, the choice of the chamber material, sealing techniques, as well as the design of the pumping system had to be redone and reviewed to meet the pressure requirements in the given environment. Within this chapter a design of an UHV system is elaborated to maintain the required pressure during the experimental phase of this sounding rocket mission. Contrary to other missions using vacuum for similar experiments as e.g. PHARAO [Gra04] there is no long recovery time available to regain the vacuum pressure quality. As stated in section 8.6 the mission scenario only offers 47 s to regain the desired pressure by pumping the gas that has entered the system due to the accelerations and vibrations caused by the motor burn. Thus it is important to know and to characterize the different mechanisms through which gas is released into the vacuum system.
158
DESIGN OF AN UHV SYSTEM FOR THE USE ON A SOUNDING ROCKET
9.1 Required Pumping Speed and Equilibrium Pressure Calculation The required pumping speed to ensure that the pressure threshold is reached within these 47 s can be calculated from V pinit Se f f = ln (9.1) Δt preq where Δt = 47 s is the time available to reach the required vacuum pressure preq . Moreover the intitial pressure pinit and the volume of the vacuum system V have to be known. The volume of the MAIUS vacuum system V has been extracted from the CAD models of the design presented in section 7.3.2. The volume and surface of the different parts facing the vacuum are listed in table 9.2 and 9.3. The initial pressure during the MAIUS flight, is the pressure at the time T + 44s directly after the motor is burned out and the vibration are no longer applied. This pressure is resulting from the input into the vacuum system by desorption (Qdes ), diffusion (Qdi f f ), permeation (Q perm ) and through leaks (Qleak ) as well as the effective pumping speed of the pumps removing gas molecules from the system. The equilibrium pressure can be calculated from the following equation [Pfe09] pend (t) =
Qleak (t) Qdes (t) Qdi f f (t) Q perm + + + Se f f Se f f Se f f Se f f
(9.2)
Since some parameters change with time and/or the loads applied to the system, the equilibrium pressure varies with time assuming a constant pumping speed. In the following pages the three terms responsible for the gas input will be investigated in more detail to allow for a prediction of the pressure gradient inside the chamber during the sounding rocket flight.
Outgassing Rates
159
9.2 Outgassing Rates Outgassing describes the gas flow from a material (sample) into the vacuum contributing to a pressure rise. This process is the sum of gas released by desorption, diffusion and permeation. These three mechanisms are characterized in the following.
9.2.1 Desorption Desorption is the release of atoms bound at a surface facing the vacuum. These atoms oscillate with a frequency of ν0 ≈ 1013 s−1 or their period of oscillation τ0 = 10−13 s. If the kinetic energy of these particles at the wall temperature Tw is larger than the desorption energy Edes these atoms will be released into the vacuum. According to the Boltzmann equation from n atoms Δ n atoms will fulfill this criteria [Jou13], where this fraction can be calculated as � � −Edes (9.3) Δ n = n exp R Tw The desorption rate per unit area can be calculated from the product of the amount of particles with sufficient energy and their oscillation frequency [Jou13] � � −Edes (9.4) qdes = −ν0 Δn = −ν0 n exp R Tw The mean residence time of an atom on the chamber wall with temperature Tw can be found from � � Edes (9.5) τ = τ0 exp R Tw Thus the time dependency of the number of particles for a surface initially covered with n0 atoms per unit area can be found from integration of equation 9.4 and combination with equation 9.5 � t n(t) = n0 exp − (9.6) τ For a system without re-adsorption of desorped particles, this would allow to calculate the time necessary to remove a certain amount of particles from the layer at the surface. However re-adsorption does take place and will significantly slow down this process. Hobson found a model to consider re-adsorption and solved it for a simplified vacuum system [Jou13]. He came to the important conclusion that only molecules with a desorption energy between 75 kJ mol−1 and 105 kJ mol−1 will contribute to a pressure rise on long time scales. Molecules with smaller desorption energies will be pumped very quickly and molecules with larger desorption energies will not desorp at all. Water is one of the major molecules contributing to this longterm desorption, which can require weeks. To reduce this time baking of the chamber is required as described in section 9.2.6. During pump down the desorption rate will decrease with approximately t −a with a varying from 0.9 to 1.3 [Dyl93]. Obviously the exact desorption energy of water is strongly
160
DESIGN OF AN UHV SYSTEM FOR THE USE ON A SOUNDING ROCKET
depending on the surface characteristics and varies as well. Thus the desorption rate of a certain material can only be obtained from measurements and the time dependency has to be approximated as described in section 9.2.4.
9.2.2 Diffusion Gas molecules can not only be bound at the surface but also deep in the material. These molecules can exit the material by diffusion. Typically the molecules migrate along the borders of the crystalline structure of the material. Each change in the location of the adsorbed molecules will require the energy Edi f f . According to the law of Fick the outgassing by diffusion is defined as [Jou13] qdi f f = −D
d nl dx
(9.7)
where nl is the amount of gas molecules solved in the material and D is the diffusion coefficient. As the desorption coefficient, the diffusion coefficient is also depending on the wall temperature Tw � � −Edi f f (9.8) D = D0 exp R Tw The outgassing rate by diffusion of a vacuum chamber with thin walls of thickness 2d, where the wall thickness is significantly smaller as the chamber length 2d 0.5tout is defined as [Jou13] � � 2D t (9.10) qdi f f = nl,0 exp − d tout and for t > QL,1 . Neglecting the initial leakage rate of the seal, which should be below 1 × 10⁻¹¹ hPa L s−1 combination of equation 9.41 and 9.40 will yield: � � QL,2 = pend,2 − pend,1 Se f f (9.42) For the rise in equilibrium pressure of 2 × 10⁻¹⁰ hPa at a load of 1000 N, this would result in an leakage rate of 1 × 10⁻⁹ hPa L s−1 assuming an effective pumping speed of roughly 5 L s−1 as calculated in section 9.5.1. For the pressure rise at 1060 N the leakage rate can not be determined, because the load was reduced before the equilibrium pressure was reached. Thus it can only be stated that it has to be higher than 2.41 × 10⁻⁷ hPa L s−1 assuming the same pumping rate.
UHV Testbed Setup
197
9.5.4 Static Load Test of Indium Seals The indium seals have been tested using a similar setup. As shown in figure 9.20a the linear actuator has been moved to allow mounting it to the MAIUS breadboard chamber opposite to the CF pipe tested before. In MAIUS the indium seals have mainly been used to seal the viewports. For this reason the loads should not been applied as a momentum, but as a direct pulling force on the seal as it will also occur during flight. The test should be performed perpendicular to the glass surface to allow a exact evaluation of the force applied. Applying sheer forces is more difficult and might be investigated in the future using a different force sensor.
(a) Test specimen setup for static load tests of (b) Detailed view on the indium seal test setup. the indium seals Showing the MAIUS breadboard chamber, with the force sensor mounted to the attachment ring glued to one of the 30 mm view ports. Figure 9.20: Test setup for static load test of indium seals
To perform this test the load has to be applied perpendicular to the glass surface. To allow this a attachment eye equipped with a mounting plate was glued to one of the small windows as shown in figure 9.20b. To allow application of loads as high as in the Conflat seal tests, the glue Loctite 319 in combination with an activator 7649 was used. This combination was especially developed for gluing glass to metal and achieves a strength of up to 10 N mm−2 . The contact area was limited to 25 mm in diameter to ensure that no glue will get in contact with the chamber. This still allows to apply a load of approximately 4900 N, which is sufficient for this application. As in the previous test, the load has been raised in steps of 100 N. Again it was difficult to set the load to the right level. Therefore the load level deviates from the desired value in some steps as plotted in figure 9.21 and 9.22.
10−8
1200
10−9
1000
10−10
800
10−11
600
10−12
400
10−13
200
10−14
0 0
300
600
900 1200 Time in s
1500
Force in N
DESIGN OF AN UHV SYSTEM FOR THE USE ON A SOUNDING ROCKET
Ion current in A
198
1800 Force He - Ion Current
Figure 9.21: Ion current reading for mass 4 (Helium) during static load test of a indium sealed view port. The force has been varied between 0 N and 800 N and has been applied for at least 120 s
Although Indium seals should withstand sheer loads of up to 700 N [Kup10], it is not known how and under which load the indium seals prepared for MAIUS will fail. For this reason the valve V-1 connecting the analysis and the test section was closed before each new load was applied. This was done to protect the mass spectrometer, which could get damaged if operated at pressures above 1 × 10⁻⁴ hPa. The valve was re-opened after 30 s allowing to perform the helium partial pressure measurement to detect possible leaks. In total a certain load level was held for at least 120 s Closing the valve caused a pressure rise in the analysis section from initially 1.9 × 10⁻⁸ hPa to values around 2.25 × 10⁻⁸ hPa after 110 s. This rise is cause by the separation from the titanium sublimation pump. Moreover a peak was observed when the re-opening the valve as shown in figure 9.22. Moreover some small variations in the ion current can be observed in figure 9.21 when the valve is opened and closed, even if no force is present as done between 0 s and 280 s. Thus these signals do not indicate a leak. The first leak was detected at 600 N, where the ion current rises considerably to values around 2 × 10⁻¹² A after the valve was opened. The pressure reading is not that definite, because of the pressure fluctuations caused by the opening and closing of the valve. However the pressure level after closing and even after re-opening the valve was slightly above the level of previous tests. Raising the applied load to 700 N resulted in a strong rise in the ion current to 2 × 10⁻¹⁰ A. The impact on the pressure was also stronger. The equilibrium pressure after re-opening the valve measured 2.3 × 10⁻⁸ hPa. A load of 800 N increased the leak size once more. This was indicated by a drastic rise of the pressure to 1 × 10⁻⁶ hPa, while the valve was closed. After re-opening the valve
UHV Testbed Setup
199
10−6
1200
800 600
10−7
400
Force in N
Pressure in hPa
1000
200 0 10−8
0
300
600
900 1200 Time in s
1500
1800 Force Pressure
Figure 9.22: Pressure reading during static load test of a indium sealed view port. The force has been varied between 0 N and 800 N and has been applied for at least 120 s
the pressure dropped to 2 × 10⁻⁷ hPa quickly. Unfortunately the pressure was still droping when the load was removed. Thus the equilibrium pressure is expected to be below the last recorded value of 1.4 × 10⁻⁷ hPa. Removing the load caused a fast recovery of the pressure below 3 × 10⁻⁸ hPa. A full recovery to the initial pressure of 1.9 × 10⁻⁸ hPa was achieved after 303 s. This proves that the leak in the indium seal was also closed completely after the load was removed. The leakage rates calculated from the pressure readings are 2 × 10⁻⁸ hPa L s−1 at 700 N and 6.1 × 10⁻⁷ hPa L s−1 at 800 N. However the ion current only rose to a maximum of 3 × 10⁻⁹ A, which is below the current of the leak detected at the CF seal under a load of 1050 N, which should indicate a smaller leak, while the pressure development indicates the opposite. This may be caused by the fact, that the equilibrium pressure did not fully develop during the CF test or the opening and closing of the valve might falsify the pressure measurement in the indium test. In general the absolute leakage rates should be handled with care, since the ion current saturated at a value of 1 × 10⁻⁸ A when the calibration leak with a leakage rate of 3 × 10⁻⁹ hPa L s−1 was tested. A calculated higher leakage rate e.g. during the indium tests at a smaller ion current indicates that the assumed effective pumping speed is too high or the pump is falsifying the measurement, because it is located in front of the mass spectrometer. The important outcome of the measurements is, that leaks have been detected at CF seals under loads of 900 N applied as a side load with a lever of 95 mm resulting in a bending momentum of 85.5 N m and at indium seals under loads of 600 N pulling on a view port. Although the leaks are only temporary and close completely once the load is removed, these load levels should be avoided in the construction of future UHV systems.
200
DESIGN OF AN UHV SYSTEM FOR THE USE ON A SOUNDING ROCKET
9.6 Vibrational & Shock Testing of the MAIUS Pumping System Aside from static load test, 17 vibrational tests and one shock test have been performed to test multiple vacuum components in different setups. These tests resulted in the vacuum system design presented in section 7.3. In the following the test results for the final pumping system setup shall be presented and the influence of load level, test duration and vacuum pressure level shall be discussed discussed.
(a) MAIUS-1 pumping system mounted directly to the shaker adapter plate. The mounting of the components is realized as it will be done during flight.
(b) Mounting of the MAIUS-1 pumping system including instruments platform and passive vibration isolation. This configuration is similar to the flight configuration.
Figure 9.23: Test setup for vibrational and shock tests of MAIUS-1 pumping system
In total five tests have been performed with the MAIUS-1 pumping system in its flight configuration. Three tests have been carried out "hard-mounted" as shown in figure 9.23a. In these tests the components of the pumping system have been mounted directly to the rectangular shaker adapter plate, which has been mounted to the shaker using the head expander or the slip table of the shaker as described in section 8. Two additional tests have been done with the pumping system mounted using the vibration isolation and an instruments platform as introduced in section 7.1.2. The components have been mounted to the instruments platform, which is mounted to the shaker adapter plate using passive vibration isolation as shown in figure 9.23b. While the hard-mounted tests are used to qualify and test the components of the setup and their mounting under various pressures and test conditions, the damped tests simulate the flight environment and allow investigations of the pumping system performance during flight. The combination of both setups demonstrates the impact of the vibration insulation on the pumping system performance.
Vibrational & Shock Testing of the MAIUS Pumping System
201
In the hard mounted tests all components could be qualified for the use on a sounding rocket. The ion getter pump and the titanium sublimation pump have even been qualified before hand, since a visual inspection was necessary after the tests, which requires to break the vacuum. The visual inspection showed no degradation or failure of the pump anode or the titanium filaments. Moreover no dust was found in the vacuum chamber, which would indicate abrasion from the titanium filaments. The data of the ion getter pump current showed no variations during the vibrational tests. This rules out arching between pump anode and cathode, because this would result in a peak in the pump current. A stable pump current will also guarantee a reliable operation of the pump at a constant pumping speed.
Sensor 2 Sensor 1
Figure 9.24: Pfeiffer IKR 270 sensor qualification setup using two cold cathode sensors of the same type at different pressure levels. Sensor 1 at a pressure of 1 × 10⁻⁸ hPa and Sensor 2 (hidden under the ion-getter pump) at a pressure of 4 × 10⁻¹¹ hPa.
At tests with a pressures below 1 × 10⁻¹⁰ hPa, the cold cathode sensor switched to "underrange" as soon as the test run was started. When the test run was completed it took up to 12 s until the sensor recovered. The pressure reading started at 1 × 10⁻² hPa and dropped to lower values almost immediately undershooting the actual pressure before returning to a reliable operation. The same behavior is observed, if the sensor is re-started at low pressures and is considered to be an electronic artifakt. I will take approximately 30 s to return to a reliable operation of the sensor. To investigate this behavior and to rule out that the sensor generally malfunctions under vibrations, a second sensor was mounted to the shaker during one of the test runs as shown in figure 9.24. While this sensor (Sensor 1) was operated at 1 × 10⁻⁸ hPa, the second sensor (Sensor 2) at the pumping system was operated at the usual pressure of 4 × 10⁻¹¹ hPa.
202
DESIGN OF AN UHV SYSTEM FOR THE USE ON A SOUNDING ROCKET
Pressure in hPa
10−6
Sensor 1 Sensor 2
10−7 10−8 10−9 10−10 10−11
0
20
40
60
80 100 Time in s
120
140
160
Figure 9.25: Pressure reading during vibrational test at 8.1 grms with a duration of 60 s of two hardmounted Pfeiffer IKR 270 cold-cathode sensors at different pressure levels. The light gray area indicates the test run.
As shown in figure 9.25 sensor 1 showed a reliable pressure reading and recorded a pressure rise to 2 × 10⁻⁷ hPa, while the second sensor showed the malfunction described above. In a later test it was proven, that the sensor also performs reliable at a starting pressure of 2.7 × 10⁻¹⁰ hPa at a level of 5.4 grms or if the vibration isolation is used. For this reason the sensor is considered qualified to a vibration level of 5.4 grms for pressures above 2.7 × 10⁻¹⁰ hPa. In any case the sensor will operate reliable after the test with the restriction of a long recovery time as also shown in figure 9.27. During the sine resonance sweep carried out before and after the test runs it was observed, that the pressure rises rapidly after roughly 120 s. This indicates a frequency dependency of the intensity of the pressure rise and thus also of the leak size. Figure 9.26 shows the pressure in the hard-mounted MAIUS-1 pumping system plotted over the frequency of the sine vibrations applied during a z-axis sine resonance sweep. The frequency was sweep from 5 Hz to 2000 Hz with a sweep rate of 2 oct/min and a load level of 0.5 g. Since the start of the resonance sweep t = 0 is known from the trigger signal, the frequency at the time t can be calculated from f (t) = f0 2R (9.43) This has been done in this case with the start frequency f0 = 5 Hz and the sweep rate R = t/30s. Figure 9.26 shows, that the impact of the vibrations is stronger between 95 Hz and 2000 Hz with a strong peak at 100 Hz. Avoiding or reducing loads at these high frequencies would thus reduce the leakage rate, which has been one reason to design the vibration isolation as described in section 7.1.2. Figure 9.27 demonstrates a dependency between the pressure rise and not only the fre-
Vibrational & Shock Testing of the MAIUS Pumping System
203
Pressure in hPa
10−10
10−11
101
102 Frequency in Hz
103
Figure 9.26: Frequency dependency of the pressure rise in the hard mounted MAIUS-1 pumping system. The data was obtained by logging the pressure and simultaneously the applied vibrations during a sine resonance sweep at 0.5 g with a sweeping rate of 2 oct/min
quency but also the RMS load level over the complete frequency band. The measured value after recovery of the sensor ranges from 2.3 × 10⁻¹¹ hPa (no pressure loss) at 2.04 grms to 5.4 × 10⁻¹⁰ hPa at 8.10 grms .
Pressure in hPa
10−8
2.04 g 4.06 g 5.40 g 8.10 g
10−9
10−10
10−11
0
50
100
150
200 250 Time in s
300
350
400
Figure 9.27: Pressure in the MAIUS Pumping System during z-axis random vibration tests on four different levels. The test was carried out without shock mounts. During all four tests the sensor went to "underrange" which is indicated by a pressure of 1 × 10⁻¹¹ hPa. The undershooting of the actual value is an electronic artifact as it can also be observed when re-starting the sensor.
Based on the results of the static load tests this is an expected behavior, if the pressure rise is caused by an external leak. As demonstrated in section 9.5.2 the leak size depends on the applied load. Thus a rise in the vibrational load will also cause a larger leakage rate resulting in a higher (equilibrium) pressure during vibration.
204
DESIGN OF AN UHV SYSTEM FOR THE USE ON A SOUNDING ROCKET
The leak should be closed once the test run is completed as it has been observed during the static tests. The exponential drop of the pressure and the fact, that the initial pressure is regained after the tests proves that this is also the case if the load is applied in the form of vibration. As already mentioned in section 8.2 the vibration isolation will reduce the RMS value by damping in particular high level vibrations. For this reason it is expected, that the pressure rise will be smaller, when the pumping system is mounted on the dampers.
Pressure in hPa
10−8
3.03 g (0.52 g) 5.40 g (0.86 g) 8.10 g (1.25 g)
10−9
10−10
10−11
0
20
40
60
80 100 120 140 160 180 200 Time in s
Figure 9.28: Pressure in the MAIUS pumping system during z-axis random vibration tests on three different levels. The test was carried out with shock mounts. The values in brackets indicate the actual load level on the pumping system platform.
As shown in figure 9.28 this is in accordance with the measurements performed. Either due to the low level of vibrations or the isolation of the high frequencies the sensor also shows a constant pressure reading. This allows to analyze the course of the pressure during the test run. It shows that a equilibrium pressure is reached, which is also depending on the load level. The load level on the instruments platform has been measured by two different vibration sensors. The RMS values are given in the legend of figure 9.28 in brackets behind the load level applied by the shaker. To compare those pressure curves with the ones obtained from the hard mounted tests it is important to consider the "dead-time" of the sensor of roughly 30 s. During this time the pumping system was still operating and thus reducing the pressure in the system, although the sensor did not support proper data. Since the test run starts at 50 s in both tests it is possible to compare pressures at times larger than 150 s of both tests as done in table 9.12. In analogy to the calculations performed in section 9.5.3 the leakage rate QL,2 can be found from the equilibrium pressure before the test run p(t=45) and during the test run
Vibrational & Shock Testing of the MAIUS Pumping System
205
p(t=110). The effective pumping speed at the pump cube was calculated in section 9.4.4 as 29.58 L s−1 . In addition to the leakage rate Ql,2 a residual pumping rate shall be obtained from the course of the pressure after the end of the test as � � V p(t1 ) (9.44) Sres = ln t2 − t1 p(t2 ) where V is the pumping system volume of 0.4 L and t1 and t2 have uniformly been chosen to be 160 s and 200 s to get comparable results for the residual pumping rate. At such low pressures outgassing of the chamber walls is dominant and the actual pumping rate will compensate for all kinds of gas inputs simultaneously. Thus the calculated pumping rate is very low. This pumping rate characterizing the pump down from the raised equilibrium pressure during the test to the initial level shall be defined as a the residual pumping rate. Load Level [grms ] 0.52 0.86 1.25 4.06 5.40 8.10
p(t=45) p(t=110) p(t=160) p(t=200) [ 10−11 hPa ] 3.01 3.10 3.45 1.87 2.62 4.08
5.23 25.8 37.7 -
3.52 4.13 5.36 8.13 32.7 44.3
3.2 3.64 4.57 6.41 22.91 33.2
QL,2 [hPa L s−1 ]
Sres [L s−1 ]
6.57 × 10⁻¹⁰ 6.71 × 10⁻⁹ 1.01 × 10⁻⁸ > 1.85 × 10⁻⁹ > 8.90 × 10⁻⁹ > 1.19 × 10⁻⁸
6.06 × 10⁻⁴ 1.26 × 10⁻³ 1.59 × 10⁻³ 2.37 × 10⁻³ 3.56 × 10⁻³ 2.88 × 10⁻³
Table 9.12: Evaluation of vibrational tests performed with the MAIUS pumping system. The additional leakage rate QL,2 during the tests and the residual pumping speed Sres while regaining the initial pressure have been calculated for each test run.
As shown in table 9.12 the leakage rates and the equilibrium pressure increase with the RMS value of the vibration applied. Unfortunately the sensor malfunction does not allow to calculate the leakage rate for the hard mounted tests from the equilibrium pressure, thus the leakage rate has been calculated using the pressure at t = 150 s. The actual pressure during the test will be higher, thus the actual leakage rate will be larger than the calculate values. The residual pumping rate also increases with the pressure at which it is calculated. The residual pumping rate after the 5.4 grms test (initial pressure 4.67 × 10⁻¹⁰ hPa) is twice as high as after the 1.25 grms test (initial pressure 5.77 × 10⁻¹¹ hPa). This is also an expected behavior, since the pumping speed of the ion-getter pump is depending on the pressure in the system. Therefore the pumping rate of the ion getter pump
DESIGN OF AN UHV SYSTEM FOR THE USE ON A SOUNDING ROCKET
Pressure in hPa
10−9
100
10−1 10−10 10−2 Accelerations Pressure 125
130
135
140 145 Time in s
150
155
Accelerations in a.u.
206
160
Figure 9.29: Pressure in the hard-mounted MAIUS Pumping System during 15 g half-sine z-axis shock test.
will increase if the pressure in the chamber rises. Only the rate calculated from the 8.1 grms test deviates from this rule. The duration of the test also influences the pressure rise. Very short tests, will not allow the leak to open completely and the leakage rate will be smaller. As part of the MAIUS-1 pumping system a hard-mounted half-sine shock test at 15 g with a duration of 15 ms has been carried out. In figure 9.29 the results of the two shock tests are depicted.
Pressure in hPa
10−9
10 s @ 8.1 g 60 s @ 8.1 g
10−10
10−11
0
50
100 150 Time in s
200
250
300
Figure 9.30: Impact of test durations on vacuum pressure in the MAIUS-1 pumping system. The test was performed hard-mounted at qualification level.
The pressure rises from 3.25 × 10⁻¹⁰ hPa to 6.79 × 10⁻¹⁰ hPa as a result of the shock. This is much lower than expected, when compared to the load levels and associated pressures in table 9.12. Thus the MAIUS-1 pumping system will not only survive shock loads of 15 g, but these will have no significant influence on the vacuum pressure.
Vibrational & Shock Testing of the MAIUS Pumping System
207
A similar effect is observed at random vibrations. Very short test durations of 10 s will allow fast recovery of the pressure to its initial value, while durations of 60 s will require longer pump times to recover the pressure as shown in figure 9.30. Both tests have been performed hard-mounted at qualification level with the same initial pressure but different test durations. The increase in test duration will result in an rise in the amount of gas entering the system. Although it will be pumped this gas will cause a degradation of the titanium sublimation pump. Moreover the gas has more time to spread in the system. These might be reasons for the dependency on the test duration. In addition to variation of the test parameters and the test setup, one vibrational test was performed with the analysis section of the vacuum testbed described in section 9.5 attached to the MAIUS-1 pumping system.
Figure 9.31: MAIUS-1 Pumping system mounted to the shaker in the ZARM facility. The analysis section of the UHV testbed including a mass spectrometer is connected to the test specimen with a CF16 bellow.
As shown in figure 9.31 the analysis section and the pumping system are connected with a 500 mm CF16 bellow. It was necessary to decouple the mass spectrometer from the shaker, because the spectrometer is very sensitive and expensive and it should not be damaged by the vibrational loads applied during the test. The pressure at the pumping system was 1.9 × 10⁻¹⁰ hPa. The test duration was 60 s at acceptance level. During the test the ion currents of the masses 14, 16, 17, 18, 20, 28, 32, 40 and 44 have been monitored. These represent the characteristic masses of the main components of air. As shown in figure 9.32 a rise in the ion currents for masses 28, 14 and 16 was observed. This indicates that the main component of the gas entering the system is nitrogen with the
DESIGN OF AN UHV SYSTEM FOR THE USE ON A SOUNDING ROCKET
208
characteristic masses 28 and 14. This would support the assumption that the pressure rise is caused by temporary external leak. ·10−10 Mass 14 Mass 16 Mass 17 Mass 18 Mass 20 Mass 28 Mass 32 Mass 40 Mass 44
Ion Current in A
1.5
1
0.5
0
0
20
40
60
80 100 120 140 160 180 200 Time in s
Figure 9.32: Ion current reading of characteristic masses for air during vibration test of the MAIUS-1 pumping system at acceptance level for 60 s
However, there is no good explanation for the rise in the ion current of mass 16. Mass 16 could indicate an gas input of oxygen. However if this was caused by oxygen a rise in mass 32 should also be observed. Unfortunately the ion current of mass 32 is only showing noise. One reason for these inconclusive results might be the two ion pumps and the two titanium sublimation pumps that have been operated during the test. As already stated in section 9.5 it is not ideal to have these pumps operating while measuring. The pumps will falsify the test results, because they will remove molecules from the residual gas. A test run under a dome filled with a test gas as helium would clearly prove that the pressure rise is caused by external leaks.
Estimation and Improvement of the Equilibrium Pressure in MAIUS
209
9.7 Estimation and Improvement of the Equilibrium Pressure in MAIUS The intensive investigations carried out in this chapter helped to design an vacuum system suitable for the use on a sounding rocket. The vacuum system as described in section 7.3.2 and 7.3.3 has demonstrated Bose-Einstein condensation [Sei14] and was successfully qualified for the use on the VSB30 sounding rocket as reported in section 8.6. As stated in section 8.1 the maximum vibration level at the structure of the payload is expected to be 1.8 g RMS during motor burn. The motor will burn for 44 s as shown in the time event list (table 5.2). For this reason the pressure coarse obtained from the flight level test at 2 g RMS for 60 s is a reasonable prediction for the pressure during the flight of MAIUS-1. Indeed the pressure might even recover quicker, because of the shorter duration of the vibration and the dependency of the pump down time from the duration presented in section 9.6. For an estimation of the pressure coarse during the ascent of the rocket all loads have to be considered. Aside from the vibrational loads a shock of 20 g with a duration of 15 ms and accelerations of up to 13 g are expected as characterized in section 5.6. Although the shock level during motor ignition is slightly above the one in the performed tests, the impact on the vacuum quality should be comparable to the one observed during the tests. The acceleration will result in quasi static loads on the seals. The windows are to light (max. 130 g), thus the indium seals will experience static loads of 17 N, which is not sufficient to cause a leak. To cause a leak at CF-flanges, the bending momentum on the seal would have to exceed 80 N m as described in section 9.5.3. At 13 g this would be equivalent to 0.627 kg m. To reach this momentum a component of 6.27 kg has to be mounted to a CF flange with a distance of 100 mm between the flange and the center of gravity of the component. Consequently it would require a heavy component or a long lever to cause a leak at one of the CF flanges. Since all heavy components are supported properly this value will not be exceeded at any CF seal. Thus no impact on the pressure is expected from the static acceleration. A proper mounting of the (vacuum) components and the use of vibration dampers to reduce the loads on the seals and thus the leakage rates has already been implemented in MAIUS-1. To improve the vacuum quality further the effective pumping speed has to be enlarged or the outgassing rate has to be reduced. Both methods would increase the net pumping rate available to compensate for the increased leakage rates while (vibrational loads) are applied. Enlarging the effective pumping speed could be achieved by increasing the conductance between the different sections of the vacuum system or by using pumps with a larger pumping capacity. Unfortunately the pumping speed of e.g. ion-getter pump always scales with the weight of the pump. Thus the mass of the vacuum system would increase significantly.
210
DESIGN OF AN UHV SYSTEM FOR THE USE ON A SOUNDING ROCKET
The conductance could especially be improved at the connection between the pumping system and the science chamber. This could be achieved by enlarging the pipe diameter to 25 mm, which would result in a decrease of the magnetic shielding factor. If this decrease in shielding factor is affordable for future missions without risking to miss the scientific goals would have to be investigated by the scientists. One important lesson learned from the laboratory operation of MAIUS-1 is, that not all structures of the chip are needed for operation of the experiment. Thus the number of cables connecting the atom chip with the feed-throughs could be minimized by connecting only the structures that are used. This would decrease the outgassing rate of the Kapton isolation, which is dominating the overall outgassing rate of the experiment chamber. Moreover the atom chip itself could be simplified to fewer layers and it could be abstained from using glue to connect the different layers of the chip, which would also contribute to the reduction of the outgassing rate. To decrease the outgassing rate electro-chemical polishing of titanium as described in section 9.2.6 might reduce the outgassing rate of titanium by three orders of magnitude. A combination of those methods is promising a strong increase in the performance of the vacuum system. Therefore all methods mentioned above are currently under investigation for the use in future vacuum systems for quantum optic experiments.
Part
IV
Thermal Design, Simulation and Testing
10
Simulation of Aerothermal Heating
For designing a thermal control system it is essential to know all thermal loads in interaction with the studied system. While the power consumption of the instruments aboard a sounding rocket are generally well known, the heat input due to aerodynamic friction is depending on the trajectory and geometry of the rocket. MATLAB
ANSYS Input
v(t), h(t), Payload Geometry (simplified) Geometry vom CAD
Input
v(t), h(t)
Atmospheric Model
ʌ (t), T(t), p(t), Ma(t)
Heatflux
Q(t) T_w(t+ȴt)
Payload Geometry (simplified)
Finite Volume
Q(t) T_w(t)
FEM
T_w(t)
Output
Figure 10.1: Schematic of the computation approach for the heat input into the rocket structure due to thermo-fluid dynamics
Thus it may differ depending on the rocket geometry, trajectory and hull thickness. Unfortunately no data of the hull temperatures along the payload modules is available for blunted nose cone payloads with similar mass, hull geometry and trajectory as MAIUS1. The only temperature measurements accessible have been performed at the service or recovery module of the rocket for Ogive nose cones. These results are shown in figure 10.10 for comparison. However these are not representative for the hull temperatures at the scientific payload, which are located downstream of the service module.
SIMULATION OF AEROTHERMAL HEATING
214
In the following a method for an estimation of the heat flux into the rocket structure due to aerodynamic friction shall be presented, which has been developed within this thesis.
2000
260
1500
200
Altitude in km
Velocity in m s−1
In the first step a MATLAB script is used to compute the properties of the air surrounding the payload based on a DIN ISO 2533 standard atmosphere model. As shown in the schematic 10.1, the flight parameters altitude and velocity are used as an input to compute the atmospheric parameters as well as the actual heat flux.
1000 500 0
150 100 50 0
0
200 400 Time in s
(a) Predicted velocity of MAIUS-1
600
0
200 400 Time in s
600
(b) Predicted altitude of MAIUS-1
Figure 10.2: MAIUS flight parameter for heat flux computation
These parameters are provided by DLR MORABA, where the trajectory of the rocket is simulated using the rocket simulator software ROSI. This has to be done to ensure that the altitude does not exceed the limits of ESRANGE for unguided rockets and to be able to compute the aerodynamic behaviour of the rocket during ascent and descent. The ROSI output for the MAIUS-1 flight is plotted in figure 10.2. In the next step a MATLAB script computes the heat flux into the structure by aerodynamic heating based on the parameters of the atmosphere and the relative velocity of the rocket as plotted in figure 10.2a. Wind speeds and the attitude of the rocket are not considered in this simulation. The script is using an numeric approach in combination with a simplified finite volume model of the payload to compute the heat fluxes as presented in section 10.3. The computed heat flux for each volume element is finally fed in a transient-thermal FEM simulation to obtain the temperature field along the hull segments with a good spacial resolution and with consideration of all details of design. The temperature field will be used to compute the heat flux from the hull into the different systems of the payload as described in chapter 11.1.
Atmospheric Model
215
10.1 Atmospheric Model With increasing altitude the physical properties of the air change significantly. These changes have a strong impact on the (thermo)fluid dynamics of the MAIUS sounding rocket. Thus these changes have to be considered for computation of the aerodynamic heating. Based on the altitude information provided in figure 10.2b the essential parameters of the atmosphere such as density ρair , pressure pair and temperature Tair will be computed according to DIN ISO 2533 in dependency of the altitude corresponding to the respective flight time. The international standard atmosphere (ISA) model is valid for altitudes up to 88 km and shall be described in the following. At higher altitudes the aerodynamic friction is negligible. The atmosphere between 0 km and 88 km is idealized as a model with 8 layers, 3 of which are isothermal layers. For isothermal layers the three basic parameters are computed as Tair = Ta = const � � � � g0 pair = pa exp − (h − ha ) R Tair � � � � g0 (h − ha ) ρair = ρa exp − R Tair
(10.1) (10.2) (10.3)
and respectively for the other layers Tair = Ta + a (h − ha ) � g0 Tair −( a R ) pair = pa Ta � � g0 Tair −( a R +1) ρair = ρa Ta
(10.4)
�
(10.5) (10.6)
where R = 287.05 J kg−1 K−1 is the specific gas constant for air and g0 = 9.81 m s−2 is the gravitational acceleration. The altitude of the rocket h is an input parameter, the start altitude of an layer ha and the remaining coefficients have to be chosen from table 10.1. In addition to these basic parameters, the dynamic μair and kinematic viscosity ηair in Pa s−1 and m2 s−1 are approximated by an approach presented by Sutherland [Sut93] as μair = 1.458 × 10⁻⁶ ηair =
1.5 Tair Tair + 110.4
μair ρair
(10.7) (10.8)
SIMULATION OF AEROTHERMAL HEATING
216
Moreover the speed of sound and thus the Mach number Ma = vc are depending on the air temperature as well. Thus the speed of sound c needs to be calculated in dependency of the altitude from √ c = κ R Tair (10.9) where κ = 1.4 is a good approximation for air in this altitude regime. The change in c will directly influence the Mach number. With this all parameters for computation of the aerodynamic heating are defined for altitudes of up to 88 km. Layer # 1 2 3 4 5 6 7 8
h km
ha km
-0.5 - 11 11 - 20 20 - 32 33 - 47 47 - 52 52 - 61 61 - 79 79 - 88
0 11 20 32 47 52 61 79
Ta K
a K m−1
288.15 −6.5 × 10⁻³ 216.65 0.0 216.65 +1.0 × 10⁻³ 228.65 +2.8 × 10⁻³ 270.65 0.0 270.65 −2.0 × 10⁻³ 252.65 −4.0 × 10⁻³ 180.65 0.0
pa Pa
ρa kg m−3
101325 22632 5475 868 111 59 18 1
1.2250 0.3639 0.0880 0.0132 0.0014 0.0008 0.0002 1.9 × 10⁻⁵
Table 10.1: Parameters for calculation of density, pressure and temperature of the standard atmosphere according to DIN ISO 2533
Above 88 km the atmosphere is already very thin (ρ(88 km) = 3.463 × 10⁻⁶ kg m−3 ), which reduces the aerodynamic heating rate to less than 1 % of its maximum value during ascent. For MAIUS-1 this portion of the heat flux is neglected. For more accurate thermal simulation an implementation of look-up-tables from other atmospheric models as e.g. NASA MSIS-E-90 is possible, however less handy. Figure 10.3 illustrates the course of the six most important atmosphere properties for the first 70 s of flight. For completeness and clarity the altitude and the velocity of the rocket are also plotted in the first line of this figure.
Atmospheric Model
217
Velocity in m s−1
Altitude in km
100 80 60 40 20 0
0
20
40
2000 1500 1000
0
60
Temperature in K
Density in kg m−3
101 10−1 10−3 10−5 0
20
40
Dyn. viscosity in Pa s−1
Pressure in Pa
1
0.5
0 20
40
20
40
60
0
20
40
60
0
20
40
60
0
20 40 Time in s
260 240 220 200
·10−5 1.8 1.6 1.4 1.2
60
340 Mach Number
Speed of Sound in m s−1
0
0
280
180
60
·105
500
320 300 280
6 4 2 0
0
20 40 Time in s
60
60
Figure 10.3: Output of the atmosphere model for the first 70 s of the MAIUS-1 flight
SIMULATION OF AEROTHERMAL HEATING
218
10.2 Geometric Model and the Finite Volume Method The heat flux into the structure is depending on the wall temperature of the rocket. Thus it is not possible to completely decouple the heating of the wall and the conduction in the wall from the computation of the heat flux. For this reason a finite volume approach was used to consider those effects. For simplicity the geometry of the rocket hull has been simplified and is considered radially symmetric. 1
2
3
ɲ = 9.75
ɲ = 2.88
4
5 ɲ = 4.85
6
7
8
9
10
11
12
13
14
ɲ = 5.50
ь
Figure 10.4: Finite volume model of the MAIUS-1 payload including MORABA systems
This results in a model consisting of 14 volume elements, which are all of cylindrical or conical shape, with the nose tip being the only exception. Figure 10.4 gives an overview on the model and a good comparison to the detailed model. In the simplified model all flanges with increased wall thickness for mounting of the e.g. instrument platforms as well as the hatches have been neglected. Moreover the curved path of the nose (elements 2 and 3) was approximated by a simple conical shape, with a slope of α2 = 9.75◦ of α3 = 2.88◦ . This allows to describe the geometry of all elements but element 1 using a truncated cone or cylinder model without changes in the wall thickness within a single element. This simplification is especially important to be able to cover the nose section with the approach described in section 10.3 to calculate the heat flux by aerodynamic heating. The same simplification can also be used to model tangent ogive noses, by dividing them in multiple cone elements to approximate the radius of the nose. Figure 10.5 illustrates the nomenclature for the geometric properties and heat fluxes of the volume elements. The right boundary of the element is referred to as "east" (index e) and the left boundary is referred to as "west" (index w). Although one volume element is characterized by a total of four radii, only the eastern radius is stored with the index of the element. The western radius is defined by the previous element rw ( j) = re ( j − 1).
Geometric Model and the Finite Volume Method r [m]
Element # 1 2 3 4 5 6 7 8 9 10 11 12 13 14
ri [m]
219 L [m]
0.1069 0.1048 0.0839 0.1992 0.1969 0.5366 0.219 0.213 0.3941 0.219 0.213 0.2132 0.250 0.2451 0.365 0.250 0.2451 0.135 0.250 0.2450 0.500 0.250 0.245 0.620 0.250 0.245 0.500 0.250 0.245 0.600 0.250 0.245 0.570 0.250 0.245 0.312 0.2795 0.2755 0.3063 0.2795 0.2755 0.0717
α [◦ ]
m [kg]
9.75 2.88 0 4.85 0 0 0 0 0 0 0 5.50 0
4.21 3.23 5.96 4.86 8.09 2.88 10.89 13.50 10.89 13.06 12.41 6.79 6.35 1.40
Table 10.2: Geometric parameters of the 14 volume elements of the payload model
The same applies to the contact surface between Element j and its neighboring surfaces, which are computed as � � (10.10) Ae ( j) = π r2 ( j) − ri2 ( j) = Aw ( j + 1) The reference cone envelope line Lm is calculated as � Lm ( j) = [r( j) − r( j − 1)]2 + l 2 ( j)
(10.11)
This includes the special case of cylindric elements, where r( j) = r( j − 1) and therefore Lm ( j) = L( j). The outer surface of element j is given as A( j) = π Lm ( j) (r( j) + r( j − 1))
(10.12)
and the volume respectively as � � �� π L �� 2 r ( j) + r( j) r( j − 1) + r2 ( j − 1) − ri2 ( j) + ri ( j) ri ( j − 1) + ri2 ( j − 1) 3 (10.13) As shown at the top of figure 10.4, there are 13 cone/cylinder shell elements and one nose tip element, which is hemispherical with a nose radius rn = 0.110. The geometric properties of all elements of the model of the MAIUS-1 payload are given in the lower drawing of figure 10.4. Moreover the properties needed as an input for calculation of the areas and volumes mentioned above are summarized in table 10.2. V ( j) =
SIMULATION OF AEROTHERMAL HEATING
220
Qaero
Qrad
ɲ (j)
Element j R (j)
East Element j+1 Ri (j)
R (j-1)
Ri (j-1)
West Element j-1
Qw
Qe
Lm (j)
L (j)
Figure 10.5: Finite volume elements for conduction computation
Wherever possible the mass is extracted from the CAD files or from actual measurements to allow a accurate calculation of the element hull temperature T ( j). As initially stated and as given in section 10.3 this temperature is directly influencing the heat flux due to aerodynamic heating. To compute the temperature of each element, the heat flux by conduction between an element j and its neighbouring elements j + 1 (Q˙ e ) and j − 1 (Q˙ w ), as well as the heat flux by radiation (Q˙ rad ) and aerodynamic friction (Q˙ aero ) has to be considered as also illustrated in figure 10.5. In order to solve this problem an additional discretization in time using the finite difference method as proposed in [Pol05] will be carried out. Considering all heat fluxes interacting with the element, the balance of energy will provide a discretized solution for the change of the stored heat Q in element j Δ Q( j) = Q˙ e ( j) + Q˙ w ( j) + Q˙ rad ( j) + Q˙ aero ( j) Δt
(10.14)
where the heat Q( j) is linked to the element temperature T ( j) by Q( j) = c( j) m( j) T ( j)
(10.15)
with m being the mass of the element and c being the specific heat capacity for the wall material. This leads to a discrete formula for explicit computation of the element temperature T ( j,t + Δt) = T ( j,t) +
� � Δt Q˙ e ( j,t) + Q˙ w ( j,t) + Q˙ rad ( j,t) + Q˙ aero ( j,t) (10.16) c( j) m( j)
Such an explicit approach is not naturally stable. Large steps in time Δt or space L can lead to instabilities. For this reason a stability criterion has to be met to ensure proper
Computation of the Heat Flux at the Rocket Hull
221
performance. For thermal simulations this is given as [Pol05] λ Δt ≤ 0.5 c ρ L2
(10.17)
This has to be checked for each element and each time step with λ being the thermal conductivity and ρ the density of the wall material. For the MAIUS simulation it has been implemented in the MATLAB script as an abort function. If this criteria is met, the heat fluxes at the time t have to be known to solve equation 10.16. For the conduction to or from the neighboring elements, the heat fluxes Q˙ e ( j,t) and Q˙ w ( j,t) can also be approximated using the finite difference method, which leads to [Pol05] � � T ( j + 1,t) − T ( j,t) ˙ (10.18) Qe ( j,t) = −2 λ Ae L( j) + L( j + 1) and respectively
� � T ( j,t) − T ( j − 1,t) ˙ Qw ( j,t) = −2 λ Aw L( j) + L( j − 1)
(10.19)
The radiation into the surrounding of a wall element with the outer area A( j) and a emissivity ε and the Boltzmann constant σ = 1.380 65 × 10−23 J K−1 can be approximated by the Stefan-Boltzmann law Q˙ rad ( j,t) = ε σ A( j) T 4 ( j,t)
(10.20)
In MAIUS-1 the scientific payload hull segments were made of aluminum EN-AW-7075. The material properties of the hull segments have been set according to the values given in the material datasheet [Gle15] to λ = 145 W m−1 K−1 , ρ = 2800 kg m−3 , c = 960 J kg−1 K−1 and ε = 0.11. The time step Δt is defined by the input data from the ROSI software, which varies between 0.05 s at the beginning and 1 s towards the end of the flight. Use of smaller time steps is however possible by interpolation between two points of the input data. By default the software will use the timestep generated by the ROSI software.
10.3 Computation of the Heat Flux at the Rocket Hull The only heat flux, which has not yet been determined is the heat input by aerodynamic heating. For its determination an approach presented by Professor Steven P. Schneider in a script on Preliminary Spacecraft Designs [Sch03] of the Purdue University has been adapted. Although the script is aiming at designing a thermal protection system (TPS) for re-entry, the equations used in here are based on approaches published by Tauber et al [Tau87] and White [Whi91], which are also valid for ascent of (re-entry) vehicles. As discussed in the following the approach will use a number of simplifications, however the simulation returns reasonable data for the nose cone and payload module temperatures.
SIMULATION OF AEROTHERMAL HEATING
222
Thus the approach will be used with care and a sufficient margin as a design tool to approximate the heat input into the systems by aerodynamic heating. The approach differentiates between two different calculation methods: stagnation point heating applicable on the nose tip only and flat plate heating, which will be used for the remaining elements. This implies that the cone element will be treated as an angled plate with equivalent surface area and length, which is a reasonable and common approximation in fluid dynamics. Moreover the angle-of-attack is assumed to be 0◦ as indicated in figure 10.4 neglecting wind and the rocket altitude.
10.3.1 Stagnation Point Heating The stagnation point heating rate will be approximated using a approach presented by Tauber et. al. [Tau87]. The heating rate will be applicable at the nose tip only. The heating rate per unit area is generally given as q˙sp (t) = C 1002 ρair (t)N v(t)M
(10.21)
Here ρair is the freestream air density in kg m−3 as computed for each time of flight t in the atmosphere script and v is the rocket speed in m s−1 , which is the input data originally computed by the ROSI software. The coefficients C, N and M will be discussed in the following. The equation will return the heating rate in W m−2 with the constants defined herein. The constants for stagnation point heating are defined as M = 3, N = 0.5 and � � C = 1.83 × 10⁻⁸ rn−0.5 (1 − gw (t))
(10.22)
where rn is the nose tip radius in m, which is 0.110 m for the MAIUS-1 blunted nose (compare figure 10.4). Moreover gw is defined as the ratio between wall enthalpy hw and atmosphere enthalpy ho . With the wall enthalpy defined as hw (t) = Tw (t) c
(10.23)
with c = 960 J kg−1 K−1 being the wall specific heat capacity of the MAIUS hull segments and respectively Tw being the wall temperature of the hull. The total enthalpy h0 of the atmosphere at a given altitude is found from h0 (t) = hair (t) + 0.5 v2 (t)
(10.24)
where the local enthalpy hair has to be calculated from hair (t) = Tair (t) c p,a
(10.25)
Computation of the Heat Flux at the Rocket Hull
223
where c p,a = 1006 J kg−1 K−1 is the assumed specific heat of air. Changes in c p,a are neglected. This leads to a definition of gw gw (t) =
c p,w Tw (t) Tair (t) c p,a + 0.5 v2 (t)
(10.26)
This will allow computation of the heating rate per unit area for the nose tip element of the rocket model as defined in section 10.2. Multiplication with the nose area will return the heat input into the volume element Q˙ aero ( j = 1,t) = A(1) q˙sp (t)
(10.27)
10.3.2 Large Angle of Attack Flat-plate Heating As initially stated the heating rate of the remaining elements will be computed by treating the cylinder wall as a flat plate. For computation of the heating rate the calculation approach will differ depending on the angle between the free flow and the plate. The critical angle is also depending on the free stream velocity or in this case the rocket velocity. As such the criterion sin α Ma∞ > 1 (10.28) defines a large angle of attack [Sch03]. If this is the case the method for the heating rate calculation is similar to the one for the stagnation point heating. Thus the heating rate of the wall elements is defined as q˙s ( j,t) = C( j,t) ρair (t)N( j,t) v(t)M( j,t)
(10.29)
As indicated in equation 10.29 the coefficients C, N and M may differ from element to element and even over time. Therefore one will have to differentiate between laminar and turbulent flow at every time step to determine the correct coefficients. The criterion for the turbulence of the flow is given by the Reynolds number. To avoid the complex computation of the local densities, viscosities and velocities at the hull, the Reynolds number is computed using free stream parameters. j
v(t) ρair (t) ∑n=1 Lm (n) Re( j,t) = ηair (t)
(10.30)
The atmospheric parameters ρair and ηair will change with t (time of flight) and are provided by the atmospheric simulation. The velocity v equals the rocket velocity. The characteristic length of the element j was chosen to be the sum of the element reference cone line length (as defined in section 10.2) from 1 to j, which considers the boundary layer development over the previous elements. Possible detachments of the boundary layer due to changes in the diameter are neglected.
SIMULATION OF AEROTHERMAL HEATING
224
This method will produce higher Reynolds numbers especially for the rear volume elements, than computation of the element Reynolds number by considering only the element length Lm ( j). The difference ranges from factor 1 to 26.3 as shown in figure 10.6 and 10.7. Logically it will differ the most for small volume elements, which are located at the rear of the rocket.
Reynolds Number
108 107 106 105 104 103 102 0
10
20
30 40 Time in s
50
60
70
2 3 4 5 6 7 8 9 10 11 12 13 14
Figure 10.6: Reynolds numbers for the different volume elements along the hull computed from the sum of the element lengths and the free-stream conditions as described in the text. This approach was used in the computation for the heat flux presented herein.
Unfortunately it is difficult to determine a criterion for the change from laminar to turbulent flow based on free stream Reynolds numbers. Generally the transition will occur at higher Reynolds numbers, because e.g. the velocities at the wall will be smaller than the free-stream velocities. At HIFiRE-1 [Kim15] the transition Reynolds number was reported to be 1.51 × 10⁷ . In this case a different criterion was used for laminar flow log(Re(t))