Distributed Camera Control via Moving Horizon Bayesian Optimization. A. A. Morye .... using techniques proposed in [6], [7], we decompose a global. Bayesian ...
2014 American Control Conference (ACC) June 4-6, 2014. Portland, Oregon, USA
Distributed Camera Control via Moving Horizon Bayesian Optimization A. A. Morye, E. Franco, A. K. Roy-Chowdhury, J. A. Farrell University of California, Riverside Abstract— Active distributed optimal control of PTZ (pan, tilt, zoom) camera networks can yield accurate target tracking with high resolution imagery at opportunistic time instants, even when the number of targets exceeds the number of cameras. However, one step ahead methods have limited ability to simultaneously tradeoff competing objectives, potentially sacrificing smoothness of the PTZ trajectory. In addition to mechanical wear, this causes video feed motion blur, making it unsuitable for analysis. To address this challenge, we use a distributed optimization algorithm over a moving horizon with target tracking and PTZ smoothness constraints. The planning horizon enables the immediate actions of the camera control module to consider future effects. The solution approach is designed using a Bayesian formulation within a game-theoretic framework. The Bayesian formulation enables automatic trading-off of objective maximization versus the risk of losing track of any target, while the game-theoretic design allows the global problem to be decoupled into local problems at each camera. The feasible PTZ parameter set is defined by constraints on target tracking performance and PTZ smoothness. Cameras alter their own PTZ sequences by using information received from neighboring cameras, and broadcast the updated sequences to their neighbors. This article presents the theoretical solution along with simulation results.
I. I NTRODUCTION To perform surveillance, the installed camera network must extract information from the changing scene, perform state estimation for all targets, and obtain high-res imagery for certain targets when opportunity arises. The optimal one step ahead solution may lead to missed imaging opportunities or discontinuous PTZ sequences. Apart from leading to mechanical wear, such discontinuities in the PTZ settings also leads to motion blur in images, and could provide images that are not well suited for analysis. The operating area includes NC cameras placed at fixed (known) locations and a time-varying number of targets NT (t) that maneuver along unknown and independent trajectories. It is possible that NT (t) > NC . All cameras have controllable pan (ρ ∈ [−180◦ , 180◦ ]), tilt (τ ∈ [−90◦ , 90◦ ]), and zoom (ζ ∈ [ζ, ζ]) parameters. For i = 1 to NC , let the local camera PTZ vector be defined as ai = [ρi , τi , ζi ]> . The PTZ parameter vector of the camera network is then defined > > 3NC as a = [a> . 1 , . . . , aNC ] ∈ < Every camera has its own embedded target detection module, a consensus-based state estimator, and a distributed camera parameter optimizer. Fig. 1 shows the overall information flow and time sequence of processing of the system. Images acquired at tk are first processed for feature detection This research was supported by ONR under award N000140910666 and US ARMY grant W911NF-12-1-0094. This article represents the opinions and findings of the authors, not the supporting agencies. The authors gratefully acknowledge this research support.
978-1-4799-3274-0/$31.00 ©2014 AACC
Consensus State Estimate New Target Images Target Detection Measurement Consensus & Covariance Camera State & Association Estimation Feature Detection & Target Association Information Camera
Target Detection & Association
New images at tk
Target Measurement Information Consensus State Estimation
Optimization of PTZ sequence Target Consensus over planning horizon H Detection & State Trajectory for time tk+1 Association Estimation Prediction
tk
Optimal PTZ Sequence Target Trajectory Trajectories & Prediction Covariances
PTZ Horizon Optimization
PTZ Parameters Target Trajectory Trajectories & Prediction Covariances
PTZ Horizon Optimization
New images at tk+1
Camera configures to PTZ values for time tk+1
Target Detection & Association
tk+1
t
Fig. 1: System Block Diagram and Event Time-line: Note that information exchange shown is only between neighboring cameras. The time-line of activities between image sample times is shown.
and data association. Subsequently, each target’s state vector is estimated from the acquired imagery [1]. Accuracy and consistency of state estimation performance are prerequisites that allow distributed optimization of the network PTZ vector a to enable high-res imaging at tk+1 . On completion of the target state estimation process for all targets, a sequence of predicted target positions, and the associated covariance matrices are available for future image sampling times. Each camera will then optimize its sequence of PTZ settings collaboratively with other cameras. A. Contribution One step ahead distributed camera control strategies to obtain high-res images are considered in [2]–[4]. In [4], the authors formulate and solve an optimization problem for camera control at each time instant, while not considering the future effects of the control action. This paper builds on the work done in [4] by incorporating a PTZ planning scheme similar to Model Predictive Control [5]. The method presented herein uses distributed, game-theoretic methods to solve a Bayesian multi-time step optimization problem. Solution over a time interval allows smooth PTZ sequences to be planned to achieve tracking specifications while acquiring high-res imagery. The computed control action A influences the measurements obtained by the camera network, which in turn affects the state information available to the camera network in the future. At every sampling instant, the optimizer module on each camera formulates a new optimal control problem and solves it collaboratively, using incoming target state information propagated by its neighbors. The solution requires design of risk-sensitive objective and constraint functions with desirable properties, development of methods that ensure accurate propagation of target-related information through
2083
the distributed network, and selection of an MPC-based optimization strategy suitable for distributed implementation. A methodology to decouple a centralized MPC approach is described in [6]. In [7], a systematic method for designing agent objective functions, using a hierarchical decoupling of the global optimization function into aligned [8] local objective functions is provided. Game-theoretic approaches [9] are often utilized to decompose central problems into local ones and prove convergence An approach for gametheoretic camera control for collaborative imaging is proposed in [10], where the agents account for risk and include the quality of imagery in a weighted utility function. By using techniques proposed in [6], [7], we decompose a global Bayesian constrained imaging value maximization problem defined over a user-defined time horizon, into local Bayesian constrained maximization problems, that are suitable for distributed constrained optimization. II. S YSTEM M ODEL The discrete-time model for target T j ’s motion is xj (k + 1) = Φ xj (k) + γ(k),
(1)
where j = 1, . . . , NT is the target number, xj = [g pj , g vj ]> with g pj and g vj representing the position and velocity vectors in global frame, Φ is the state transition matrix, γ ∼ N (0, Qd ) is process noise with process noise covariance matrix Qd , and T = tk+1 − tk is the sampling period. The ˆ j , and its error covariance matrix j-th target’s state estimate x Pj , are propagated between sampling instants using ˆ j (k + 1)− x j
P (k + 1)
−
ˆ j (k)+ , = Φx =
j
Φ P (k)
+
(2) >
Φ + Qd .
(3)
The covariance matrix Pj− computed using Eqn. (3) can be written in block form as � j− � Ppp Pj− j− pv P = . (4) Pj− Pj− vp vv For a user defined horizon H, target T j ’s state estimate and error covariance matrix are propagated between sampling instants within the horizon h = 1, . . . , H using ˆ j (k + h)− x j
−
P (k + h)
ˆ j (k)+ , = Φh x h
j
+
(5) h>
= Φ P (k) Φ H X > + Φh−1 Qd Φh−1 .
(6)
to be the sequence of camera network PTZ parameters. Equations for measurement update of target state and error covariance; camera coordinate transformation; and those for the camera measurement model and the measurement residual are derived in [11]. III. PTZ O PTIMIZATION M ETHODOLOGY In this section, we discuss the desired properties of the objective function and design the global and local problems. A. Global Optimization Problem Design For acquiring high resolution images, the imaging value ˆ − , P − ) over horizon H is to be designed function VH (A : X as a measure of the per target per camera imaging value. The ˆ − , P − ) makes explicit that PTZ sequence notation VH (A : X A is the optimization variable and that the imaging value also depends on the distribution of target trajectories, which ˆ − , P − ). For ease of notation, from is parameterized by (X this point in the paper, we will drop dependence of VH (A) ˆ − and P − . on X 1) Imaging Value Properties: The desired imaging value function properties have been discussed in [4]. In this paper we will only state the components required to build this function. Image quality is defined by the relative pose between the imaging camera and the imaged target, and the image resolution at which the target is imaged. ˆ j ) for camera Ci is quantified Image resolution rij (ai , g p by the number of pixels occupied by target T j on camera ˆ j , the resolution increases monoCi ’s image plane. Given g p tonically with zoom ζ of the imaging camera. Relative pose between camera Ci and target T j is quanˆ j ). Given g x ˆ j , the tified by the pose quality factor αij (ai , g x j j scalar αi is large when it is likely that target T is facing camera Ci and at the center of Ci ’s FoV. Example definitions of αij and rij are stated in Section IV. Risk is the probability that the target is outside the FoV of the cameras expected to image it. If the risk is neglected, then all NC cameras would maximize their zoom values and select their pan and tilt parameters to center on the expected target location. Risk increases monotonically with zoom ζ, because the area under the FoV decreases as ζ increases. We address risk by using the expected value of the tracking constraints and the imaging value. 2) Bayesian Imaging Value: We define the global Bayesian imaging value function for time tl = tk+1 as
h=1
ˆ j (k + 1)− = At time-step tk+1 , for horizon H, define X j − j − j ˆ (k + H) } and P (k + 1)− = {Pj (k + {ˆ x (k + 1) , . . . , x − j 1) , . . . , P (k + H)− } to be the estimated target trajectory for target T j , and the set of covariance matrices associated ˆ j (k + 1)− . with the corresponding state estimates in X For j = 1, . . . , NT , time-step tk+1 , and horizon H, define − j − − ˆj ˆ− X (k+1) = {X (k + 1) } and P(k+1) = {P (k + 1) } to be the set of estimated target trajectories and their associated covariance matrices for all targets, and A(k+1) = {a(k + 1), . . . , a(k + H)}
(7)
VI a(l)
�
=
NC NX T (l) X
�
Epj VIji ai (l), g xj (l)
(8)
i=1 j=1
=
NC Z X i=1
NT (l)
X
FoVi j=1
� � VIji ai (l), z ppj l, z dz,
where an example VIji is defined in Eqn.� (37) of Section IV-A. The probability distribution ppj l, z for the position of T j in the global frame at imaging instant tl , is the ˆ j (l)− , Pjpp (l)− ), where Pj− Normal distribution N (g p pp is the position error-covariance matrix as defined in Eqn. (4).
2084
The dummy variable z representing target state is used for integration over the ground plane, where the region of integration of the i-th camera is its FoV. The integral as a function of the probability weighted target position yields the Bayesian value function, which provides the desired tradeoff between image quality and risk. Given the Bayesian imaging value from Eqn. (8), the expected global Bayesian imaging value at time tl over planning horizon H is defined as X � � l+H−1 VI a(h) , VH A(l) =
(9)
All variables in Eqn. (12) are as defined in Eqn. (8), and the summation over all the cameras is accounted for already in eqn. (11). The tracking constraint for T j at time tl is � ¯ j, (13) VTj a(l) � T ¯ j is a constant tracking accuracy parameter specified where T by the user and the notation ‘�’ indicates a per-element vector inequality. For j = 1, . . . , NT , stacking the Bayesian tracking value vectors for each target, we obtain ��> � � � , (14) VT a(l) = VT1 a(l) , · · · , VTNT a(l)
h=l
where A is as defined in Eqn. (7). In Eqn. (9), the PTZ sequence A(l) is the optimization variable, and is computed starting from time tl over horizon H. From definitions in Section II, and from Eqns. (8) and (9), it should be noted that VH is also dependent on the predicted target trajectories ˆ − and their associated covariance matrices P − . X (l) (l) 3) Problem Constraints: The tracking performance constraints enforce tracking of all targets to a specified accuracy ¯ The constraint at time tl for target T j will be defined T. as a function of the expected posterior �+ Fisher informaˆ j (l), Pjpp (l) , for PTZ settings tion matrix Jj a(l) : g p a(l) given the expected distribution of target T j ’s position ˆ j (l)− , Pjpp (l)− ). N (g p The Fisher information matrix Jj for T j in block form is � j+ � Jpp Jj+ j+ pv J = , (10) Jj+ Jj+ vp vv where Jj+ pp represents the posterior position information matrix, which at time tl is Jjpp (l)+ = Jjpp (l)− +
NC X
Hji (l)> Cji (l)−1 Hji (l).
(11)
i=1
In Eqn. (11), the matrices Hji and Cji are the observation matrix and the measurement covariance matrix, respectively. As shown in [4], Hji and Cji are functions of ai (l) and target position g pj (l). Therefore, Jjpp (l)+ depends on a(l) and on the distribution of target positions at tl . For time tl � j j + + and horizon H, define J (l) = J (l) , . . . , Jjpp (l + pp + H − 1) to be the set of posterior position information + matrices. For j = 1 to NT , define J(l) = {J j (l)+ } to be the set of posterior position information matrices for all targets. For time tl , we define a vector UjT (a(l), g pj (l)) as a measure of tracking performance for each target in the area. � One example is UjT (a(l)) = diag Jjpp (l)+ , where Jjpp (l)+ is as defined in Eqn. (11). The quantity UjT (a(l)) depends on whether target T j is within the FoV of each camera that is expected to image it at time tl . Therefore, we define the global Bayesian tracking value vector VTj (a(l), g pj (l)) as the expected value of the tracking performance vector UjT (a(l), g pj (l)) over the position of target T j at time tl , computed across all the camera’s FoVs: �
�� VTj a(l) = Epj UjT a(l), g pj (l) (12) Z �� � = UjT a(l), z ppj l, z dz.
and rewrite Eqn. (14) for all targets presently in the area as � ¯ � 0, g a(l) = VT (a(l)) − T (15) where g ∈ �> (16) gH A(l) = g a(l) , . . . , g a(l + H − 1) to be the vector of global Bayesian tracking constraints computed for imaging instant tl , over optimization horizon H, where gH ∈ � > > The vector � = �1 , . . . , �> ∈ 3 i = 1, . . . , NC , �i = [¯ ρi , τ¯i , ζ¯i ] ∈ < is the user defined upper bound on the permissible change in camera Ci ’s PTZ parameters between successive time-points. Given Eqn. (17), for time tl and horizon H, define � � �> �> �> qH A(l) = q a(l) , . . . , q a(l + H − 1) , (18) to be the vector of concatenated global smoothness constraints computed for imaging instant tl , over optimization horizon H, where qH ∈ �> � � , (26) qHi Ai(l) = qi ai (l) , . . . , qi ai (l+H−1) to be the vector of concatenated local smoothness constraints computed for future imaging instant tl , over optimization horizon H. The horizon smoothness constraint qHi ∈ �> �> � � . (27) qH A(l) = qH1 A1(l) , . . . , qHNC ANC (l) � The constraints for camera Ci only include qHi Ai . 4) Local Problem Summary: From Eqns. (22), (23), and (26), the local constrained imaging value maximization problem, for imaging instant tl , over planning horizon H is � ˆ− , P− (28) maximize VHi Ai(k) : X (l) (l) � − − mH ˆ ,P , subject to gHi Ai(l) : X (l) (l) � 0 ∈ < � qHi Ai (l) � 0 ∈ Li (λi , µi , Ai ) = VHi (Ai ) + λ> i gHi (Ai ) + µi qHi (Ai ), (29) where Li : (λi , µi , Ai ) 7→ The term Hj−i (Cj−i )−1 Hj−i is computed from A−i (l), which are available at Ci through frequent communication between cameras. Hence, camera Ci regards the bracketed term in Eqn. (24) to be constant and known.
λi ∗ � 0, µ∗i � 0, (32) λi
∗>
gHi (A∗i )
∗ = 0, µ∗> i qHi (Ai ) = 0. (33)
where, for the optimization problem in Eqn. (28), the optimal primal-dual set of solutions (A∗i , λi ∗ , µ∗i ) must satisfy the KKT conditions given by Eqns. (30 - 33). Optimization stops
2086
g
pC1 pC2 g pC3 F oV1 F oV2 F oV3 F-F oV1 F-F oV2 F-F oV3 g j p g ˆ j+ p Entry Exit
20
g
18
y-position in global frame
16 14 12 10 8 6 4 2 0 0
2
4
6
8
10
12
14
16
18
20
x-position in global frame
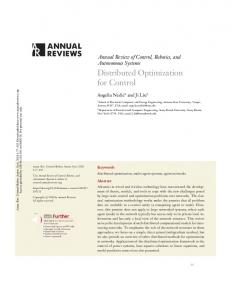
Fig. 2: Top-view of 20×20 surveillance area with optimized FoVs at t = 21 for H = 3. Camera locations are indicated by colored stars. The camera’s FoV boundaries are drawn as solid wide and dashed lines on the ground plane using the same color as its star. The FoV of the camera is the convex area interior of these polygons.
when either an optimum is achieved, a stopping condition is met, or optimization time interval elapses (see Fig 1). The KKT conditions described in Eqns. (30 - 33) provide a certificate on the optimality and feasibility of the solution computed. Numeric algorithms solve the constrained optimization problem defined in Eqn. (28), to which the KKT conditions of Eqns. (30 - 33) apply, first find a feasible solution, then search within the feasible set for the optimal feasible solution. Thus, when the time interval allotted for optimization elapses, even if the solution is sub-optimal, the methodology aids the network in finding a solution that is feasible. This results in all targets likely being tracked to the specified tracking accuracy, and all cameras adhering to the smoothness criterion, while procuring high-res imagery. After optimization, the cameras alter their settings to the optimal values in readiness for upcoming images at tk+1 . Thus, by using the PTZ replacement method and the Lagrange multiplier update law from [4], at each optimization iteration κ, every camera maintains an estimate of the primaldual solutions of all cameras. IV. S IMULATION E XPERIMENTS This section describes a Matlab simulation of the proposed approach. The goal of the simulation is to evaluate the performance of a distributed PTZ camera network setup to obtain high-res facial imagery of targets moving in a region, while achieving target tracking and PTZ smoothness constraints at all times. A. Scenario, Setup and Experiment Details Fig. 2, shows a 400 m2 area being monitored by NC = 3 calibrated cameras located at C1 = [10, 0, 3]> , C2 = [0, 10, 3]> , and C3 = [20, 10, 3]> m. Camera locations are indicated by colored stars. Fig. 2 also shows the postoptimization camera FoVs computed at time t = 21 for H = 3. The FoV boundary for each camera is drawn in a color coordinated with the color of the camera position marker, where it is drawn as a wide solid line for h = 1,
and as dashed lines for 1 < h ≤ H. Note that the FoV is the area in the interior of these polygons. The actual position of each target’s centroid is marked by a blue dot, with the corresponding posterior trajectory estimates marked by red dots. Every target T j is modeled as a circular disc of negligible height and a radius of 20 cm (shown as pink dashed curves relative to the target’s true position). All target discs are coplanar to the ground plane. The posterior 1 − σ position error ellipses corresponding to the estimated target trajectories are drawn as black curves. The entrance to the area is located at y = 20, x ∈ [1, 3] and indicated by the cyan hash marks in Fig. 2. Targets enter at random times; therefore, the total number of targets in the area is time variant. When a target T j enters the area, its position coordinates are randomly initialized in [g xj , g y j , 0]> , where g xj ∈ [1, 3] and g y j = 20. When a new target is detected, the number of targets NT (t) is increased, and the target state is augmented to the state vector and included in the imaging and tracking value functions. The maximum number of targets permissible in the area was limited such that 0 ≤ NT (t) ≤ N T where N T = 10. To ensure that targets entering the area are detected, the entrance must be constantly monitored. This is achieved by inserting an artificial stationary target at (2, 20, 0) with constant position uncertainty of 2m2 . The exit to the room is located at y = 0, x ∈ [2, 10] and indicated by the black hash marks in Fig. 2. Once in the room, the target’s motion is generated using Eqn. (1). Note that the target trajectory may intersect a wall. If the point of intersection is not the exit, then the target trajectory reflects off the wall. If the point of intersection is the exit, then the target has exited the room, in which case, the target state is removed from the state vector, excluded from the imaging and tracking value functions, and the number of targets NT (t) is decreased. Let nji (ai ) represent the area occupied by T j ’s image on Ci ’s image plane measured in sq. pixels. For this simulation, the estimation routine models the covariance of the measurement of T j by Ci as j ni (ai ) 2 σ 0 x , Cji (ai ) = pi (34) nji (ai ) 2 0 σ y pi where pi is Ci ’s image plane pixel resolution, and σx2 and σy2 are positive constants. For this simulation, each camera Ci was set to an image resolution pi of 800 × 600 sq. pixels, with σx = σy = 20 pixels. Based on the properties described in Section III-A, we define the imaging value associated with target T j when imaged by camera Ci . Let vector ovj be the target’s estimated velocity vector. Define the vector oCi = gci R ci e3 , to be the i-th camera’s optical axis direction in the global frame, where e3 = [0, 0, 1]> . Define oT j to be the vector from camera Ci ’s position to target T j ’s estimated position. Using the vectors ovj , oCi , and oT j we define the scalars oCi · oT j oCi · ovj oc = , and oo = . (35) k oCi kk oT j k k oCi kk ovj k
2087
d. Pan Angles
a. Expected Bayesian Tracking Value for each target 4
10
ρ1 ρ2 ρ3
Pan ρ◦i
−50 0
10
5
10
15
20
25
5
30
15
20
25
30
Simulation Time
b. Achieved Bayesian Tracking Value for each target
e. Tilt Angles
1
VT (a)
τ1 τ2 τ3
2
VT (a)
3
10
50
4
VT (a) 5 VT (a) 6 VT (a) 7 VT (a) 8 VT (a) 9 VT (a) 10 VT (a)
0
10
5
10
15
20
25
30
Simulation Time
c. Achieved Imaging Value
V I (a)
6
10
V I (a)
V I1 (a1 )
T
4
10
2
10
∗
3
VT (a)
2
10
10
V I3 (a3 )
10
Simulation Time
1
V I2 (a2 )
0
Tilt τi◦
T
2
10
0
−50
5
10
15
20
25
30
Simulation Time
f. Zoom Values
10
ζ1 ζ2 ζ3
8
Zoom ζi ∗
V3T (A) V4T (A) V5T (A) V6T (A) V7T (A) V8T (A) V9T (A) V10 T (A)
VT (a)
V2T (A)
VT (a)
V1T (A)
∗
50
6
4
2 0
10
5
10
15
20
25
5
30
10
15
20
25
30
Simulation Time
Simulation Time
Fig. 3: Moving horizon optimization with H = 3: Fig. a shows the tracking value VT (A) that every camera expects to achieve for every target over ¯ T that every camera actually achieves. Fig. c plots the achieved local imaging and global planning horizon H = 3. Fig. b shows the tracking value V imaging values (i.e., sum of the local values). Figs. d, e, and f show the optimal pan ρ◦i ∗ , tilt τi◦ ∗ and zoom ζi ∗ , respectively.
The scalar oc ∈ [−1, 1] yields the maximum possible positive value of 1 if camera Ci images target T j such that T j is at the center of its FoV. The scalar oo ∈ [−1, 1] has maximum magnitude when T j ’s motion vector ovj is pointing directly toward or away from camera Ci . To define the pose quality factor αij (ai ), we use the following assumption. Assumption 1: (Facial Direction) Target T j faces in the direction indicated by vector ovj . From Assumption 1 and Eqn. (35), when the scalar oo < 0, T j is likely to face camera Ci . This condition differentiates between targets facing Ci and those facing away from it. The relative pose quality factor is thus defined as � 2 (oc oo ) if oo < 0 (36) αij (ai ) = 0 otherwise. Hence when αij ∈ [0, 1] is large, it is likely that T j is facing Ci and at the center of Ci ’s FoV. The imaging value to be obtained by camera Ci for imaging T j is defined as � � � ˆ j , (37) ˆ j αij ai , g x ˆ j , t = wij (t) rij ai , g p VIji ai , g x where, the weight wij (t) is defined as the continuously differentiable and bounded function � � � (38) wij (t) = σd dj (t) σv V¯ j , VIji (t) . ��−1 In Eqn. (38), the scalars σd = 1 + 1 + exp ld dj (t) , ��� −1 and σv = 1 + exp lv V¯ j − VIji (t) . The symbol dj (t) is the distance between T j ’s estimated position at time t
� and the exit. The symbol V¯ j = maxτ , where ζ i is the minimum zoom value for camera Ci . Ci receives camera parameter sequences A∗−i through its neighbors, and optimizes its current parameter sequence Ai to implement the method described in Section III. A planning horizon of H = 3 time-steps was selected for this simulation. Fig. 3 shows the results obtained. For the area surveillance scenario in this paper, targets T 1 to T 10 entered the area at times 0.1, 10.2, 11.1, 14.2, 20.4, 22.9, 27.2, 28.8, 30.1, and 30.4 seconds, respectively. Target T 1 left the area at time 14.4 seconds. No other targets left the area. 1) Bayesian Imaging and Tracking Performance: Fig. 3a shows that the expected Bayesian tracking value VTj (A∗ ) is
2088
20
25
−50 5
8 6
15
20
Simulation Time
25
50 0
5
10
15
20
Simulation Time
25
(a) PTZ values for (H = 1; NC).
10
ζ1 ζ2 ζ3
10
2
10
τ1 τ2 τ3
15
20
Simulation Time
25
8 6
15
20
Simulation Time
25
∗
Pan ρ◦i
50
−50
10
15
20
Simulation Time
25
(b) PTZ values for (H = 1; SC).
30
10
τ1 τ2 τ3
15
20
25
30
15
20
25
30
15
20
25
30
Simulation Time
0
5
10
ζ1 ζ2 ζ3
10
2 5
5
30
4
30
ρ1 ρ2 ρ3
0
30
−50
30
4
5
5
Zoom ζi ∗
Zoom ζi ∗
10
ζ1 ζ2 ζ3
10
∗ 30
−50
∗
15
Simulation Time
0
50
Tilt τi◦
0
10
τ1 τ2 τ3
−50
ρ1 ρ2 ρ3
Zoom ζi ∗
∗
50
Tilt τi◦
5
Pan ρ◦i
0
50
∗
Pan ρ◦i
−50
ρ1 ρ2 ρ3
Tilt τi◦
∗
50
8 6
Simulation Time
4 2 5
10
Simulation Time
(c) PTZ values for (H = 3; SC).
Fig. 4: Optimal PTZ values: NC - No PTZ smoothness applied; SC - PTZ smoothness applied. Figs. a and b show the optimized PTZ values over H = 1, with and without PTZ smoothness constraints, respectively. Fig. c shows the optimized PTZ values when PTZ smoothness is applied for H = 3.
¯ = 1.0 m−2 for every target. greater than the tracking spec T Therefore, all primal-dual solutions (A∗i , λ∗i , µ∗i ) obtained through local optimization are expected to be feasible at all imaging instants. Because the expected solutions are strictly feasible, using Eqn. (33), it is trivial to prove that λ∗i (t) = ¯ = 0 ∈