16
Acta Orthop Scand 2003; 74 (1): 16–21
Distribution of chondroitin 4-sulfate epitopes (2/B/6) in various zones and compartments of articular cartilage in guinea pig osteoarthrosis Lei Wei1,2,5, Bo Harald Brismar1,2, Kjell Hultenby2, Anders Hjerpe3 and Olle Svensson4
Acta Orthop Downloaded from informahealthcare.com by 177.207.211.250 on 05/20/14 For personal use only.
1Center
for Surgical Sciences, Division of Orthopedics, Karolinska Institutet, Huddinge University Hospital, Sweden, 2Clinical Research Center, Karolinska Institutet, Huddinge University Hospital, Sweden, Departments of 3Immunology, Microbiology and Pathology, Division of Pathology, Karolinska Institutet, Huddinge University Hospital, Sweden, 4Perioperative Sciences, Division of Orthopaedics, Umeå University Hospital, Sweden, 5Orthopedics and Rehabilitation, Pennsylvania State University, USA. Correspondence: Harald Brismar, Department of Orthopedic Surgery, K54, Huddinge University Hospital, SE-141 86 Stockholm, Sweden.
[email protected] Submitted 01-12-15. Accepted 02-08-08
ABSTRACT – We studied changes in the morphology of tibial articular cartilage in early guinea pig osteoarthrosis (OA) at 6 and 12 months of age with quantitative light microscopy, and the distribution of chondroitin-4-sulfate with quantitative ultrastructural immunolabeling, using the 2/B/6 epitope. Labeling was correlated to previous chromatography findings concerning proteoglycan (PG) concentration in animals of the same age. The cell volume fraction had decreased at 12 months in the superficial zone of cartilage with OA (medial condyle) as well as in cartilage without OA (lateral condyle), being lower medially than laterally. The PG concentration differed between the zones and matrix compartments. Medially, a reduction in PG concentration occurred between 6 and 12 months in the interterritorial compartment of the two uppermost zones. Laterally, the concentrations increased. In general, the pericellular PG concentration was higher than the interterritorial in the two uppermost zones. The striking variation in structural and labeling responses in the various zones and compartments indicate a heterogeneous tissue response in guinea pig OA that will probably affect sampling in biochemical analyses of cartilage homogenates and synovial fluid.
Most animal osteoarthrosis (OA) models—e.g., transection of the anterior cruciate ligament (Hulth et al. 1970, Pond and Nuki 1973, Brandt et al. 1991) or meniscectomy (Colombo et al. 1983, Little et al. 1997)—involve a joint injury
inducing secondary OA. However, there are also naturally occurring arthropathies in animals—e.g., Hartley guinea pigs that spontaneously develop a condition, which is morphologically similar to human OA (Bendele and Hulman 1988). Guinea pig OA of the knee develops in a reproducible manner, first affecting the central portion of the medial condyle—the part of the joint that is not covered by a meniscus and which is presumably subjected to the highest load—where gross lesions are invariably present at 12 months (de Bri et al. 1995). An increase in the severity of guinea pig OA is paralleled by a decrease in proteoglycan (PG) and collagen concentrations (Wei et al. 1997). The lower PG concentration is probably largely due to a reduction in synthesis (Wei et al. 1998). The mechanical properties of cartilage are determined by its macromolecular matrix constituents—i.e., collagens and PGs—and its large content of water. Aggrecan is the most abundant PG, which provides elasticity by means of a high concentration of fixed charges of its chondroitin sulfate side-chains, that mainly have sulfate at the 4th or 6th position of the hexosamine moieties. The composition of matrix can be analyzed at different anatomical sites biochemically, but it is more difficult to clarify the more delicate patterns of distribution in zones and matrix compartments. Immunohistochemical techniques give a higher resolution in the study of specific chemical structures. Antibodies against PG-related epitopes have been used to study the distribution of these sub-
Copyright © Taylor & Francis 2003. ISSN 0001–6470. Printed in Sweden – all rights reserved.
Acta Orthop Scand 2003; 74 (1): 16–21
Acta Orthop Downloaded from informahealthcare.com by 177.207.211.250 on 05/20/14 For personal use only.
stances in cartilage (Caterson et al. 1985). In the present study, we used the 2/B/6 preparation which reacts with an unsaturated, terminal 4-sulfated chondroitin disaccharide, obtained after partial chondroitinase digestion of the chondroitin sulfate chain (Couchman et al. 1984). We examined changes in PG distribution in relation to zones and matrix compartments during the development of guinea pig OA.
Animals and methods Ten 6- and 12-month-old male Hartley guinea pigs (n = 5) (Møllegård, Copenhagen, Denmark) were used for light microscopy and ultrastructural studies. The 2/B/6 antibody was a generous gift from Prof. Bruce Caterson (Cardiff, Wales). Goat-antimouse IgG antibodies conjugated with 10 nm gold particles were obtained from Amersham (Buckinghamshire, UK), nonspecific goat serum and chondroitinase ABC from Sigma (St. Louis, MO, USA). All other reagents were of analytical grade. The animals were heparinized, anesthetized and fixed by vascular perfusion, with an equal mixture of 0.3% phosphate-buffered glutaraldehyde and 0.3% paraformaldehyde (Svensson et al. 1987). The proximal tibiae were dissected and cut sagitally into medial and lateral portions. From the nonmeniscus-covered parts, half a mm thick vertical slices, including cartilage and part of the subchondral bone, were cut with a sharp chisel and then immersed in the same fixative for 2 h. Specimens were dehydrated at –45 °C and embedded in a polar resin (Hultenby et al. 1991). 1 µm thick sections from 2–4 blocks of each condyle were used for light microcopy. One micrograph covering the 4 zones was taken from each section. Volume densities (Vv) of matrix and chondrocytes in the various zones were estimated by point counting (Gundersen et al. 1988), including the entire lacunae in the estimate of the cell Vv. The superficial zone was regarded as the top layer of cartilage with flattened and relatively small cells with their long axes parallel to the articular surface. The intermediate zone was the area beneath the superficial zone, characterized by its larger oval or round cells. The next, deep zone was the underlying area down to the calcified zone, as
17
defined by the position of the tidemark. In the deep zone, the chondrocytes increase in size and tend to be disposed in columns with their axes more or less perpendicular to the articular surface. The calcified zone is the remaining cartilage beneath the tidemark and down to the subchondral bone (Meachim and Stockwell 1979). In the electron microscopy studies, 2 central ultrathin sections (35–40 nm) from 2 blocks of each condyle were cut and placed on formvarcoated nickel grids. Sections were digested with chondroitinase ABC, 0.2 units/mL in 0.1 M Tris-HCl, pH 7.5, containing 0.1% bovine serum albumin for 15 min at room temperature. To block nonspecific binding, sections were placed on 10% normal goat serum, and then incubated in a humidified chamber overnight, with the specific antibody diluted 1:500 in 0.1 M phosphate buffer and containing 0.1% normal goat serum (PBG). The sections were then thoroughly rinsed in 0.1 M PBG, and bound antibodies were detected with secondary gold-conjugated antibodies. All immunological incubations were done simultaneously, using the same stock solutions. Subsequently, the sections were contrasted with 4% uranyl acetate and lead citrate and examined with a Philips 400T electron microscope at 80 kV, using undigested sections as controls. Electron micrographs, final magnification ×66,000, were used to detect the chondroitin-4sulfate distribution along the superficial, intermediate, deep and calcified zones. In each zone, 2 matrix compartments (pericellular and interterritorial) were defined on printed copies, apart from the calcified zone, where it is difficult to distinguish the pericellular compartment. This compartment was defined as the area within 1 µm of the cell surface. The interterritorial compartment, which has thicker collagen fibrils, was sampled at low magnification on the microscope screen, midway between two cells, and high magnification pictures were taken, using a stratified random sampling technique. From each section 21 micrographs were prepared from the 4 zones: 3 micrographs from the interterritorial and 3 from the pericellular matrix of each unmineralized zone and 3 from the calcified zone. The grain counts were used as relative values comparing various parts of the same section and
Acta Orthop Downloaded from informahealthcare.com by 177.207.211.250 on 05/20/14 For personal use only.
18
Acta Orthop Scand 2003; 74 (1): 16–21
Table 1. Cell volume density (proportion of cells to the total volume then correlated to concentration values of the zone) in articular cartilage of medial (OA) and lateral (without previously obtained by high-perforOA) tibial condyles of 6- and 12-month-old guinea pigs. mance liquid chromatography from a Mean (SD) material with the same age distribution of animals (Wei et al. 1997). Therefore, Cell volume density the epitope concentration, measured Medial condyle Lateral condyle as density of gold grains, was recalcuCartilage zone 6 months 12 months 6 months 12 months lated to give the amounts of 4-sulfated chondroitin sulfate disaccharides in Superficial 6.4 (3.6) 0.8 (1.6) a 9.3 (4.8) b 6.3 (2.9) ab Intermediate 7.7 (2.1) 5.4 (1.6) 8.3 (2.8) 6.8 (4.5) chemical terms, considering the volume Deep 8.4 (1.5) 7.5 (1.7) 9.2 (1.3) 8.2 (1.7) densities of the matrix, and allowing the estimation of concentrations in the varia p = 0.02, as compared to the corresponding value at 6 months. ous tissue compartments. The amount b p = 0.03, as compared to the medial condyle at 12 months. of label was estimated in each zone as the product of labeling density (ai) and the corresponding zonal volume density (matrix of the articular surface, and cartilage destruction. in a zone as a proportion of total tissue volume, These were consistent findings on the medial but Vvzone), the sum of these products {A=Σ(ai × not the lateral condyle. With the light microscope, Vvzone)} reflecting the concentration of epitope the superficial layer seemed slightly less cellular in the total tissue volume. The value obtained (A) on the medial side as early as at 6 months. At 12 and the corresponding chemically determined con- months, cell Vv on the medial side was considercentration of chondroitin-4-sulfate disaccharides ably lower in the superficial zone (Table 1). In the ([CS4]) were then used to calculate a constant deep zone, cell clustering and hypertrophy were (k=[CS4]/A) that permitted the translation of any salient features medially (Figure 1). labeling density into estimates of concentration The PG concentration in the superficial and ([CS4]i=k × ai). intermediate zones decreased between 6 and 12 months medially, while it increased laterally. Statistics These changes were seen in both the pericellular Results were analyzed using a two-way ANOVA and territorial compartments. At 6 months, the with repeated measures on one factor. The within PG concentration was the same or slightly higher factor was Condyle (levels: medial and lateral side) medially, while at 12 months, it was almost 100% and the between factor was Age (levels: 6 and 12 higher laterally than medially, except in the deep months). In case of significant interaction, simple and calcified zone. The levels in the deep zone effects were examined—i.e., effects of one factor increased between 6 and 12 months at both sides, holding the other factor fixed. The p-values were except in the interterritorial compartment medially then corrected, using the Bonferroni procedure. P- where it remained unchanged. The levels in this values less than 0.05 were considered statistically zone were higher medially than laterally (Table significant. Due to technical problems in process- 2). ing the tissue, one 12-month lateral condyle could One striking finding was that the tissue responses not be analyzed. An additional lateral condyle of varied, not only between the various zones, but also an animal from the same litter was therefore pro- that the amounts of PG available for incorporation cessed and used as a matched pair. in the interterritorial matrix were also affected. Medially, in the superficial zone, the pericellular concentration decreased by 61% between 6 and 12 months; the corresponding figure in the intermediResults ate zone was 52%, while the concentration in the At 6 months, no gross changes were detected on deep zone increased by 37%. The pericellular PG either tibial condyle. However, at 12 months, we concentration was usually higher than the interterfound macroscopic roughening and fibrillation ritorial in the two uppermost zones.
Acta Orthop Downloaded from informahealthcare.com by 177.207.211.250 on 05/20/14 For personal use only.
Acta Orthop Scand 2003; 74 (1): 16–21
19
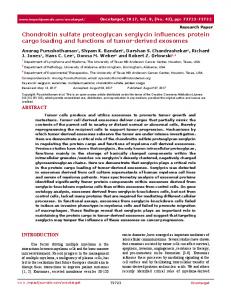
a
b
c
d
Histological sections from the medial (a) and lateral (b) tibial condyles of a 6-month-old guinea pig without osteoarthrosis. At 12 months, the medial condyle (c) shows osteoarthrosis, with fibrillation and a few chondrocytes remaining in the superficial and intermediate zones. The corresponding joint surface of the lateral condyle (d) is intact, but there are a few cells in the superficial zones. (toluidine blue).
Table 2. Chondroitin-4-sulfate concentrations in the pericellular (pc) and interterritorial (it) compartments in various zones of the medial and lateral condyles of the tibial articular cartilage in 6- and 12-month-old animals (µg UA/mg dry tissue weight). Mean (SD). Calculations based on labeling density, matrix volume density and the total concentration of chondroitin-4-sulfate disaccharides determined chromatographically (5). (For calculations, see methods) 6 months Zone
Superficial
Compart- Medial ment condyle
pc it Intermediate pc it Deep pc it Calcified it
8.2 (5.3) 4.5 (0.9) 6.7 (2.1) 5.3 (0.8) 8.4 (2.1) 10.2 (0.8) 4.1 (0.6)
12 months
Lateral condyle
Medial condyle
Lateral condyle
4.8 (1.8) 3.5 (1.0) 5.0 (1.5) 4.5 (1.0) 4.3 (1.1) 6.7 (0.5) 3.1 (0.6)
3.2 (2.4) 1.8 (1.3) 3.2 (2.2) 3.5 (1.0) 11.4 (1.4) 9.6 (0.9) 1.5 (0.5)
11.1 (4.0) 7.9 (2.8) 10.0 (3.9) 7.4 (1.0) 9.7 (3.5) 8.2 (0.7) 2.0 (0.4)
P-values Med vs Lat 6 months 0.1 0.7 0.08 0.3 0.02 0.004 0.002
Med vs Lat 12 months
Med 6 vs 12 months
Lat 6 vs 12 months
0.03