Mammalia 76 (2012): 201–207 © 2012 by Walter de Gruyter • Berlin • Boston. DOI 10.1515/mammalia-2011-0008
Distribution, suitable areas and conservation status of the Felou gundi (Felovia vae Lataste 1886)
Cândida G. Vale, Francisco Álvares and José C. Brito* CIBIO, Centro de Investigação em Biodiversidade e Recursos Genéticos da Universidade do Porto, Instituto de Ciências Agrárias de Vairão, R. Padre Armando Quintas, 4485-661 Vairão, Portugal, e-mail:
[email protected] *Corresponding author
Abstract Felovia vae is an endemic rodent from West Africa with special conservation concern. Although the global range is relatively well known, the lack of knowledge on its local distribution patterns and ecological parameters resulted in the IUCN category of Data Deficient. This study identifies environmental factors related to the occurrence of Felovia vae, quantifies suitable areas of occurrence, and evaluates its conservation status. High-resolution presence data (1 × 1 km) were combined with environmental factors to derive ecological niche-based models of species occurrence. Ecological models predicted that Felovia vae occurs more frequently in areas with high slope and close to gueltas, bare areas and rocky deserts. The fine-scaled ecological models suggest eight suitable habitat patches, representing fragmented subpopulations located in the Mauritanian mountains and in the Bafing, Felou, Nioro, and Yelimane regions of Mali. Fieldwork observations and predicted suitable areas were used to evaluate conservation status. Felovia vae was categorised as Least Concern, given that values for all parameters analysed were above the thresholds of Threatened classification. The species may be susceptible to human-induced habitat loss, global warming and natural disasters, such as drought, given its reliance on water availability. Keywords: conservation; ecological model; GIS; mountain; Red List; Sahara.
Introduction The Felou gundi (Ctenodactylidae: Felovia vae Lataste 1886) is an endemic rodent from West Africa, where it is only known from the mountains of Mauritania (Adrar Atar, Tagant, Assaba and Afollé) and scattered localities in Mali, along the Senegal River valley (Dekeyser and Villiers 1956, George 1974, Le Berre 1990, Aulagnier 2008a, Padial and Tellería 2009). Recently, 40 new observations of F. vae were reported in Mauritanian mountains (Brito et al. 2010), providing further evidence for the mountain-restricted character of the
species. Felovia vae has been reported to be a rock outcrop specialist (George 1974), and in Mauritania it was observed in river canyons, particularly in the proximity of rock pools (locally known as guelta), boulder grounds, and cliffs (Padial and Tellería 2009, Brito et al. 2010). Although the global range of Felovia vae is relatively well known, there are many knowledge gaps concerning local distribution and fragmentation levels in West Africa. For instance, populations from Mauritania and Mali are apparently isolated (Brito et al. 2010). Thus, high accuracy mapping of suitable areas for species occurrence and the evaluation of potential connectivity between populations of southern Mauritanian mountains with populations in Mali should be considered priority for the development of optimised local conservation strategies. Also, it has been suggested that populations within Mauritanian mountains may be fragmented by probable unsuitable habitats, such as permanently dry and dune-covered areas (Brito et al. 2010). Nevertheless, the contribution of climatic and habitat factors to the isolation of this species remain unknown. Felovia vae has been considered threatened by deforestation and desertification (Schlitter 1989, Amori and Gippoliti 2003) and an African rodent of special conservation concern (Schlitter 1989). Probably there has been a decrease in habitat quality as a consequence of the severe droughts that affected the Sahel region from the 1970s onwards (Ahmed et al. 2008, Mahé and Paturel 2009), inducing local extinction in other vertebrates (Trape 2009). In addition, changes in availability of suitable habitats may also occur in the future as a result of the forecasted climatic changes for the region (Brooks 2004, Held et al. 2005). Nevertheless, the lack of knowledge on population size, range dimensions, ecology and population trends of the species resulted in the IUCN category of Data Deficient (DD) (Aulagnier 2008a). The aims of this study are to identify environmental factors related to the occurrence of Felovia vae, quantify suitable areas for species occurrence, and evaluate its conservation status. High-resolution presence data (1 × 1 km) will be combined with environmental factors to derive ecological nichebased models of species occurrence. Fieldwork observations and predicted suitable areas will be used to evaluate conservation status.
Materials and methods The study area is located in West Africa, between 12.5°N and 23.5°N, and west of 5.0°W, covering Mauritania, southern Morocco, Senegal, The Gambia and south-western Mali (Figure 1). In Mauritania, there are four main mountain massifs: the Adrar Atar in the central region, and the Tagant,
Brought to you by | Universidade do Porto (Universidade do Porto) Authenticated | 172.16.1.226 Download Date | 6/28/12 2:15 PM
202
C.G. Vale et al.: Distribution, habitats and conservation of Felovia
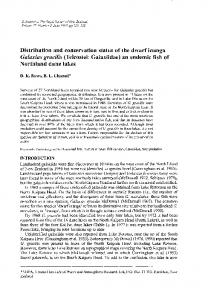
Figure 1 Distribution of observations of Felovia vae, major toponomies in the study area, and location of the study area in the African context. River names are given in stippled boxes.
Assaba and Afollé in the southern regions of the country. The Adrar Atar is separated from the remaining mountains by the El Khatt river basin, whereas the Tagant-Assaba mountains are separated from the Afollé by the Karakoro river basin (Figure 1). The two river basins lack significant rock outcrops and they are dune-covered, but whereas the El Khatt is permanently dry, the Karakoro is subjected to seasonal run-offs and it is relatively populated. Most of the study area is covered by sandy, stony and bare deserts (30.0%, 17.9%, 10.0%, respectively; Bicheron et al. 2008), but croplands and mosaics cropland-vegetation (17.6%), and closed to open shrublands and grasslands (11.8%) are more frequent in southern regions. A total of 61 observations (localities) were used to develop models (Dekeyser and Villiers 1956, George 1974, Nickel 2003, GBIF 2009, Granjon and Duplantier 2009, Padial and Tellería 2009, Brito et al. 2010) (Figure 1). Observations were collected from the period between 1956 and 2010, although 90% are post-2000. For 46 observations, the geographic location was recorded with a Global Positioning System (GPS) on the WGS84 datum (Brito et al. 2010), whereas the remaining 15 bibliographic observations included localities with geographic coordinates or with clear toponomies from which it was possible to gather coordinates from topographical maps (Institut Géographique National, IGN) to a precision of 1 km. The number of individuals was quantified by direct observation in 40 localities of Mauritania. Quantifications were made while sampling for other taxonomic groups (see Brito et al. 2010 for details). No traps were set or direct search of pellets was performed, which could have increased the total number of individuals detected.
Given that survey effort in Mauritania was spatially biased (mountains were more heavily sampled), resulting in observation clumps, it was necessary to reduce the level of spatial autocorrelation to avoid potential biases in model predictions (Phillips et al. 2009). From the global data set (n = 61), observations were removed from clusters of species occurrence, resulting in two data sets: one with 28 observations for training and testing models and another one with 33 observations that was used to calculate the extent of occurrence (see below). The Nearest Neighbour Index was used to assess the degree of data clustering (Brito et al. 2009): 0.60 in the global data set (n = 61) and 1.14 in the data set for model building (n = 28), indicating dispersed distribution for the latter. Spatial analyses were done with “Spatial Analyst” extension of ArcGIS 9.2 (ESRI 2006). Ecogeographical variables (hereafter EGVs) were selected for the ecological models according to their relationship with the ecology and distribution of Felovia vae (George 1974, Padial and Tellería 2009, Brito et al. 2010). EGVs included: (i) one topographical grid (USGS 2006) that was used to derive Slope, with the “Slope” function of ArcGIS; (ii) six climate grids (Hijmans et al. 2005); (iii) a land cover grid from the years 2004 to 2006 (Bicheron et al. 2008); and (iv) the presence of gueltas, digitised from the IGN maps for the all study area, and ground-validated by fieldwork only in Mauritania (Table 1). To convert the categorical land cover and presence of gueltas EGVs into continuous variables, one binary grid was created for each habitat type that covered more than 5% of the study area and for the presence of gueltas. The Euclidean distance of each grid cell to the closest habitat type was calculated for each individual habitat grid (nine habitat types) using the “Euclidian Distance” tool of ArcGIS (Brito et al. 2009). The same procedure was applied to presence of gueltas. A total of 10 “distance to” EGVs were analysed (Table 1). Finally, the resolution of all EGVs was decreased to a grid cell size of 0.0096 degrees (1 × 1 km) by averaging the EGV values inside each grid cell. Ecological niche-based models were developed with the Maximum Entropy approach (Phillips et al. 2006). Model input variables included slope, six climatic variables and 10 distances to habitat type EGVs. A total of 10 model replicates were run with random seed. Observations for each replicate were chosen by bootstrap allowing sampling with replacement in each model replicate. Observations were randomly chosen as test data (10%) for each model. Models were run with autofeatures and logistic output (Phillips et al. 2006). The area under the curve (AUC) of the receiver-operating characteristics (ROC) plot was taken as a measure of model fitness (Fielding and Bell 1997). The 10 replicates were averaged to generate a forecast of species presence probability (average model), which is a robust procedure to derive consensus predictions of species likelihood of presence (Marmion et al. 2009). Given that predictions can fluctuate between individual models, the standard deviation (SD) of model replicates was used as an indication of prediction reliability (Buisson et al. 2010, Carvalho et al. 2010). The importance of each EGV for explaining the distribution of the species was determined by its average percent
Brought to you by | Universidade do Porto (Universidade do Porto) Authenticated | 172.16.1.226 Download Date | 6/28/12 2:15 PM
C.G. Vale et al.: Distribution, habitats and conservation of Felovia
Table 1
203
Environmental factors used for modelling the distribution of Felovia vae in the study area.
Type
Variable
Range and units
Topographical Climatic
Slope Annual mean temperature Maximum temperature of warmest month Minimum temperature of coldest month Temperature annual range Annual precipitation Precipitation of wettest month Distance to croplands Distance to mosaic cropland/vegetation Distance to mosaic vegetation/cropland Distance to closed to open shrubland Distance to closed to open herbaceous vegetation Distance to sparse vegetation Distance to bare areas Distance to consolidated bare areas (rocky desert) Distance to non-consolidated bare areas (sandy desert) Distance to gueltas
0 to above 26% 20.4 –30.8°C 27.1– 48.0°C 8.5 –18.9°C 14.0 –39.3°C 11–1334 mm 4 – 455 mm 0 –7.51° 0 –7.62° 0 – 6.99° 0 –7.63° 0 – 6.02° 0 – 6.05° 0 –1.34° 0 –3.73° 0 – 4.92° 0 – 8.17°
Habitat
contribution to the models. The relationship between species occurrence and EGVs was determined by the visual examination of response curves profiles from univariate models (Brito et al. 2009). To quantify suitable areas for species presence, the average model was reclassified to display grid cells of probable absence and presence. The threshold of minimum probability for species presence (p = 0.0263) was chosen in order that all observations (n = 61) occurred in grid cells of probable presence (suitability model). The evaluation of the conservation status followed the methodology and criteria of IUCN Guidelines for Red Lists (IUCN Standards and Petitions Working Group 2008). Criteria of population reduction (A), geographic range (B), small population size and decline (C), and very small or restricted population (D) (IUCN Standards and Petitions Working Group 2008) were applied using Ramas Red List software (Akçakaya and Ferson 2001). Parameters for classification included: (i) population number, estimated from the number of mature individuals found during field sampling, the number of locations where the species was observed (see below, iv), and the area of occupancy predicted for the species by the suitability model (see below, iii); (ii) extent of occurrence, estimated by a minimum convex polygon method, which determines the area contained within the shortest continuous imaginary boundary which can be drawn to encompass all observations (n= 61) and the suitable area predicted by modelling. Calculations were made using Hawth’s Tools extension for ArcGIS (Beyer 2006); (iii) area of occupancy, calculated from the number of suitable cells predicted by the suitability model× area of a grid cell (1 × 1 km2); and (iv) population fragmentation, evaluated based on the number of subpopulations, which were quantified by the number of isolated suitable patches predicted by the suitability model, and the number of locations, quantified from the number of uncorrelated observations (training data set). Population reduction and continuous decline estimates were inputted in Ramas with values below the thresholds for
Threatened taxa classification (30% of reduction and 10–25% of continuous decline, according to future time periods).
Results The ROC plots exhibited high average AUCs for both training and test data sets: 0.994 (± 0.008 SD) and 0.985 (± 0.012 SD), respectively. Average highest SD of individual models occurred mostly in mountain tops (Figure 2). The ecological models identified distance to gueltas as the EGV most contributing to the individual models (average 63.9 ± 10.70% SD), followed by slope (18.0 ± 8.24%), distance to bare areas (5.64 ± 4.7%), and rocky deserts (2.21 ± 2.00%). All other EGVs had average contributions lower than 2%. The average profiles of response curves for these EGVs suggested that the species occurs more frequently in areas with high slope and close to gueltas, to bare areas, and to rocky deserts (Figure 3). The average model identified areas for the occurrence of Felovia vae in almost all Mauritanian mountain regions and also southwestern Mali (Figure 2). The El Khatt and Karakoro river valleys were identified as unsuitable for species occurrence. The suitability model identified approximately 6.8% of the study area as suitable for the occurrence of F. vae, of which 89.8% of suitable cells were located in the mountains and escarpments of Mauritania (81,946 km2), 8.1% in localised areas in Mali (7415 km2), and 2.1% in scattered grid cells in Senegal, and Morocco (Figure 2). The extent of occurrence and area of occupancy were estimated to be 263,035 km2 and 80,003 km2, respectively, and eight fragmented subpopulations were identified: Fdérik, Adrar Atar, Tagant-Assaba and Afollé in Mauritania, and Bafing, Felou, Nioro, and Yelimane, in Mali (Figure 2). Although the total number of locations is unknown, it should be much higher than 10 (threshold for Threatened classification), given the number of uncorrelated observations (n = 28) of Felovia vae detected. The number of individuals in each
Brought to you by | Universidade do Porto (Universidade do Porto) Authenticated | 172.16.1.226 Download Date | 6/28/12 2:15 PM
204
C.G. Vale et al.: Distribution, habitats and conservation of Felovia
Figure 2 Average probability of occurrence of Felovia vae and standard deviation (small inset at left) estimated by the ensemble of 10 Maximum Entropy models (left). Predicted suitability areas and subpopulations considered for evaluation of the conservation status (right).
group observed during the fieldwork in Mauritania ranged from one to around 25 (average 8.4 ± 5.4 SD) in each of the 40 localities sampled. Most groups included five (32.5%) or 10 individuals (40%), whereas larger groups of 25 individuals and smaller groups with fewer than three individuals were less common (12.5% and 15%, respectively). Taking into account the area of occupancy and the average number of individuals detected in each locality, the total number of mature individuals is probably much higher than 10,000 individuals
(threshold for Threatened classification).The input of these parameters in Ramas software gave the conservation status of Least Concern (LC).
Discussion The ecological models combined topographical, climatic and habitat variables to understand probable relationships
1.00 0.80 0.60 0.40 0.20 0.00 0.0
2.5
5.0
7.5
10.0
12.5
15.0
17.5
20.0
22.5
25.0
Slope (%) 1.00 0.80 0.60
Gueltas Bare areas
0.40
Rocky deserts 0.20 0.00 0.0 0.4 0.8 1.2 1.6 2.0 2.4 2.8 3.2 3.6 4.0 4.4 4.8 5.2 5.6 6.0 6.4 6.8 7.2 7.6 8.0 8.4 8.8 Distance (°)
Figure 3
Response curves for the environmental factors most related to the occurrence of Felovia vae in the study area. Brought to you by | Universidade do Porto (Universidade do Porto) Authenticated | 172.16.1.226 Download Date | 6/28/12 2:15 PM
C.G. Vale et al.: Distribution, habitats and conservation of Felovia
between Felovia vae occurrence and environmental gradients. Results suggest that species occurrence is mostly related to topography and land cover and not climatic variability. Felvovia vae was thought to occur in river canyon walls, rocky outcrops, cliffs, boulder slopes, and treeless habitats (George 1978, 1979, de Rouffignac et al. 1981, Padial and Tellería 2009, Brito et al. 2010), where in fact, probability of presence increased with slope and proximity to bare areas, rocky deserts, and gueltas, which are mostly associated with mountains. Distance to gueltas was the most important environmental factor related to species presence and it is probably associated with the presence of rock outcrops and water availability. Although gundis have been reported to rely on vegetation to regulate their water intake (de Rouffignac et al. 1981), F. vae was observed drinking water from gueltas in southern Assaba mountains (Figure 4). In the mountains of Mauritania, gueltas may be the only water source available for large distances (C.G. Vale et al., personal observation). Areas of probable occurrence identified for West Africa follow the general distribution patterns previously identified for the species (George 1974, Padial and Tellería 2009, Brito et al. 2010). Nevertheless, the fine-scaled ecological models allowed the definition of accurate suitable habitats. For instance, an observation of Felovia vae in Kediet Idjil (Fdérik) from the 1940s (Le Berre 1990), which was considered dubious and not used in model training or testing, was identified as a suitable area. The predicted suitable areas from where the species is presently unknown should be sampled in the future, particularly the Malian regions of Nioro and Yelimane, and the Mauritanian escarpments of Dhar TîchîtNéma. The models suggest that suitable areas are restricted mostly to isolated mountain habitats. For instance, suitable areas in the Adrar Atar are separated from the Tagant-Assaba by at least 20 km of unsuitable habitat, in the region of the dry and dune-covered El Khatt river basin, and suitable areas in the Tagant-Assaba are separated from the Afollé by at least 25 km, along the Karakoro river basin. Relatively large distances between suitable patches in southern Mauritania and Mali were
Figure 4 Felovia vae drinking water from a guelta in southern Assaba mountain (December 2007). Photograph by A.L. Acosta.
205
also found. Suitable areas for Felovia vae in southern Assaba are around 130 km apart from Felou. Additionally, the lower Senegal River is predicted as unsuitable, further supporting the likely isolation of Mauritanian populations. Probably, the isolation of Mauritanian subpopulations increased progressively after the mid-Holocene, with the gradual drying of the savannah-like ecosystem and development of arid conditions (Kröpelin et al. 2008). Although the ranging behaviour of F. vae is unknown, its relatively small body size and habitat specialisation may hamper dispersal and the gene flow between the eight potential subpopulations identified. Nevertheless, studies with molecular markers are needed to determine if genetic substructuring occurs among distinct subpopulations of this mammal. The number of individuals observed in each group was larger compared to previous estimations for Mauritania (Padial and Tellería 2009). Although the present study lacked specific methodology for population estimation, similar group sizes were reported in Mauritania (Padial and Tellería 2009) as in Felou (up to 25 individuals; George 1974). Felovia vae was categorised as Least Concern, given that all parameters analysed exceeded the thresholds for categorisation as Threatened. However, threats to the species include human-induced habitat loss, global warming and natural disasters, such as drought (Schlitter 1989, Amori and Gippoliti 2003, Padial and Tellería 2009). Given the close relationship with water availability, population size is likely to have declined because of droughts in the 1970s (Ahmed et al. 2008, Mahé and Paturel 2009). The species may also be negatively affected by climate changes, as climate models predict more frequent or severe droughts for the region (Brooks 2004, Held et al. 2005). Thus, although a decrease of habitat quality may be suspected for both past and future (18 years range) periods, population reduction and continuous decline estimates were inputted in Ramas with values below the thresholds for Threatened taxa classification. Quantitative data on population size and trends are needed to better estimate population reduction parameters and assess species vulnerability to climate change. The suitable areas predicted for Felovia vae are mostly restricted to Mauritanian mountains. Their biological value is being increasingly quantified (Tellería et al. 2008, Padial and Tellería 2009, Trape 2009, Brito et al. 2010, Padial et al. in press) and these results also highlight the importance of these island-like mountains. Although, recently the Lake Gabbou and the Hydrological Reserve of Tagant Plateau were designated as Ramsar site (Ramsar 2009), these results further suggest that the establishment of protected areas should be considered for the remaining mountains to minimise humaninduced threats. Distribution and habitat selection patterns observed in this study may give indications about other desert gundis with fragmented distributions and similar habitat requirements, such as Massoutiera mzabi. This species is usually found on the slopes of mountains and river banks, living in rocky fissures where water accumulates after the rains and relatively rich vegetation develops (George 1981, Gouat et al. 1984, Aulagnier 2008b). Although the relationship
Brought to you by | Universidade do Porto (Universidade do Porto) Authenticated | 172.16.1.226 Download Date | 6/28/12 2:15 PM
206
C.G. Vale et al.: Distribution, habitats and conservation of Felovia
of M. mzabi with water availability is unclear, the species apparently presents morphological adaptations to dry conditions (Gouat 1993). Therefore, the methodological approach used here should be applied to other desert isolated species, particularly to other gundis, for the quantification of suitable habitats.
Acknowledgments This study was partially supported by two grants from the National Geographic Society (7629-04 and 8412-08) and by Fundação para a Ciência e Tecnologia (PTDC/BIA-BEC/099934/2008). C.G.V. has a PhD grant (SFRH/BD/72522/2010) and J.C.B. has a contract (Programme Ciência 2007), both from FCT. Logistic support for the expeditions was given by Pedro Lopes Lda. (Trimble GPS), Off Road Power Shop and A. Araújo (P.N. Banc d’Arguin). A.L. Acosta, F. Martínez-Freiría, H. Rebelo, P. Sierra, N. Sillero, P. Tarroso and R. Vasconcelos helped in the fieldwork. The manuscript was greatly improved from a first draft by the comments of A. Jacobson, L. Granjon and an anonymous reviewer.
References Ahmed, A.O.C., H. Yasuda, K. Hattori and R. Nagasawa. 2008. Analysis of rainfall records (1923–2004) in Atar-Mauritania. Geofizika 25: 53–64. Akçakaya, H.R. and S. Ferson. 2001. Ramas Red list: threatened species classifications under uncertainty. User manual for version 2.0. Applied Biomathematics, New York. Amori, G. and S. Gippoliti. 2003. A higher-taxon approach to rodent conservation priorities for the 21st century. Anim. Biodivers. Conserv. 26: 1–18. Aulagnier, S. 2008a. Felovia vae. In: IUCN 2009. IUCN red list of threatened species. Version 2009.1. Available at: http://www.iucnredlist.org/. Downloaded on 20 September, 2009. Aulagnier, S. 2008b. Massoutiera mzabi. In: IUCN 2011. IUCN red list of threatened species. Version 2011.1. Available at: http:// www.iucnredlist.org. Downloaded on 28 September, 2011. Beyer, H.L. 2006. Hawth’s analysis tools ver. 3.26. Available at: http://www.spatialecology.com/htools. Bicheron, P., P. Defourny, C. Brockmann, L. Schouten, C. Vancutsem, M. Huc, S. Bontemps, M. Leroy, F. Achard, M. Herold, F. Ranera and O. Arino. 2008. GLOBCOVER: products description and validation report. Medias-France and Postel, Toulouse, France. Available at: http://postel.mediasfrance.org/. Brito, J.C., A.L. Acosta, F. Álvares and F. Cuzin. 2009. Biogeography and conservation of taxa from remote regions: an application of ecological-niche based models and GIS to North-African Canids. Biol. Conserv. 142: 3020–3029. Brito, J.C., F. Álvares, F. Martínez-Freiría, P. Sierra, N. Sillero and P. Tarroso. 2010. Data on the distribution of mammals from Mauritania, West Africa. Mammalia 74: 449–455. Brooks, N. 2004. Drought in the African Sahel: long term perspectives and future prospects. Tyndall Centre Working Paper No. 61. Tyndall Centre for Climate Change Research, Norwich, UK. Buisson, L., W. Thuiller, N. Casajus, S. Lek and G. Grenouillet. 2010. Uncertainty in ensemble forecasting of species distribution. Glob. Change Biol. 16: 1145–1157. Carvalho, S.B., J.C. Brito, E.J. Crespo and H.P. Possingham. 2010. From climate change predictions to actions – conserving
vulnerable animal groups in hotspots at a regional scale. Glob. Change Biol. 16: 3257–3270. Dekeyser, P.L. and A. Villiers. 1956. Contribution à l’étude du peuplement de la Mauritanie. Notations écologiques et biogéographiques sur la faune de l’Adrar. Mémoires de l’Institut Français d’Afrique Noire 44: 9–222. de Rouffignac, C.D., L. Bankir, and N. Roinel. 1981. Renal function and concentrating ability in a desert rodent: the gundi (Ctenodactylus vali). Pflüg. Arch. 390: 138–144. ESRI, 2006. ArcMap 9.2. Environmental Systems Research Institute, Inc., Redlands, CA, USA. Fielding, A.H. and J.F. Bell. 1997. A review of methods for the assessment of prediction errors in conservation presence/absence models. Environ. Conserv. 24: 38–49. GBIF. 2009. Global Biodiversity Information Facility. Available at: http://data.gbif.org. Accessed on 29 July, 2009. George, W. 1974. Note on the ecology of Gundis (F. Ctenodactylidae). Symp. Zool. Soc. Lond. 34: 143–160. George, W. 1978. Reproduction in female gundis (Rodentia: Ctenodactylidae). J. Zool. 185: 57–71. George, W. 1979. The chromosomes of the hystricomorphous family Ctenodactylidae (Rodentia:?Sciuromorpha) and their bearing on the relationships of the four living genera. Zool. J. Linn. Soc. 65: 261–280. George, W. 1981. Species-typical calls in the Ctenodactylidae (Rodentia). J. Zool. 195: 39–52. Gouat, P. 1993. Biometrics of the digestive tract of three species of Ctenodactylidae: comparison with other rodents. Zeitshr. Säugetierk. 58: 191–193. Gouat, P., J. Gouat and J. Coulon. 1984. Répartition et habitat de Massoutiera mzabi (Rongeur Cténodactylidé) en Algérie. Mammalia 48: 351–362. Granjon, L. and J.M. Duplantier. 2009. Les rongeurs de l’Afrique sahélo-soudanienne. Editions de l’IRD (Collection Faune et Flore tropicales). Marseille, France. Held, I.M., T.L. Delworth, J. Lu, K.L. Findell and T.R. Knutson. 2005. Simulation of Sahel drought in the 20th and 21st centuries. Proc. Natl. Acad. Sci. USA 102: 17891–17896. Hijmans, R.J., S.E. Cameron, J.J. Parra, P.G. Jones and A. Jarvis. 2005. Very high resolution interpolated climate surfaces for global land areas. Int. J. Climatol. 25: 1965–1978. IUCN Standards and Petitions Working Group. 2008. IUCN Standards and Petitions Working Group, 2008. Guidelines for using the IUCN red list categories and criteria. Version 7.0. Prepared by the Standards and Petitions Working Group of the IUCN SSC Biodiversity Assessments Sub-Committee. IUCN, Gland, Switzerland/Cambridge, UK. Kröpelin, S., D. Verschuren, A.-M. Lézine, H. Eggermont, C. Cocquyt, P. Francus, J.-P. Cazet, M. Fagot, B. Rumes, J.M. Russell, F. Darius, D.J. Conley, M. Schuster, H. von Suchodoletz and D.R. Engstrom. 2008. Climate-driven ecosystem succession in the Sahara: the past 6000 years. Science 320: 765–768. Le Berre, M. 1990. Faune du Sahara. 2. Mammiferes. Lechevalier, R. Chabaud, Paris, France. Mahé, G. and J.E. Paturel. 2009. 1896–2006 Sahelian annual rainfall variability and runoff increase of Sahelian Rivers. C.R. Geosci. 341: 538–546. Marmion, M., M. Parviainen, M. Luoto, R.K. Heikkinen and W. Thuiller. 2009. Evaluation of consensus methods in predictive species distribution modelling. Divers. Distrib. 15: 59–69. Nickel, H. 2003. Ökologische untersuchungen zur wirbeltierfauna im südöstlichen Mauretanien. Zwei fallstudien unter
Brought to you by | Universidade do Porto (Universidade do Porto) Authenticated | 172.16.1.226 Download Date | 6/28/12 2:15 PM
C.G. Vale et al.: Distribution, habitats and conservation of Felovia
berücksichtigung der Krokodile. GTZ, Eschborn. 89 pp. Available at: http://www2.gtz.de/dokumente/bib/04-5502.pdf. Padial, J.M. and J.L. Tellería. 2009. Observations of the Felou Gundi (Felovia vae Lataste, 1886) in central Mauritania (Rodentia: Ctenodactylidae). Mammalia 73: 153–154. Padial, J.M., P.A. Crochet, P. Geniez and J.C. Brito. in press. Amphibian conservation in Mauritania. In: (H. Heatwole and S.D. Busack, eds.) Amphibian conservation: Africa. Surrey Beatty Pty. Ltd., Sydney, Australia. Phillips, S.J., R.P. Anderson and R.E. Schapire. 2006. Maximum entropy modelling of species geographic distributions. Ecol. Modell. 190: 231–259. Phillips, S.J., M. Dudík, J. Elith, C.H. Graham, A. Lehmann, J.R. Leathwick and S. Ferrier. 2009. Sample selection bias and presence-only distribution models: implications for background and pseudo-absence data. Ecol. Appl. 19: 181–197. Ramsar. 2009. The Ramsar convention on wetlands. Available at: http://www.ramsar.org. Downloaded on 14 April, 2010.
207
Schlitter, D.A. 1989. African rodents of special concern: a preliminary assessment. In: (W.Z. Lidicker, ed.) Rodents. A world survey of species of conservation concern. IUCN, Gland, Switzerland. pp. 33–39. Tellería, J.L., H.E.M. Ghaillani, J.M. Fernández-Palacios, J. Bartolomé and E. Montiano. 2008. Crocodiles Crocodylus niloticus as a focal species for conserving water resources in Mauritanian Sahara. Oryx 42: 292–295. Trape, S. 2009. Impact of climate change on the relict tropical fish fauna of Central Sahara: threat for the survival of Adrar mountains fishes, Mauritania. PLoS ONE 4: e4400. USGS. 2006. Shuttle Radar Topography Mission (SRTM): mapping the world in 3 dimensions. United States Geological Survey, Sioux Falls, SD, USA. Available at: http://srtm.usgs.gov/index. html. Received February 8, 2011; accepted January 3, 2012; previously published online February 9, 2012
Brought to you by | Universidade do Porto (Universidade do Porto) Authenticated | 172.16.1.226 Download Date | 6/28/12 2:15 PM